Ecommerce dashboard examples and reporting templates
Transform your online store data into actionable insights with automated ecommerce dashboard templates that consolidate sales, inventory, and customer data from Shopify, Google Analytics, and advertising platforms for comprehensive business intelligence.
Ecommerce dashboard examples for every need


 +5
+5


 +4
+4

 +5
+5


 +5
+5


 +4
+4

about your case. It doesn't cost you a penny 😉
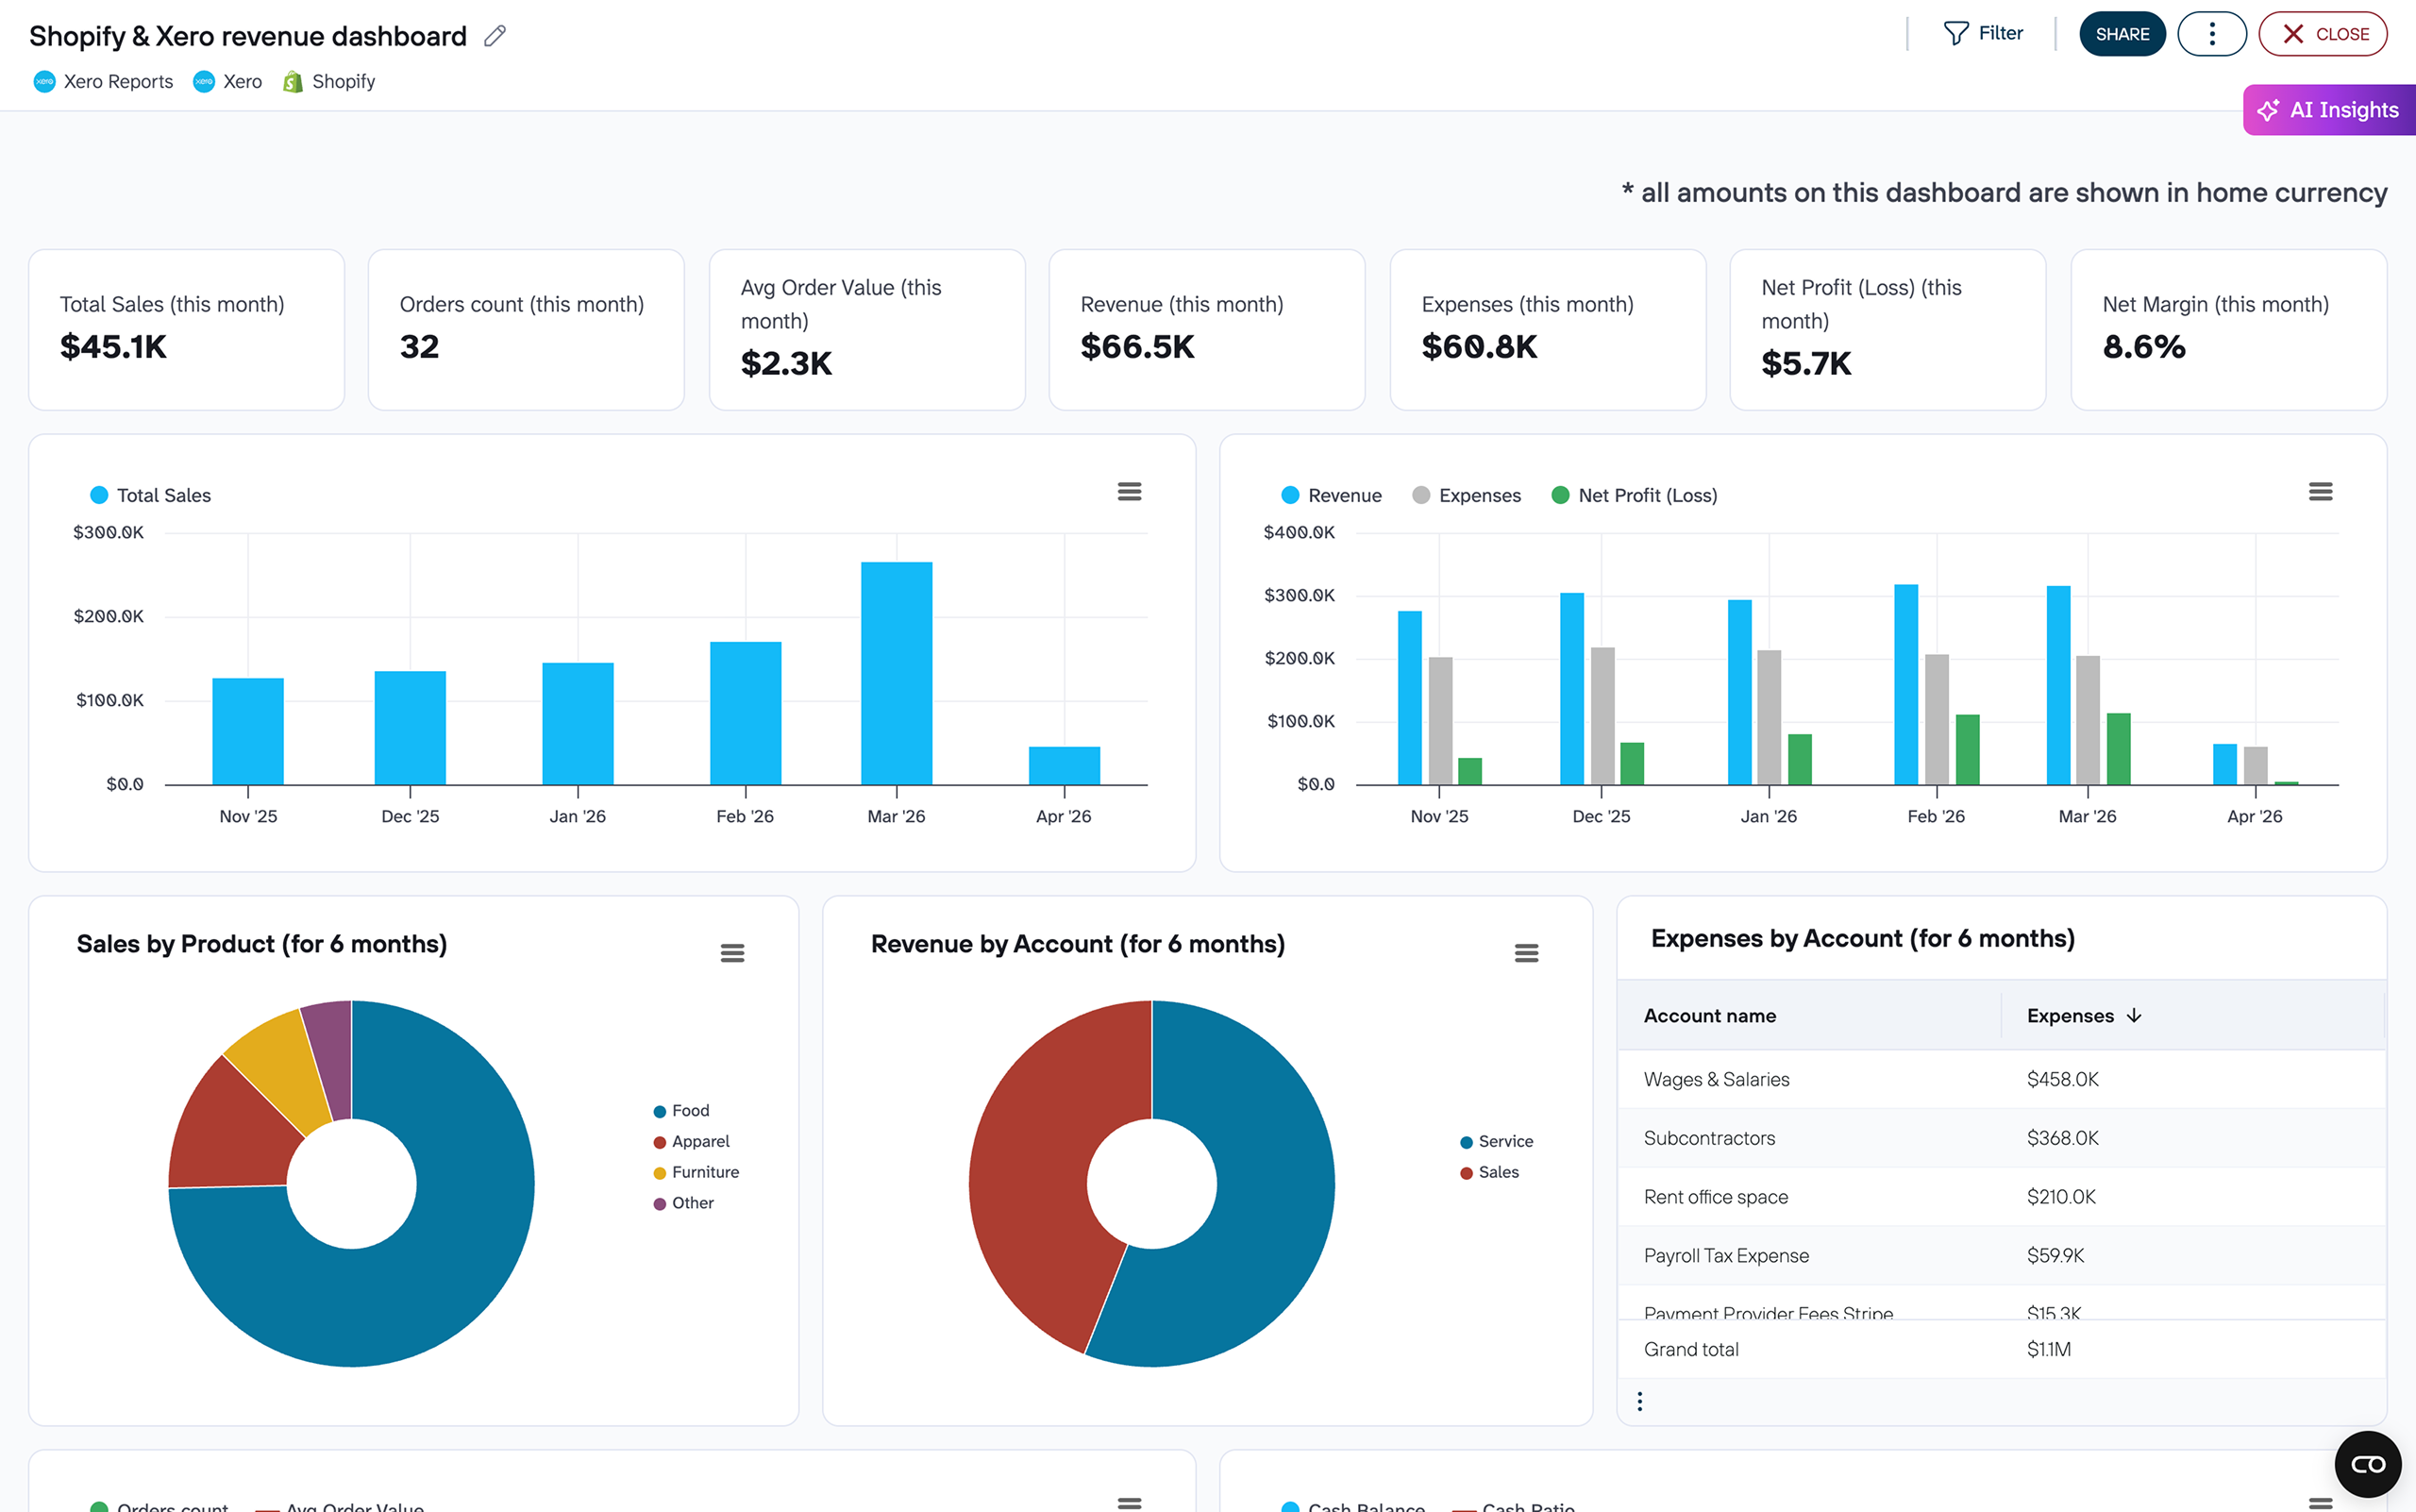
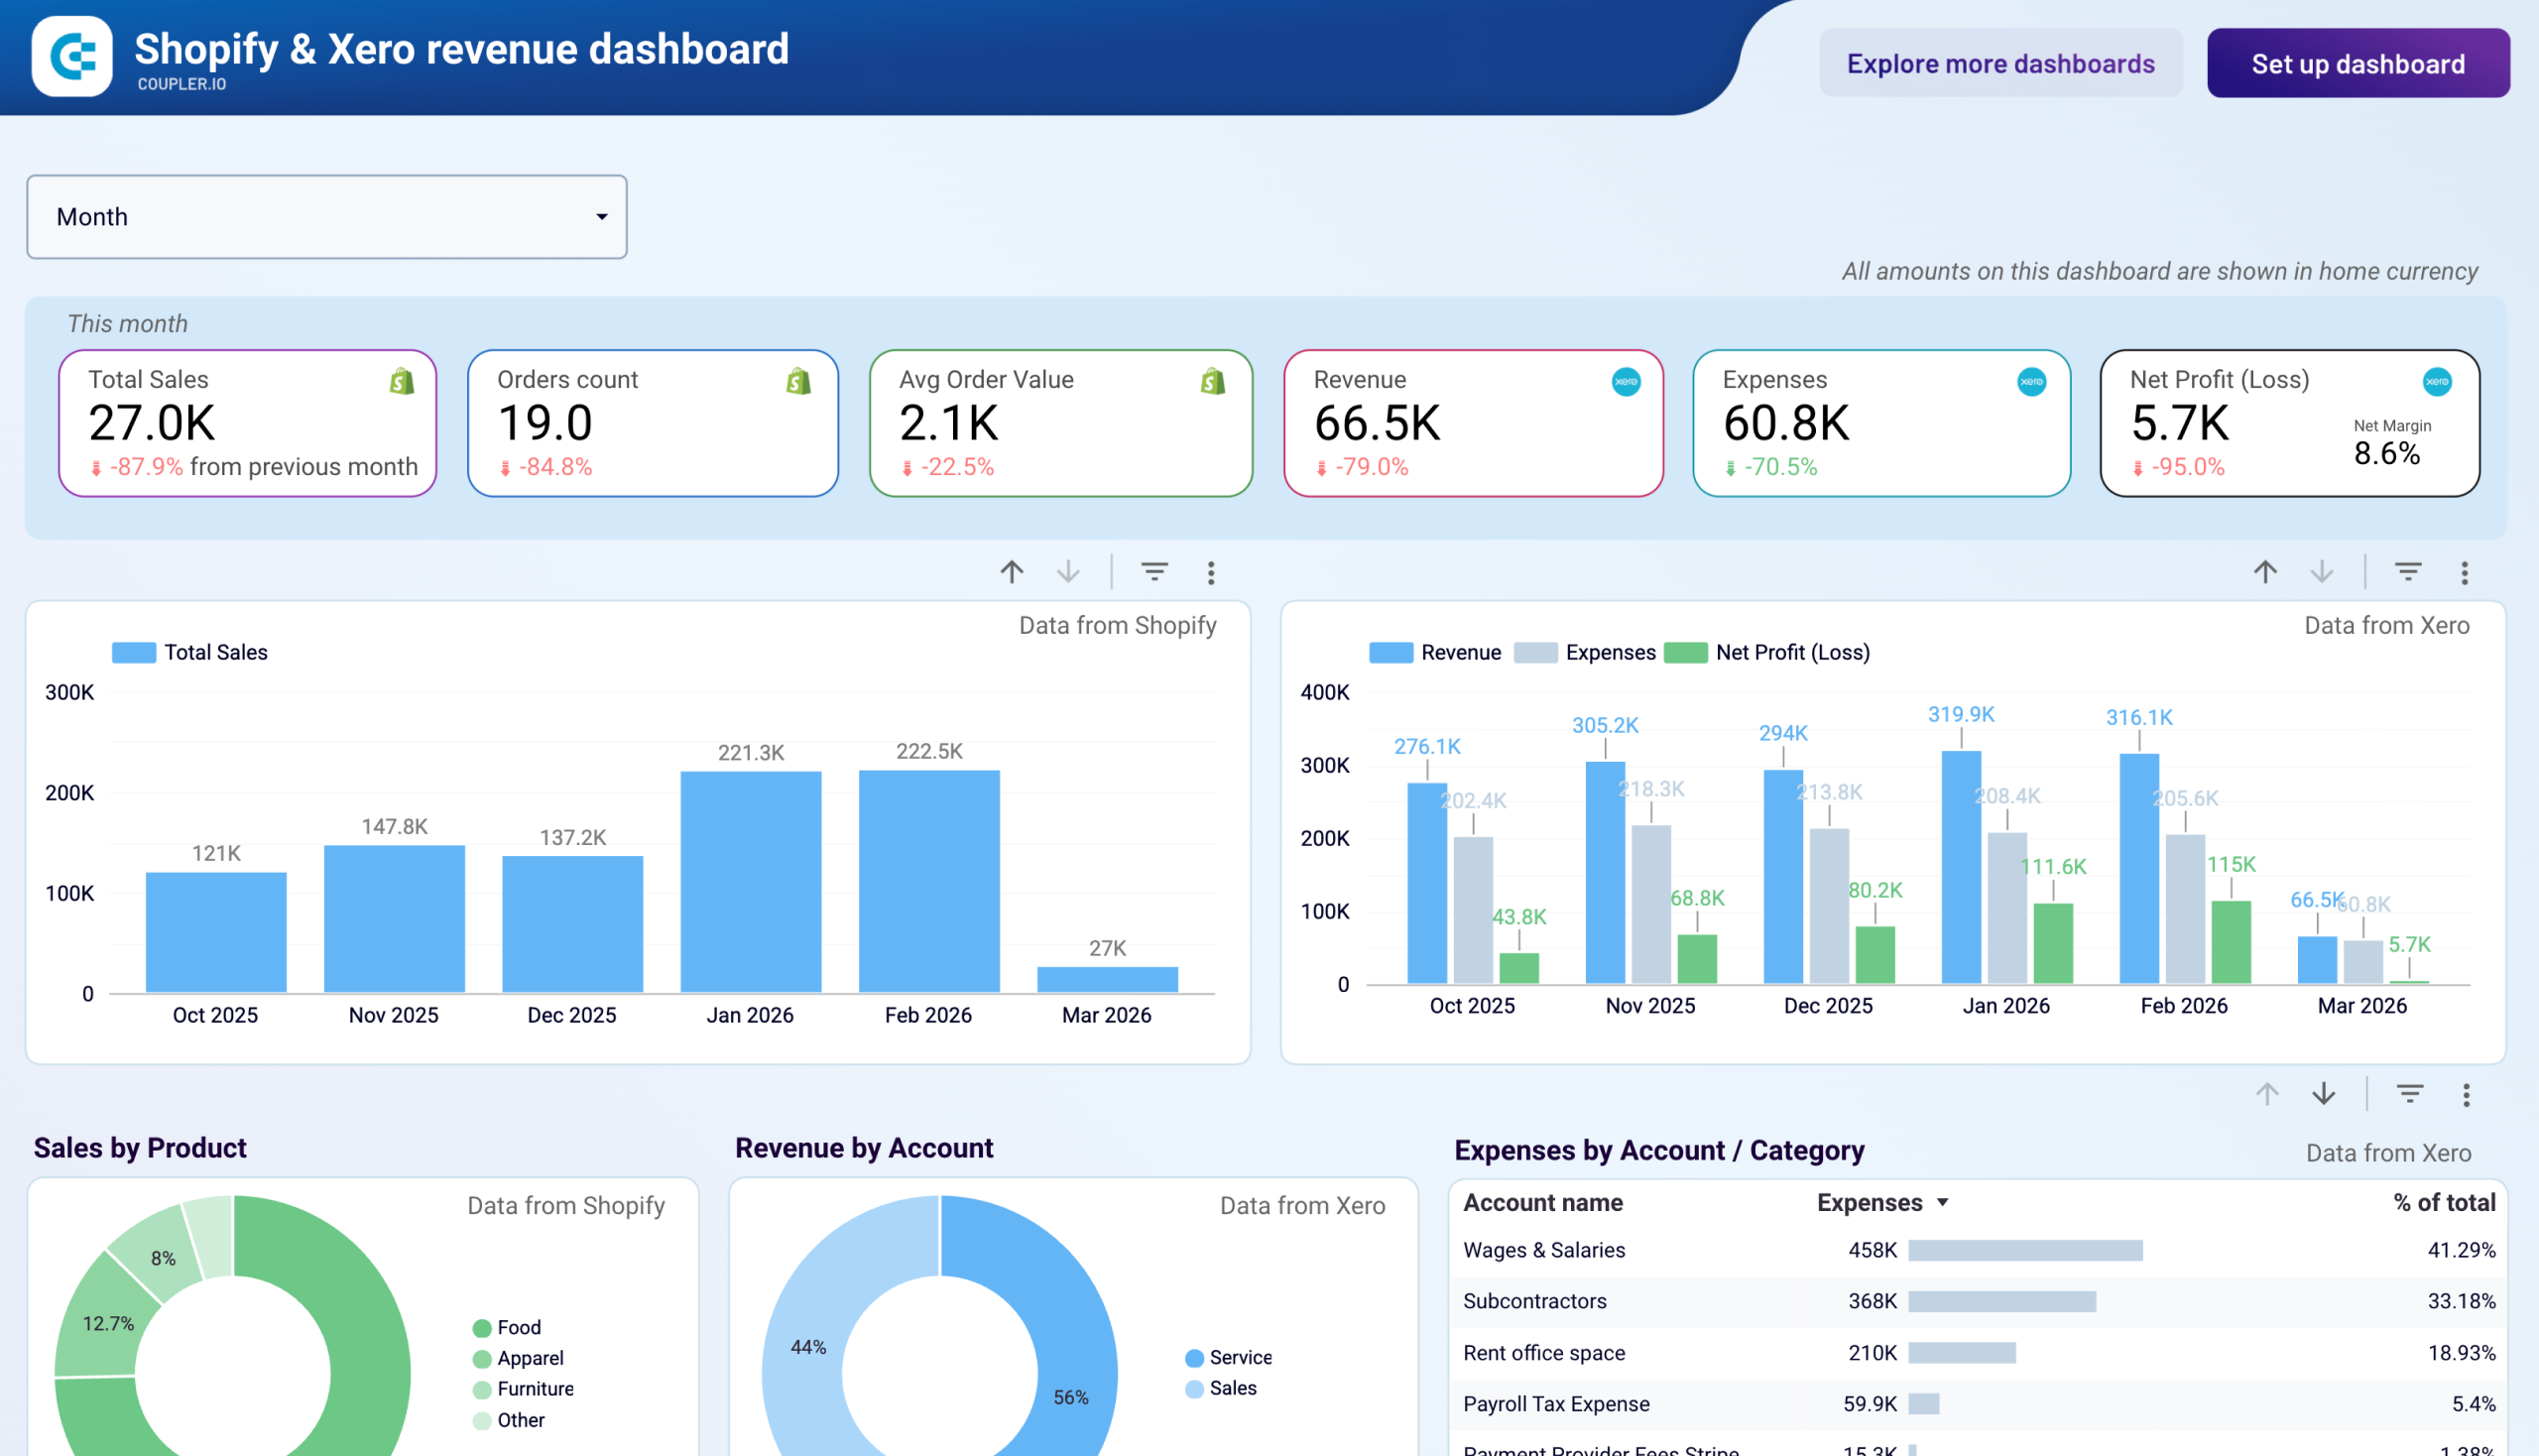
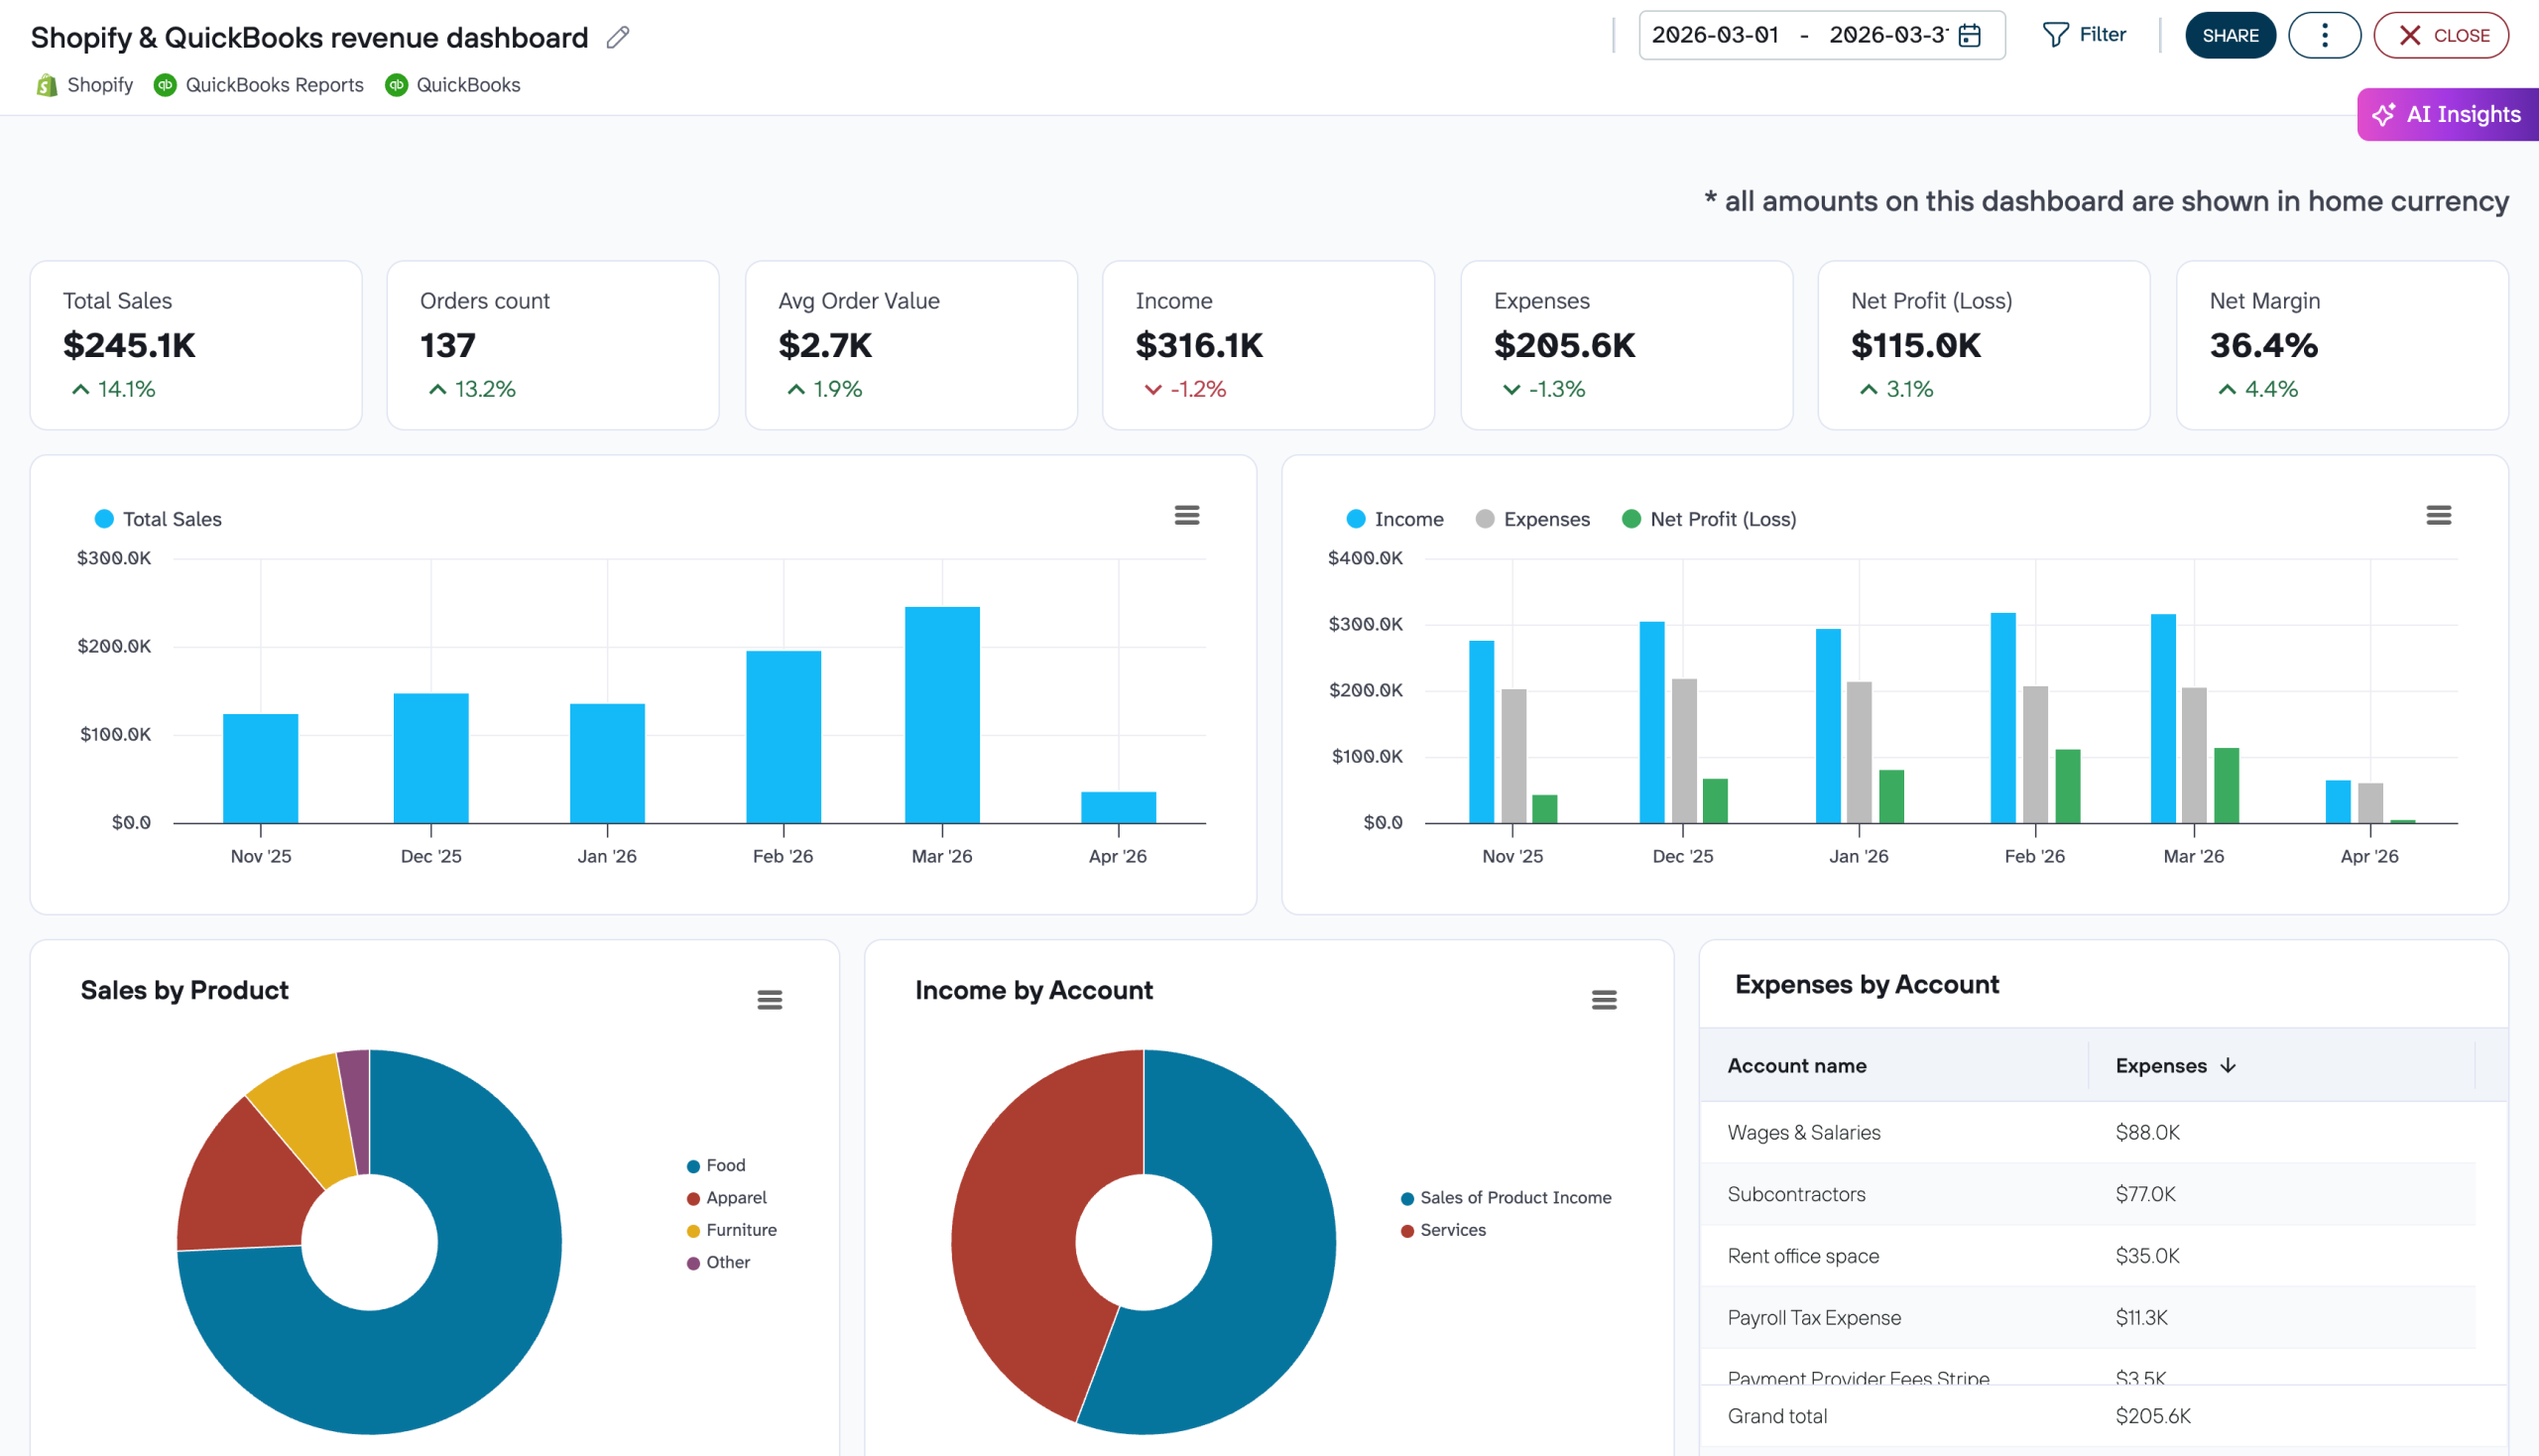
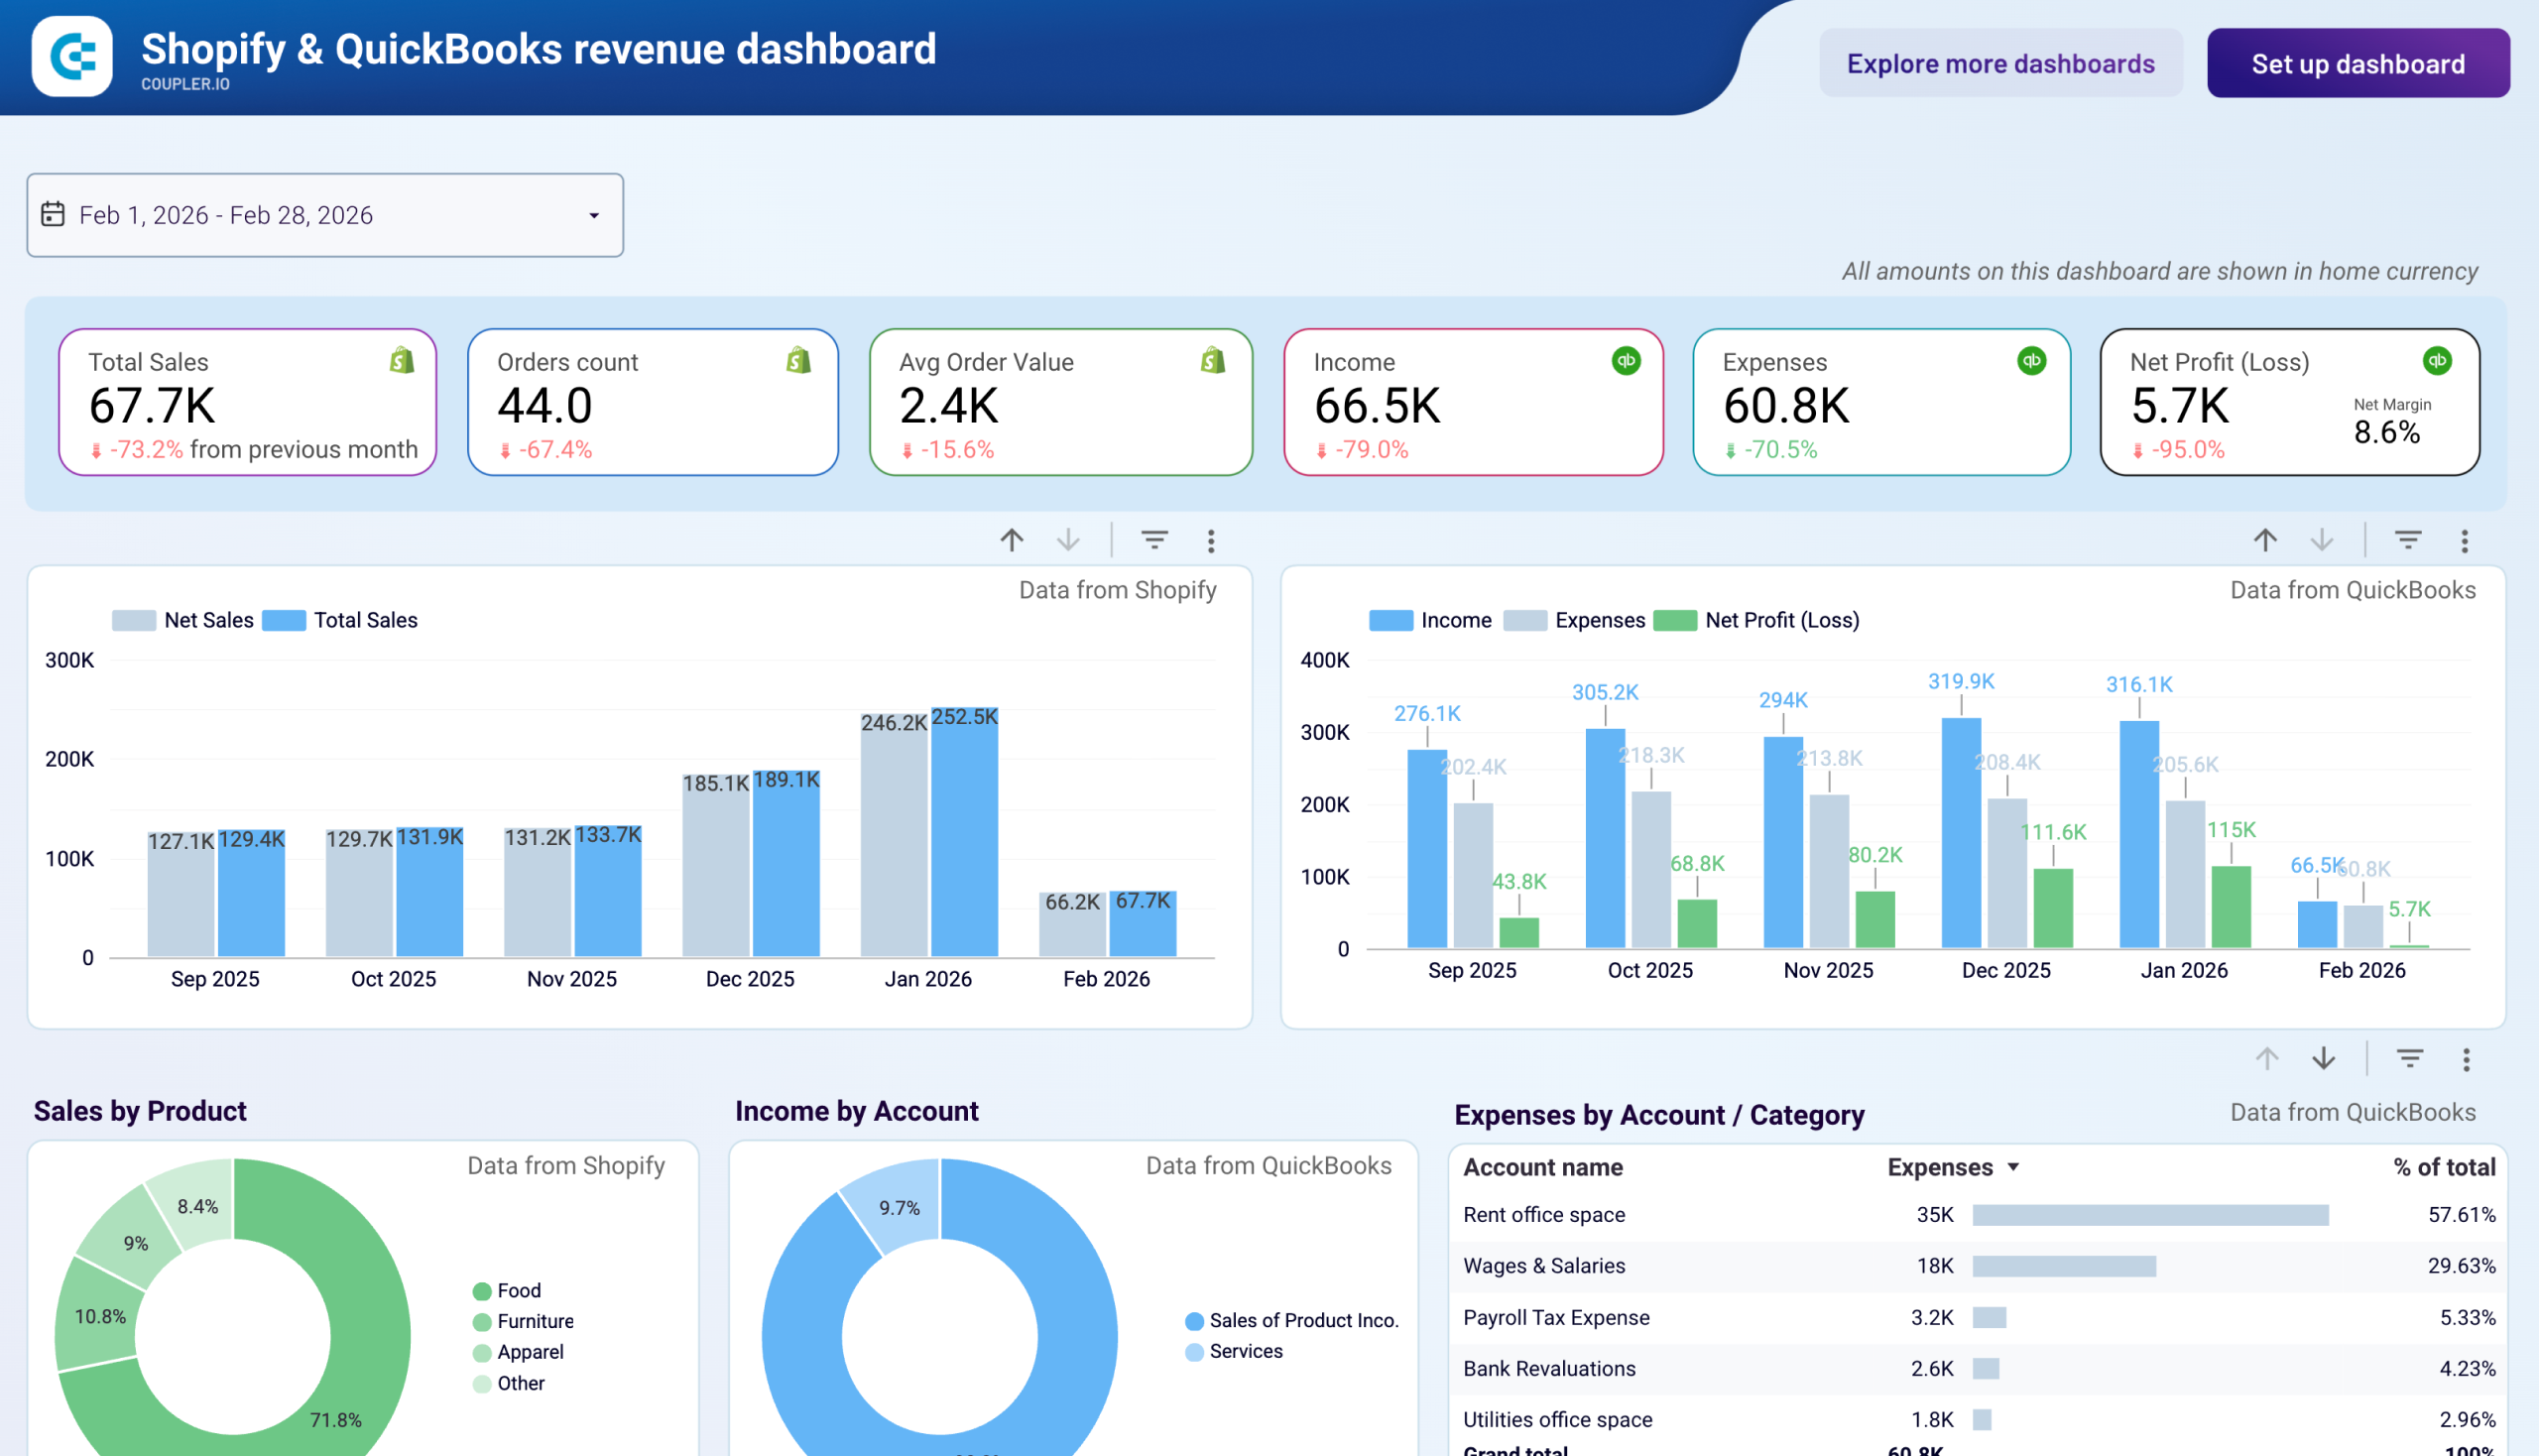
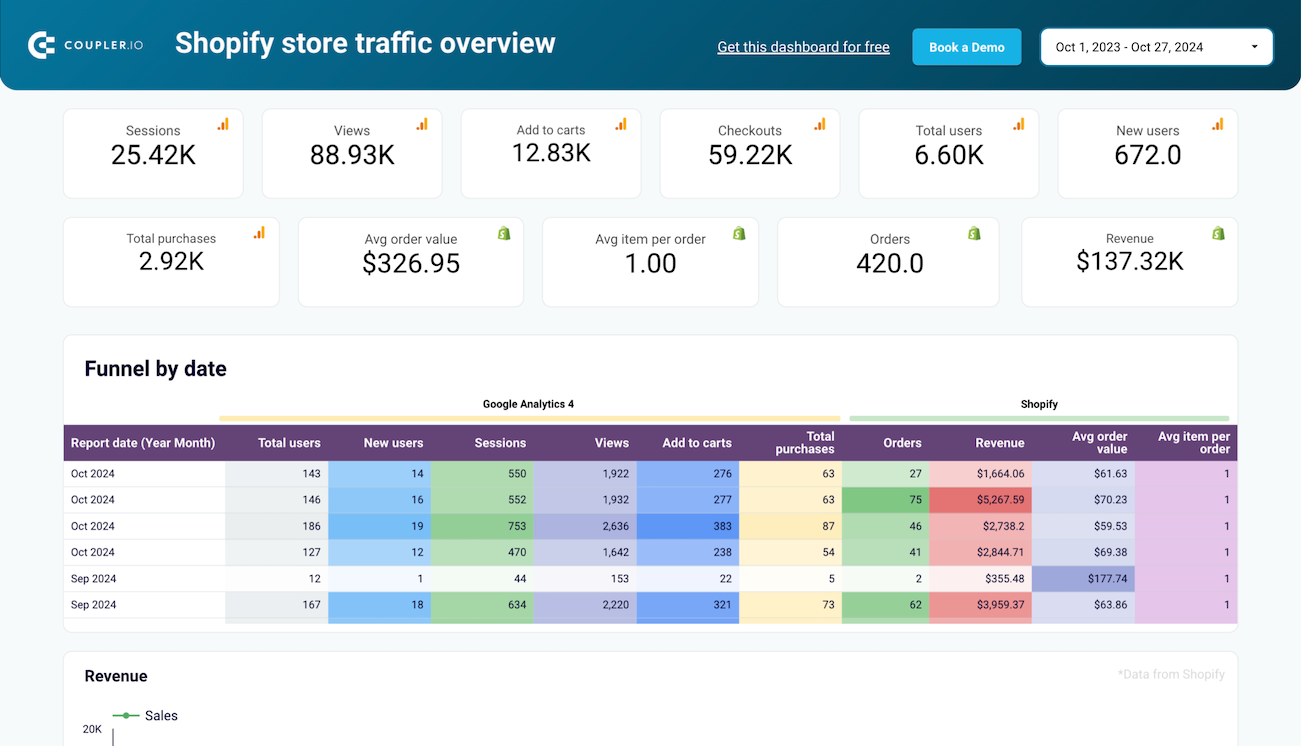
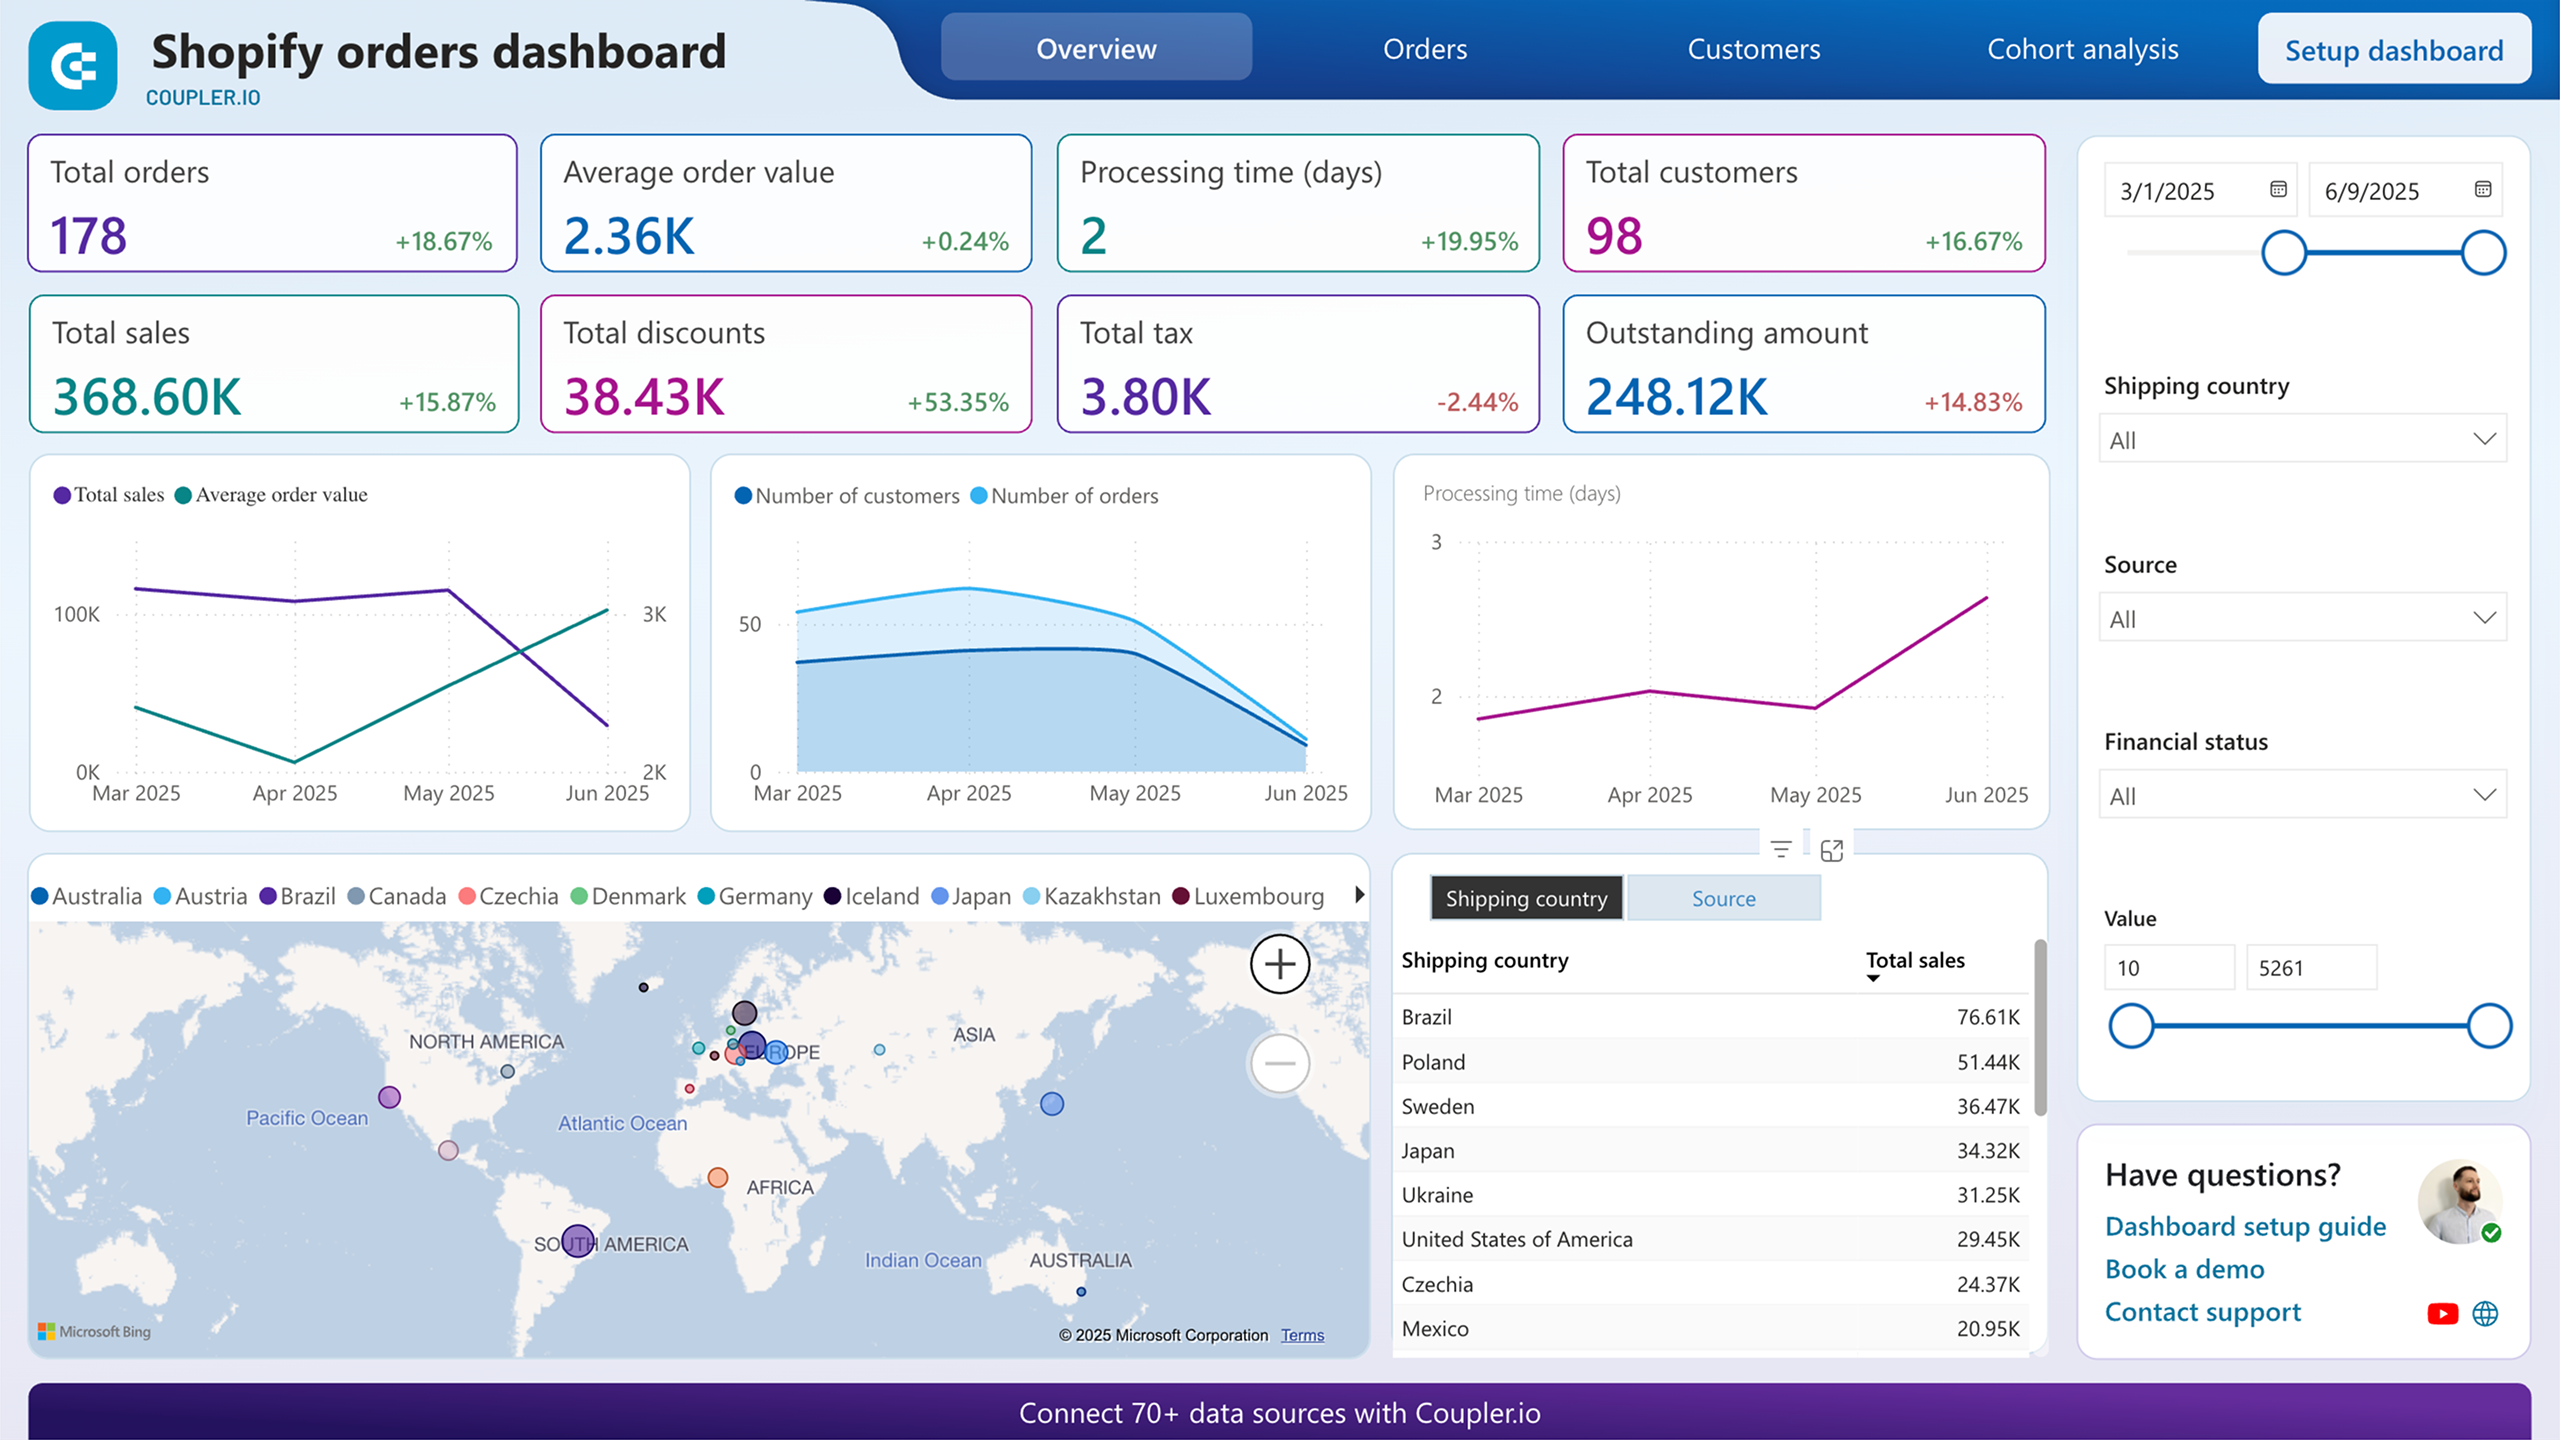
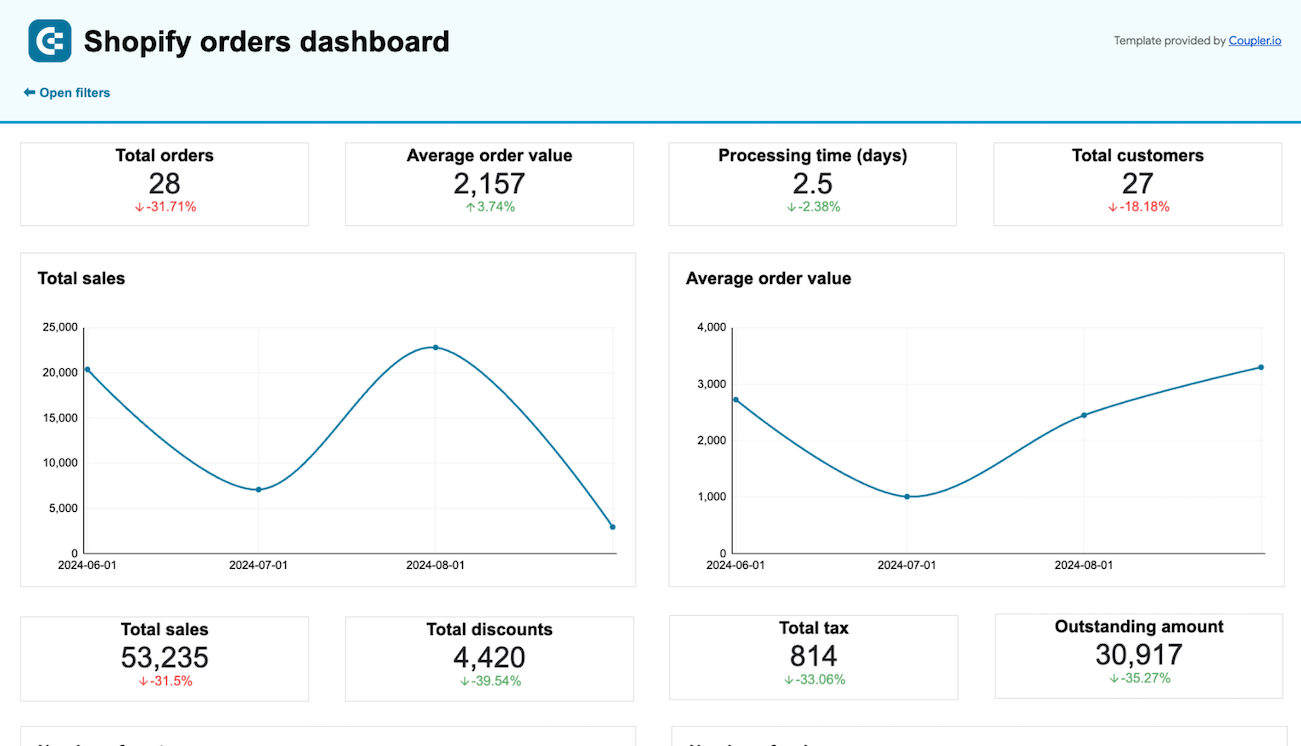
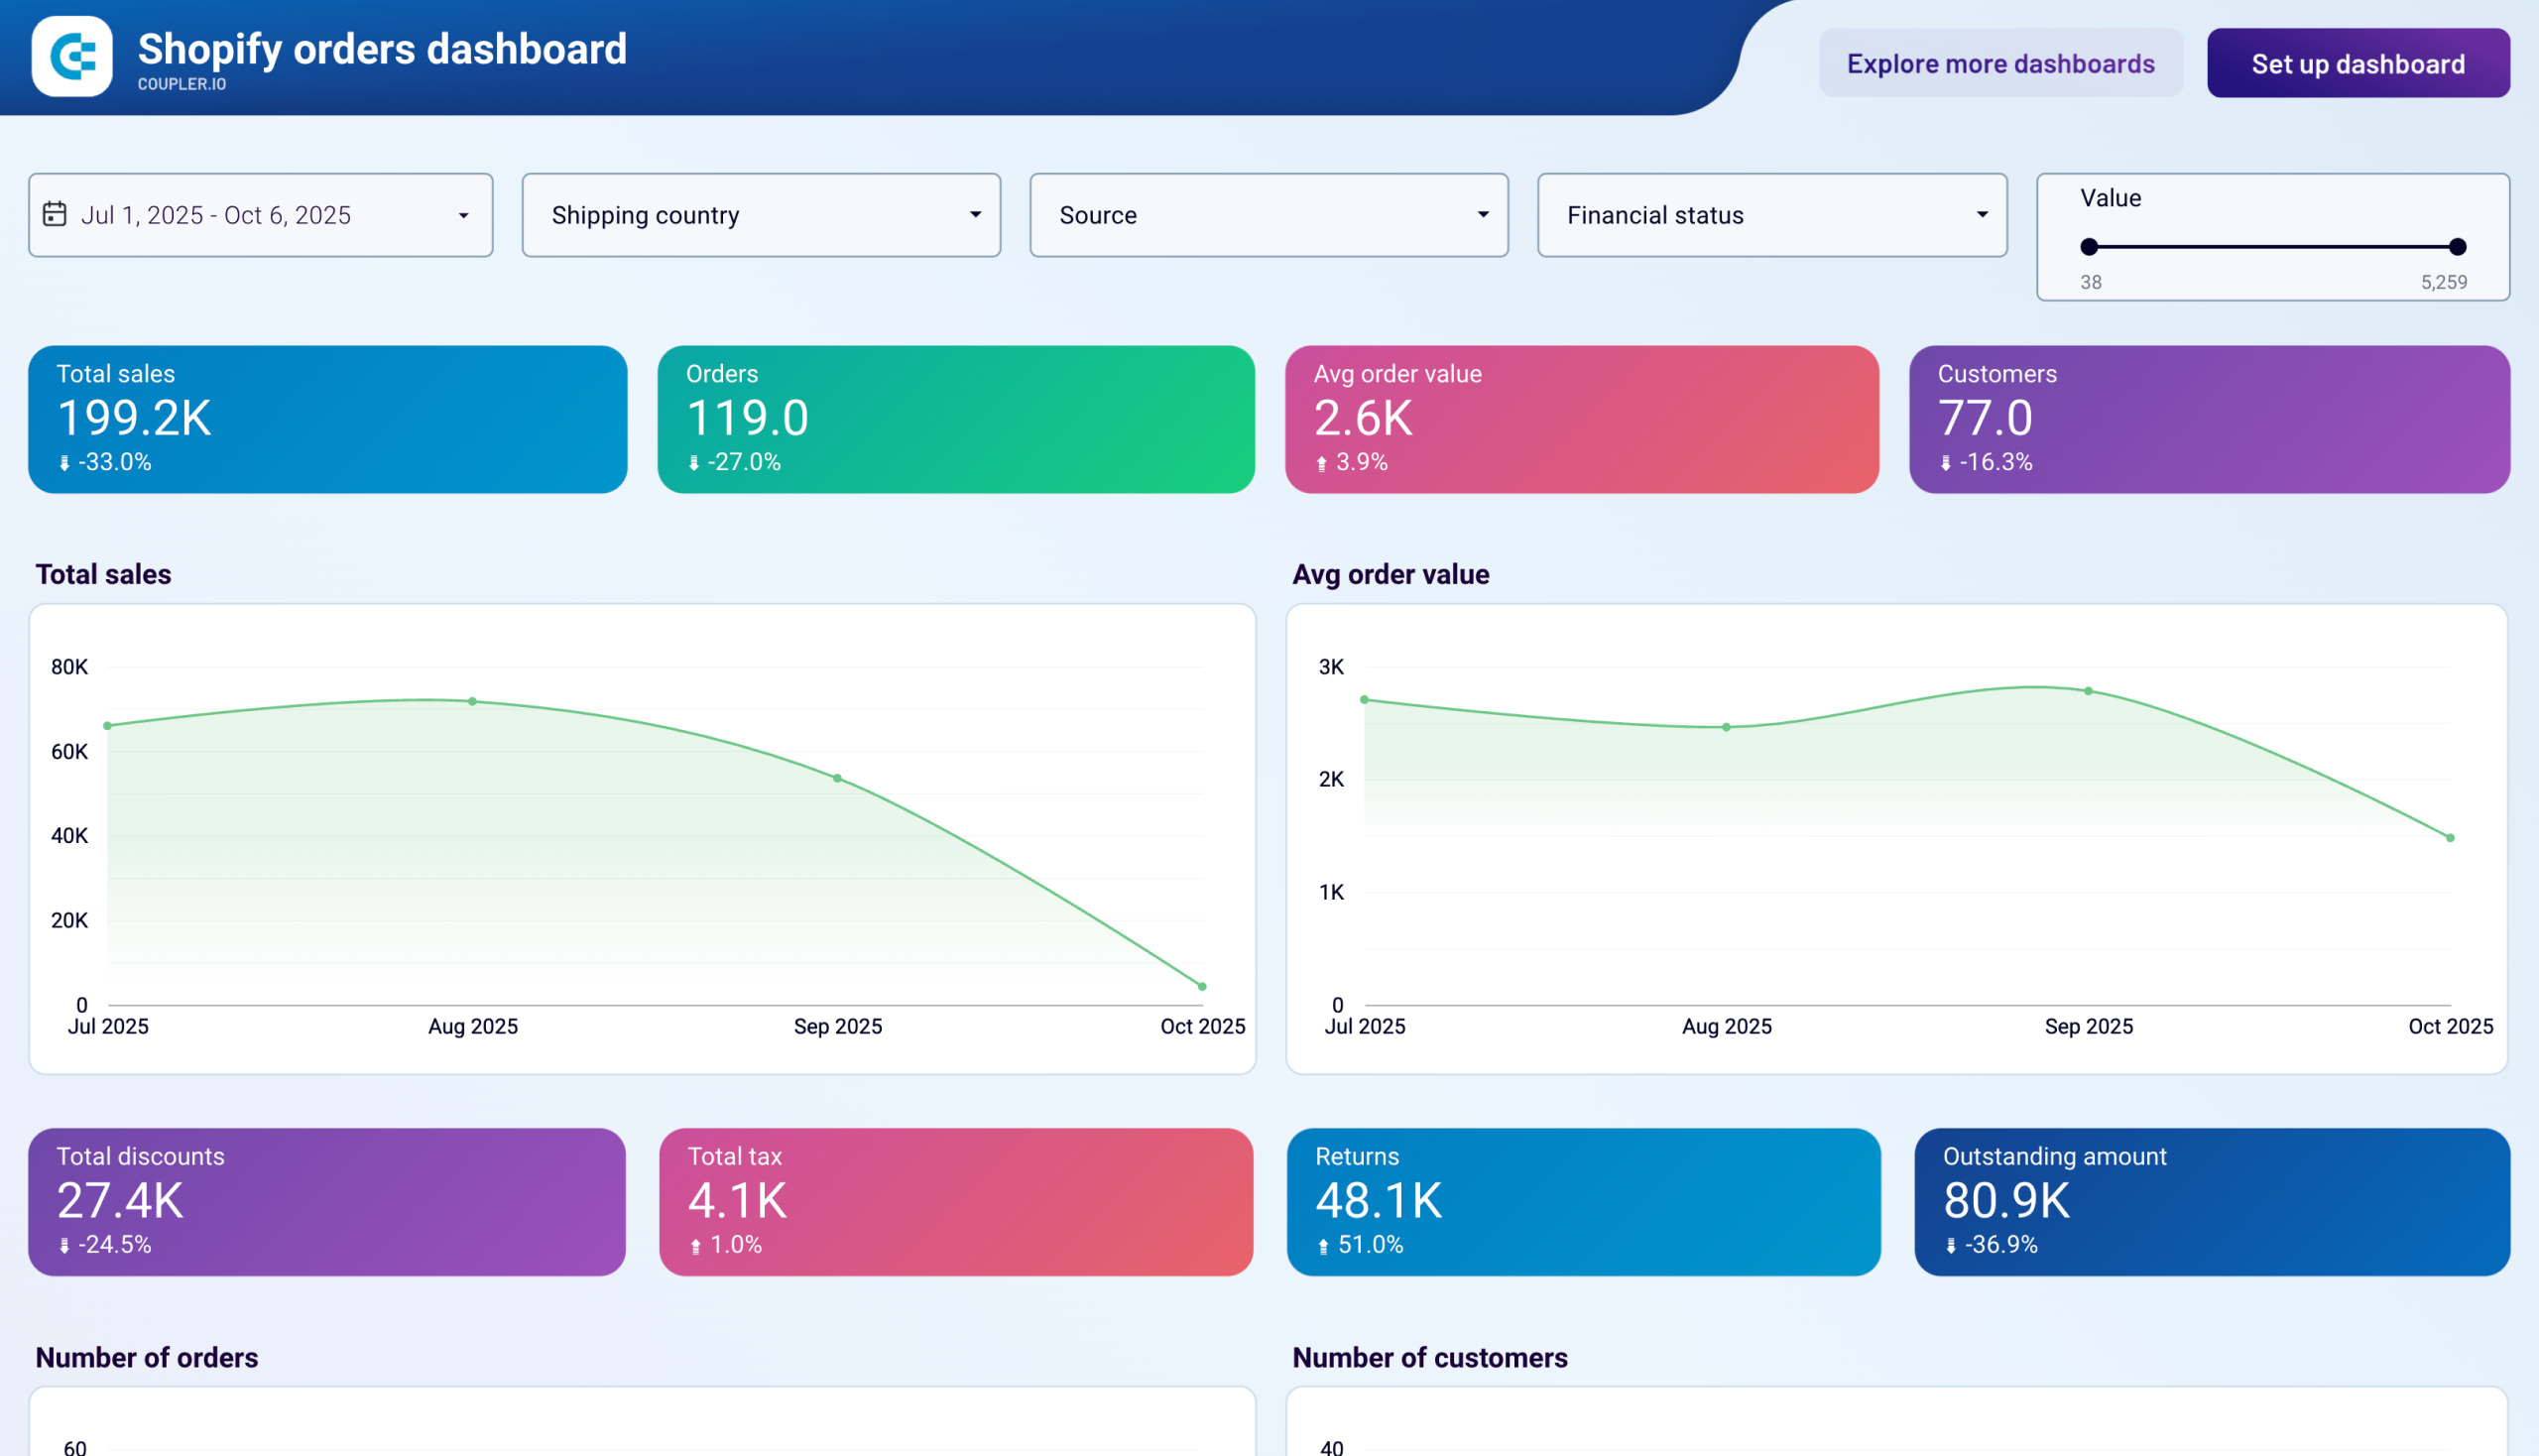
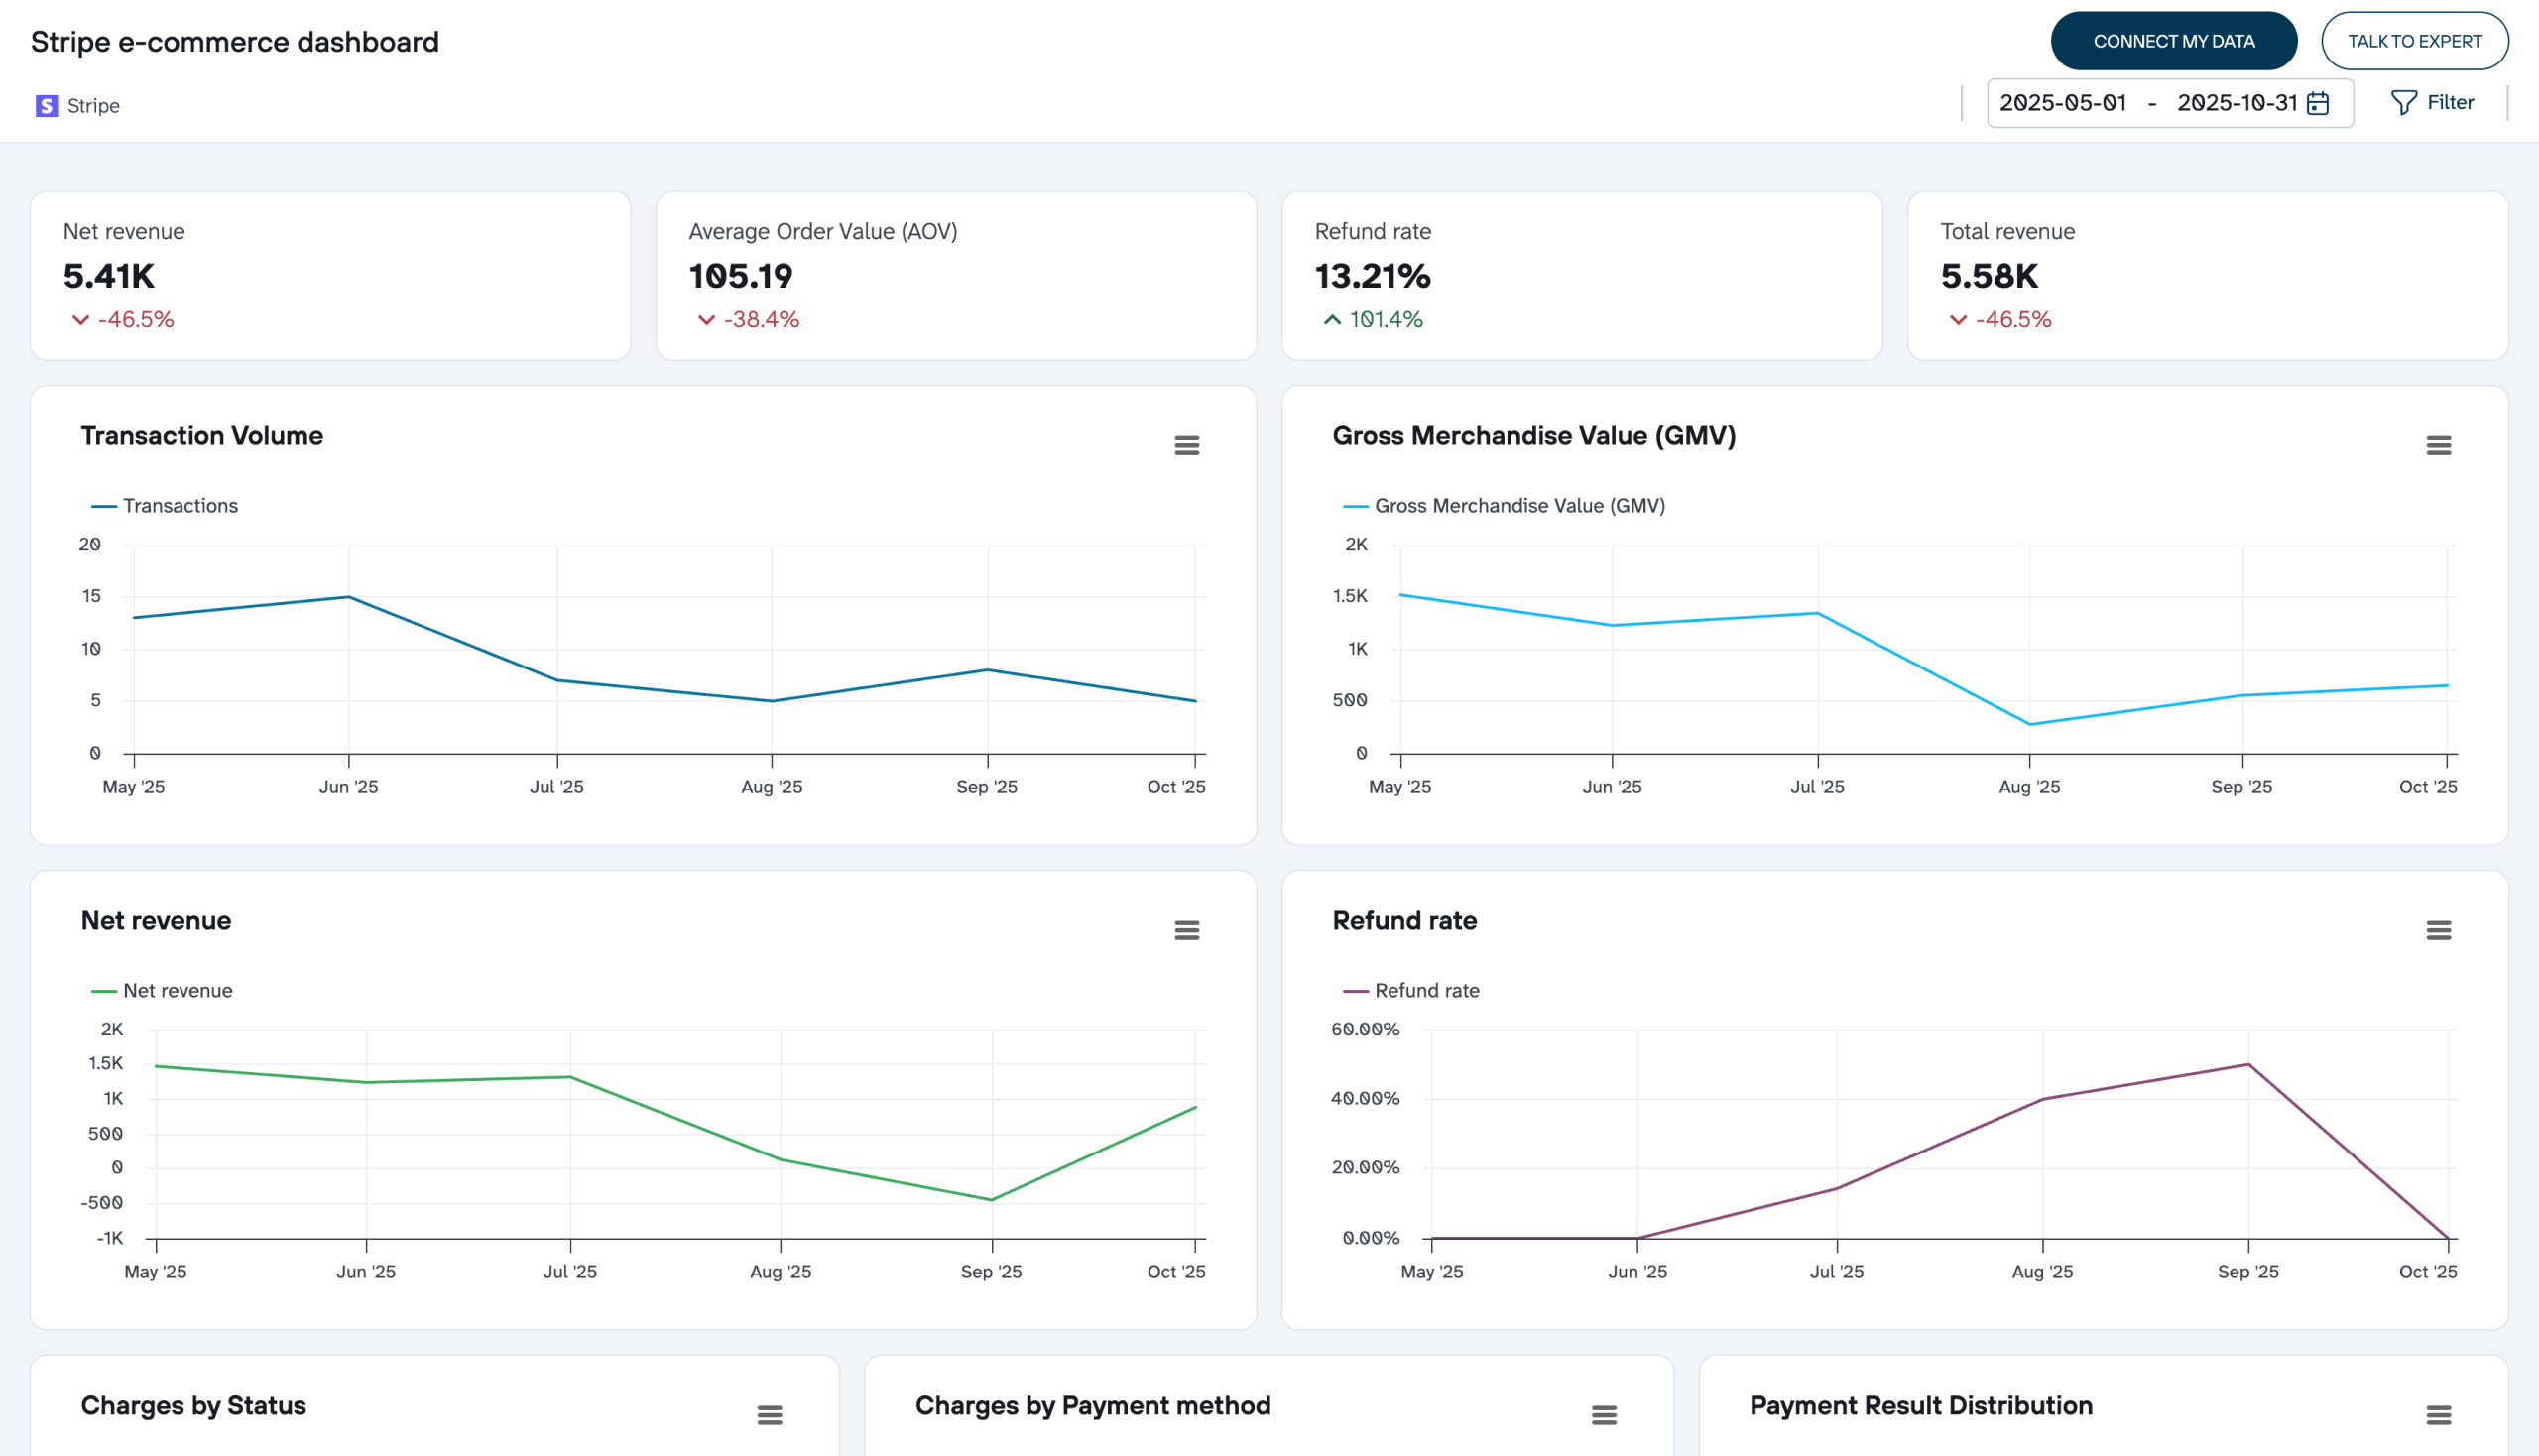
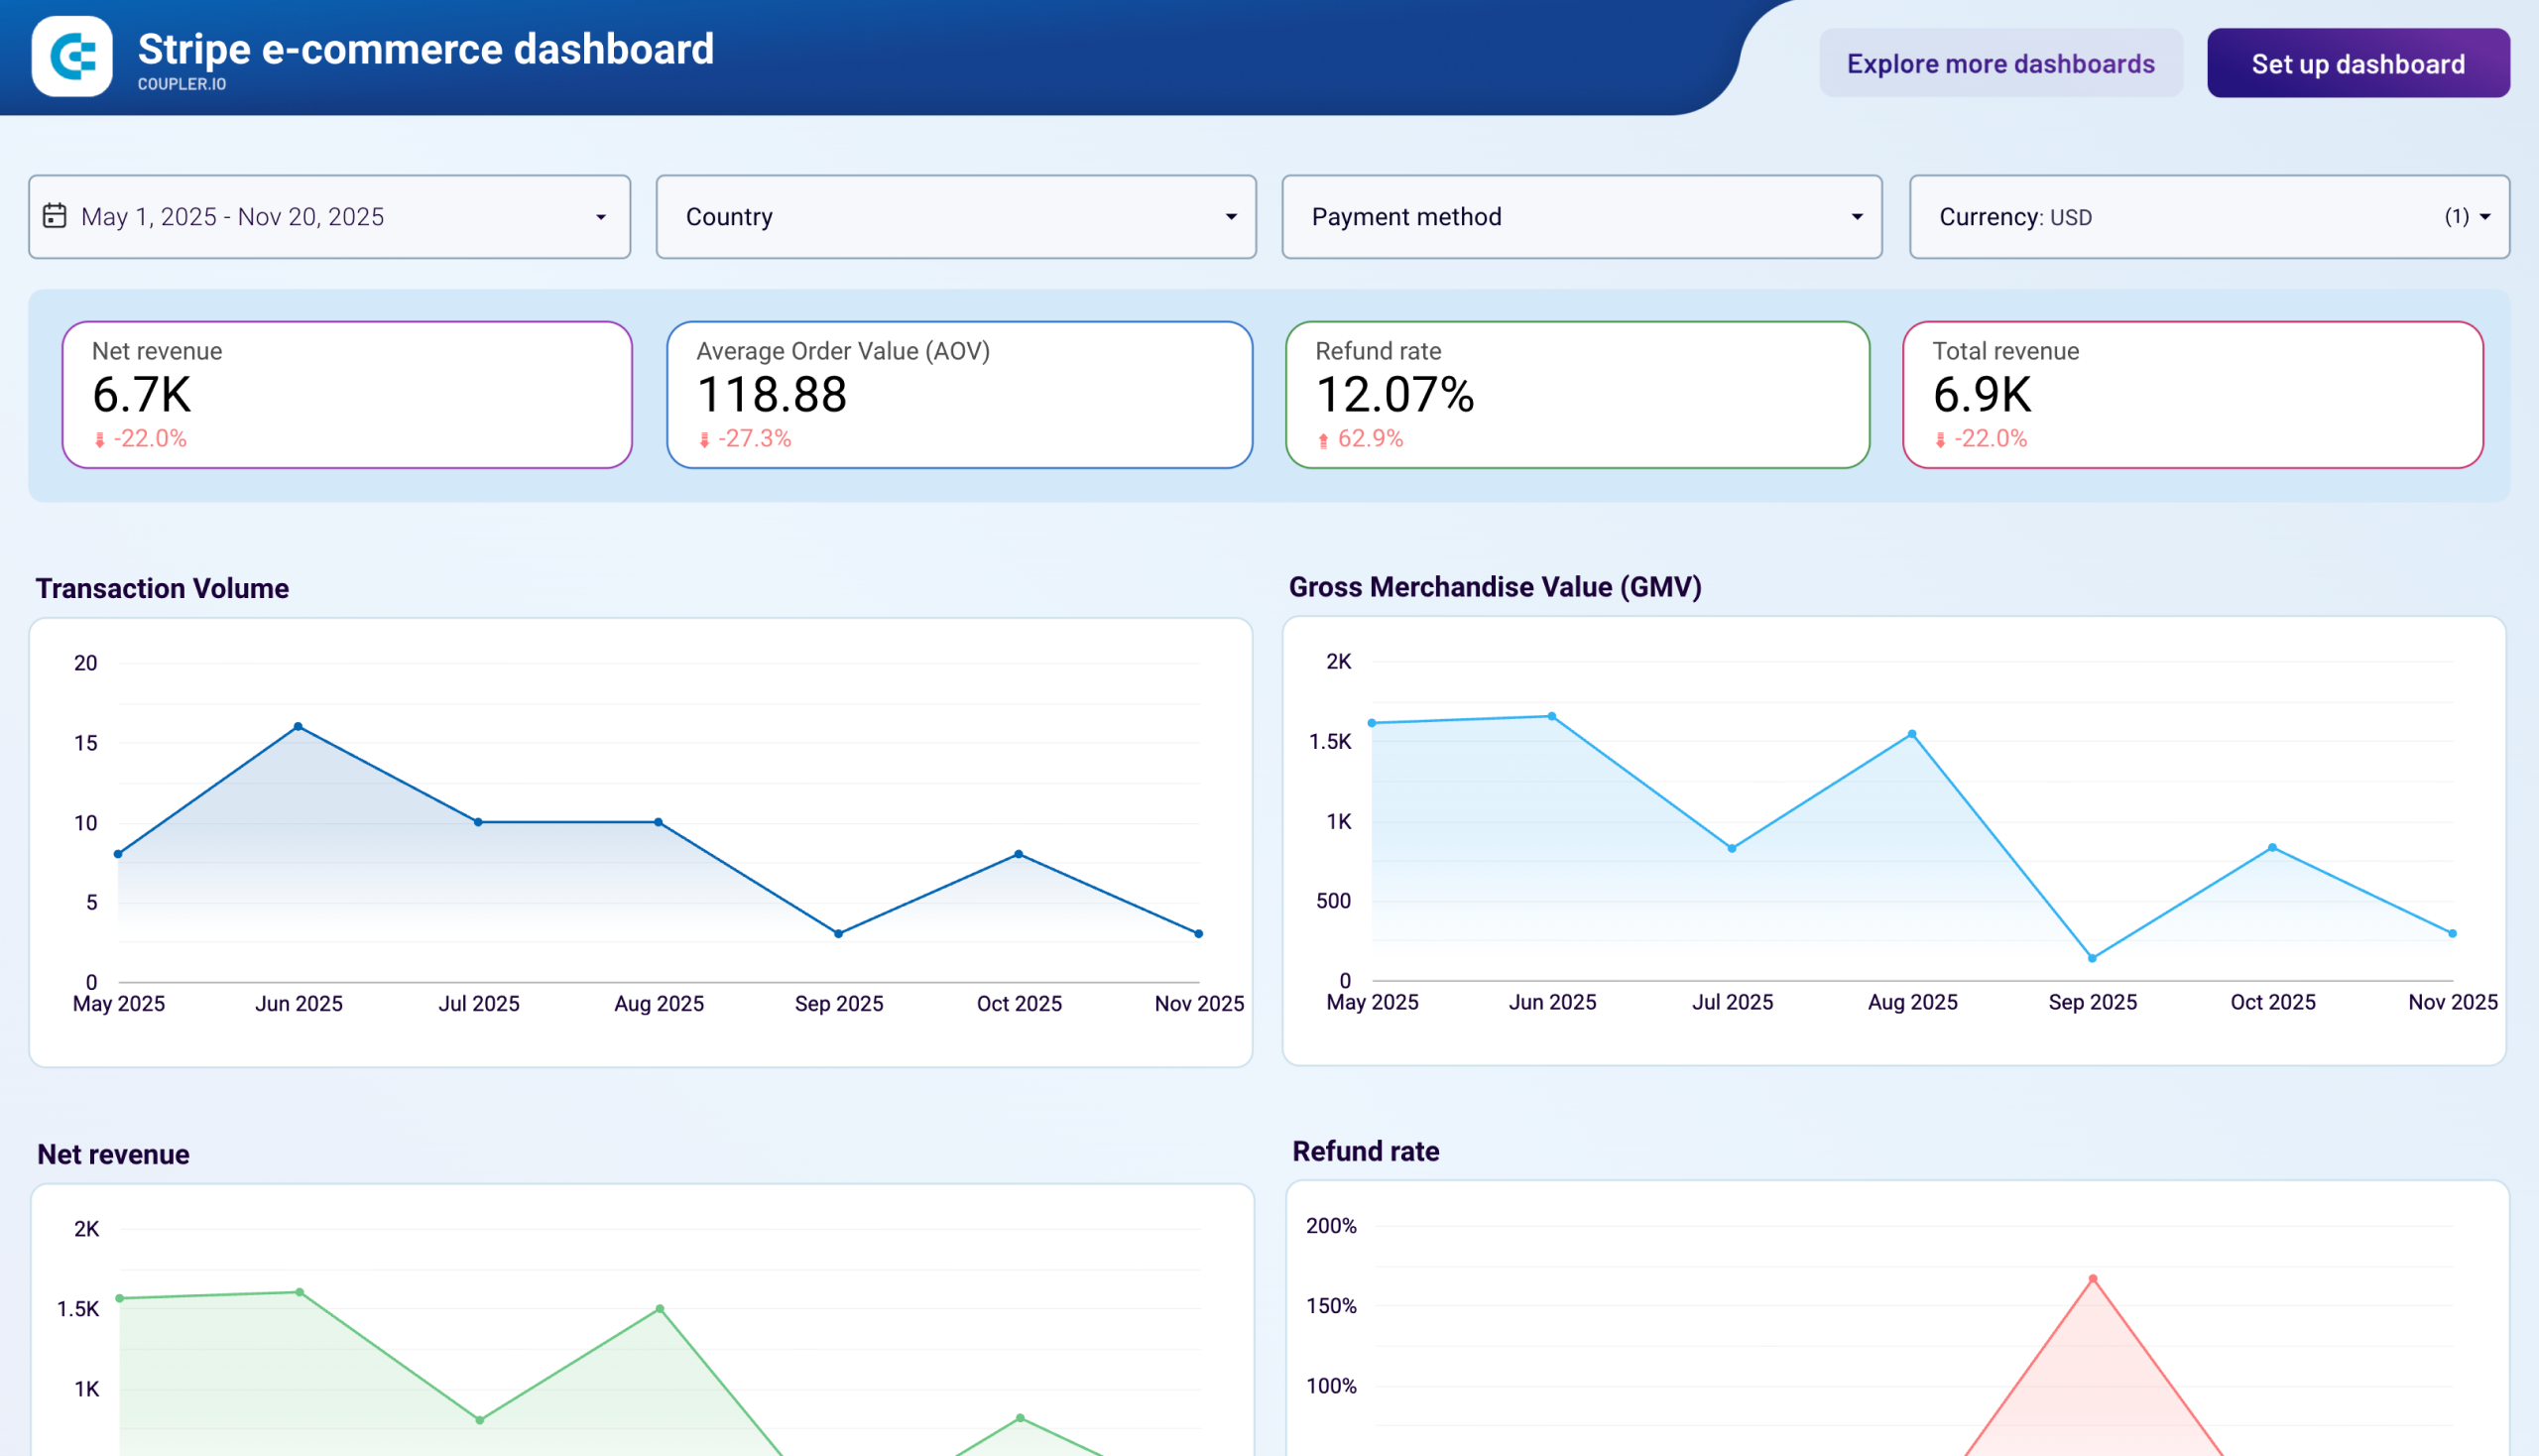
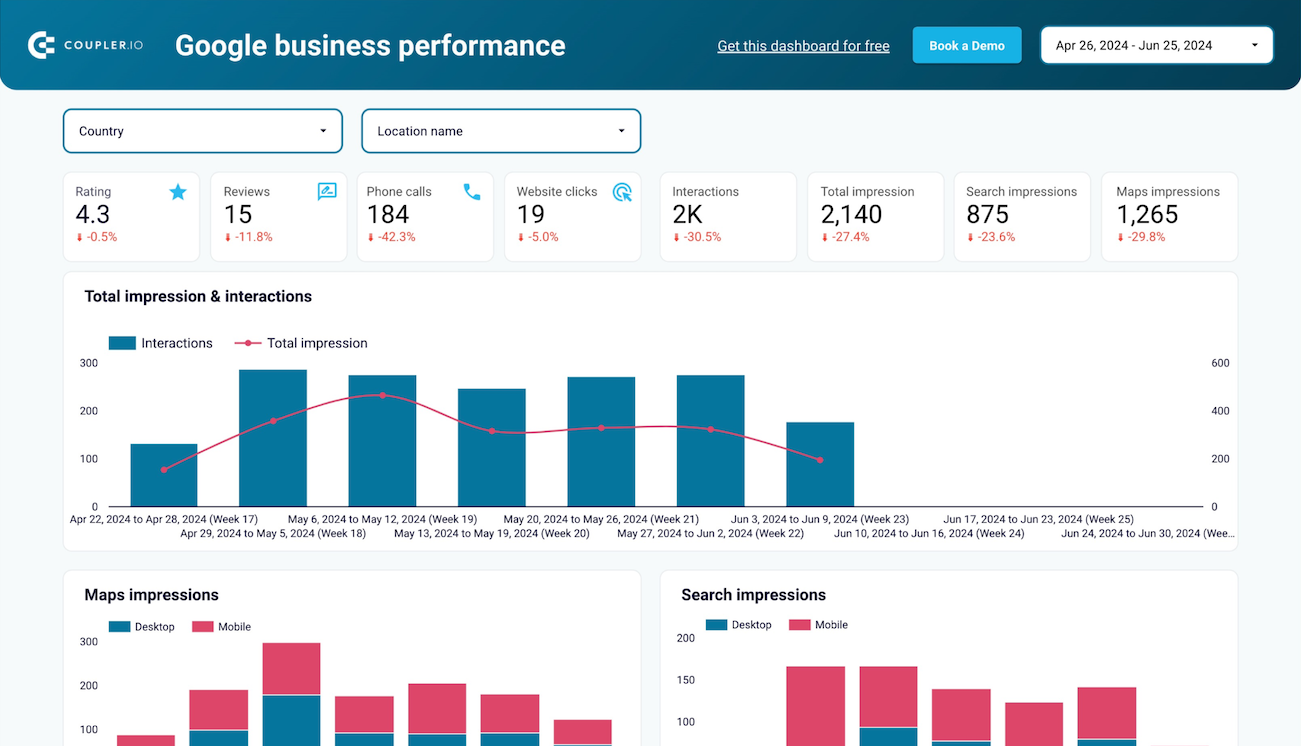
Ecommerce Analytics & KPI dashboards
Monitor essential online store metrics including revenue trends, customer acquisition costs, average order values, and conversion rates. These ecommerce dashboard templates provide comprehensive performance overviews combining sales data with marketing analytics to track business health and identify growth opportunities across all channels.
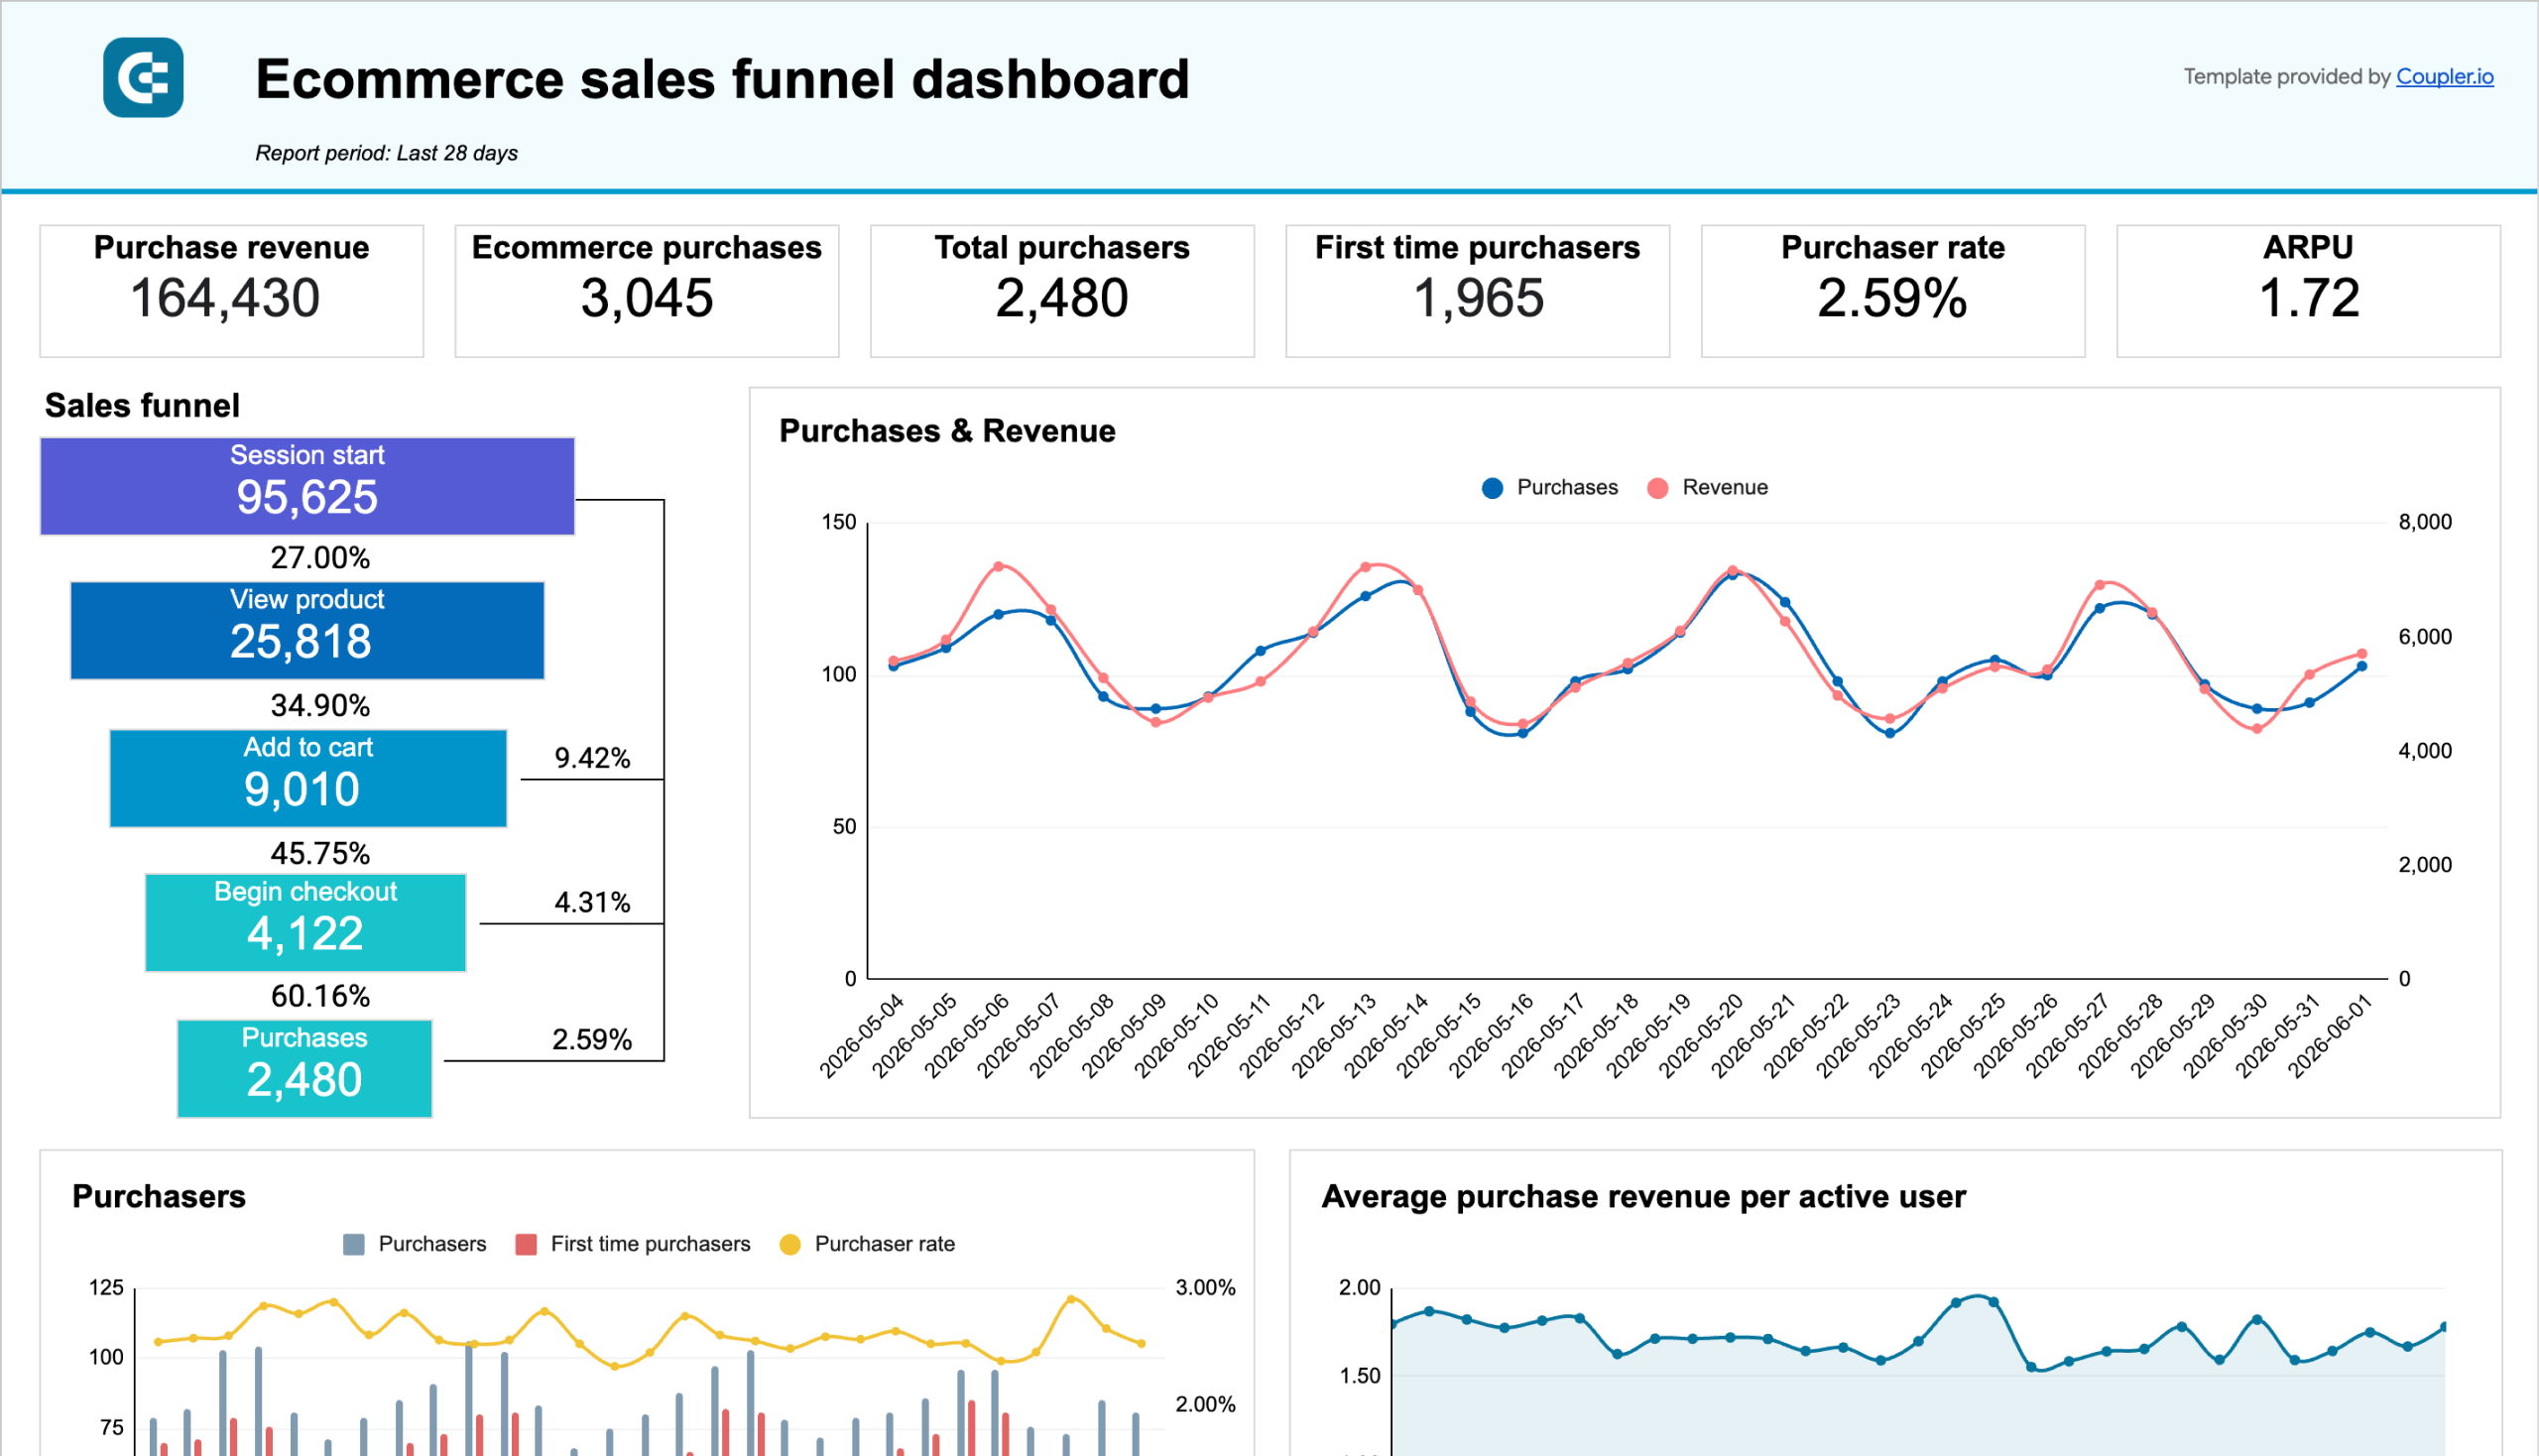
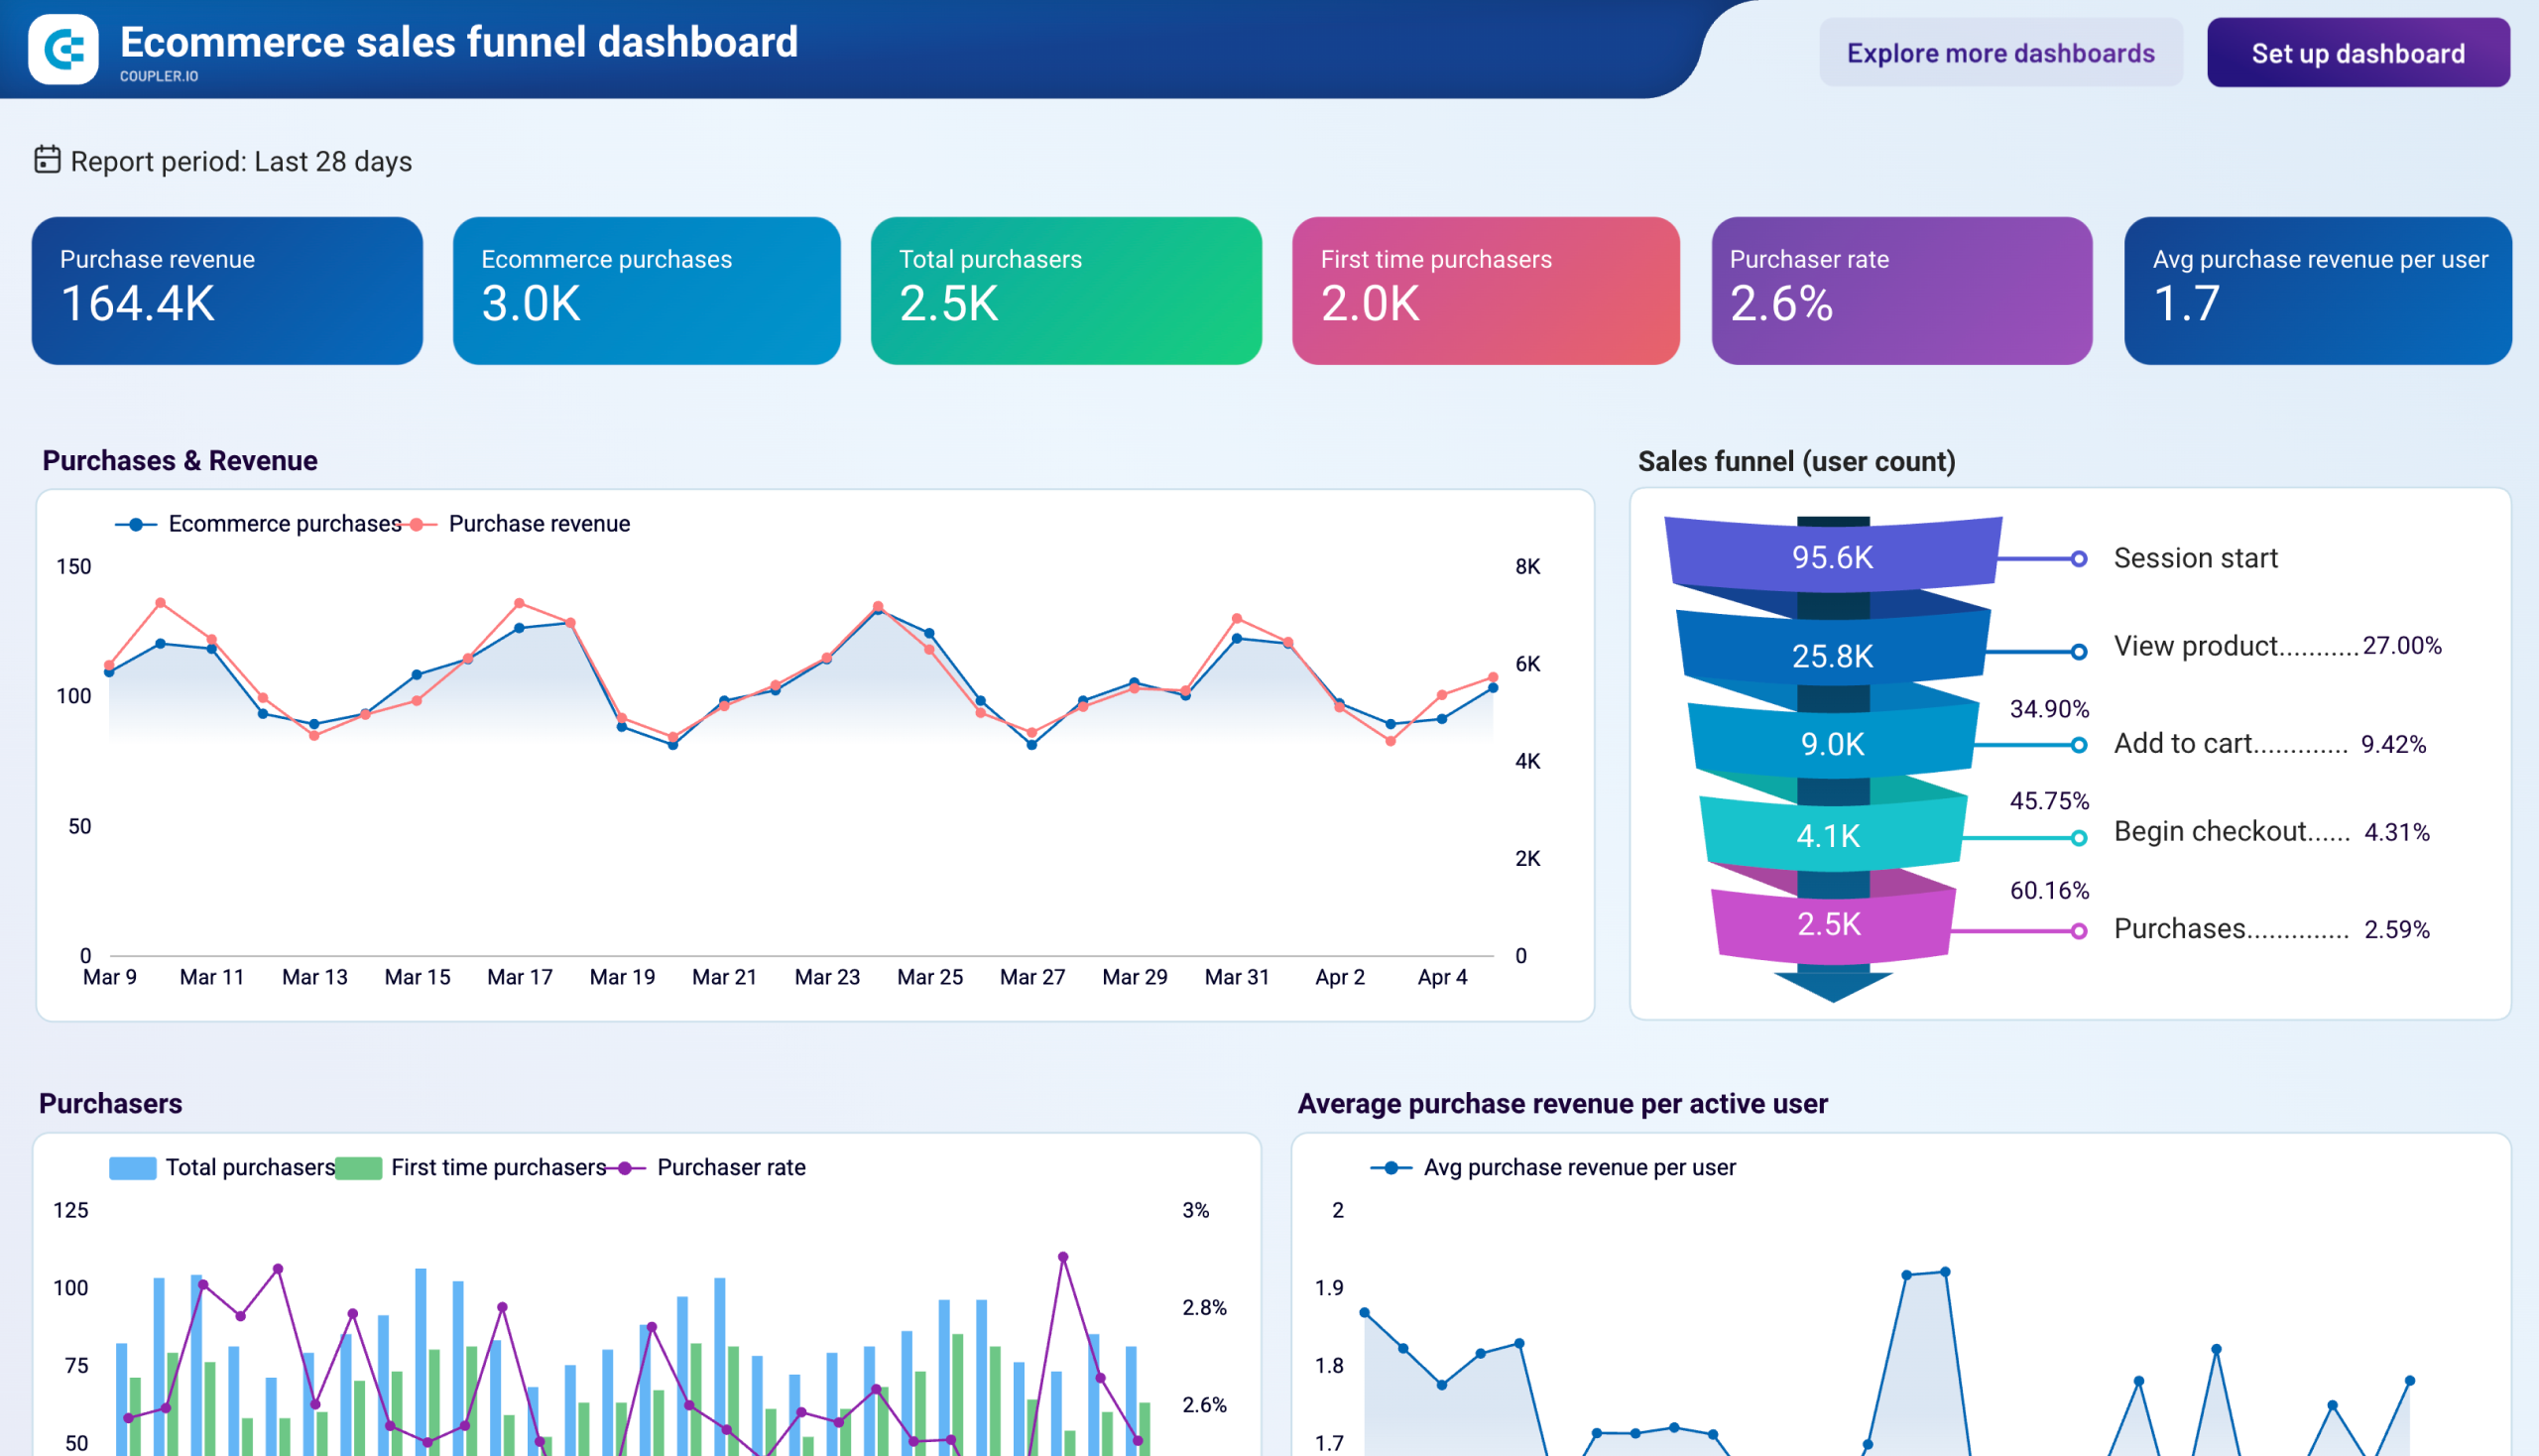
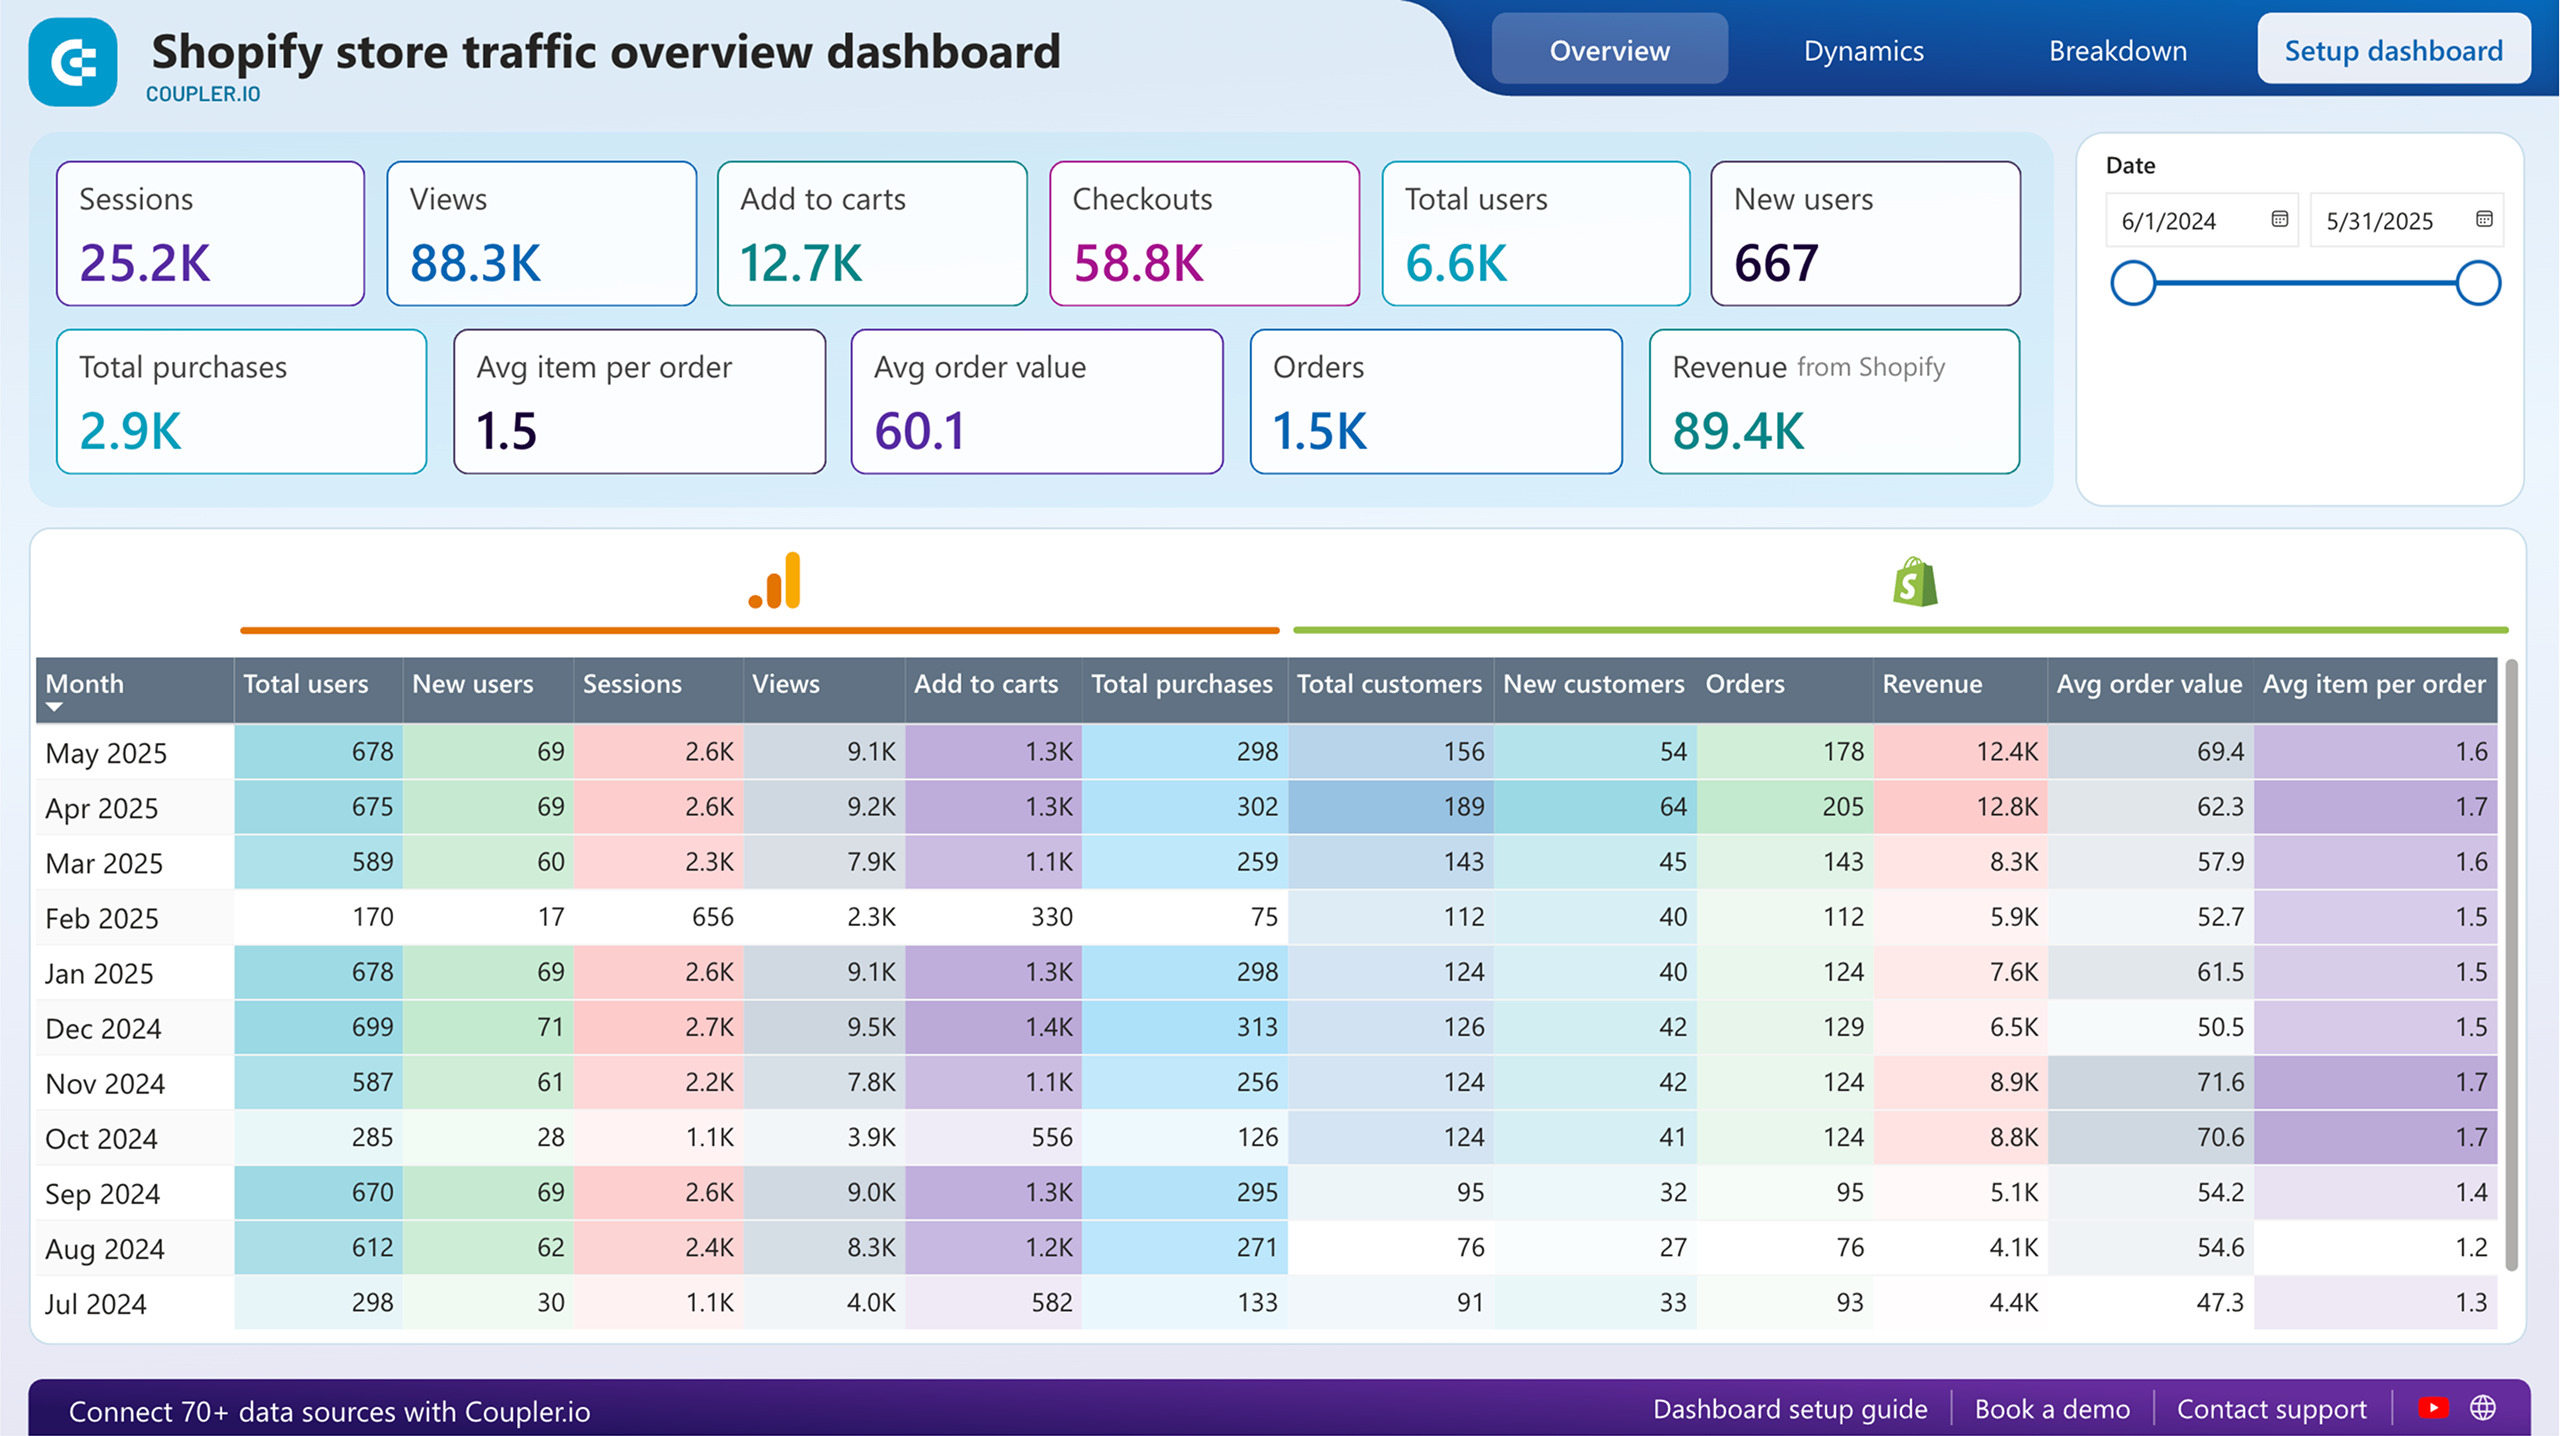
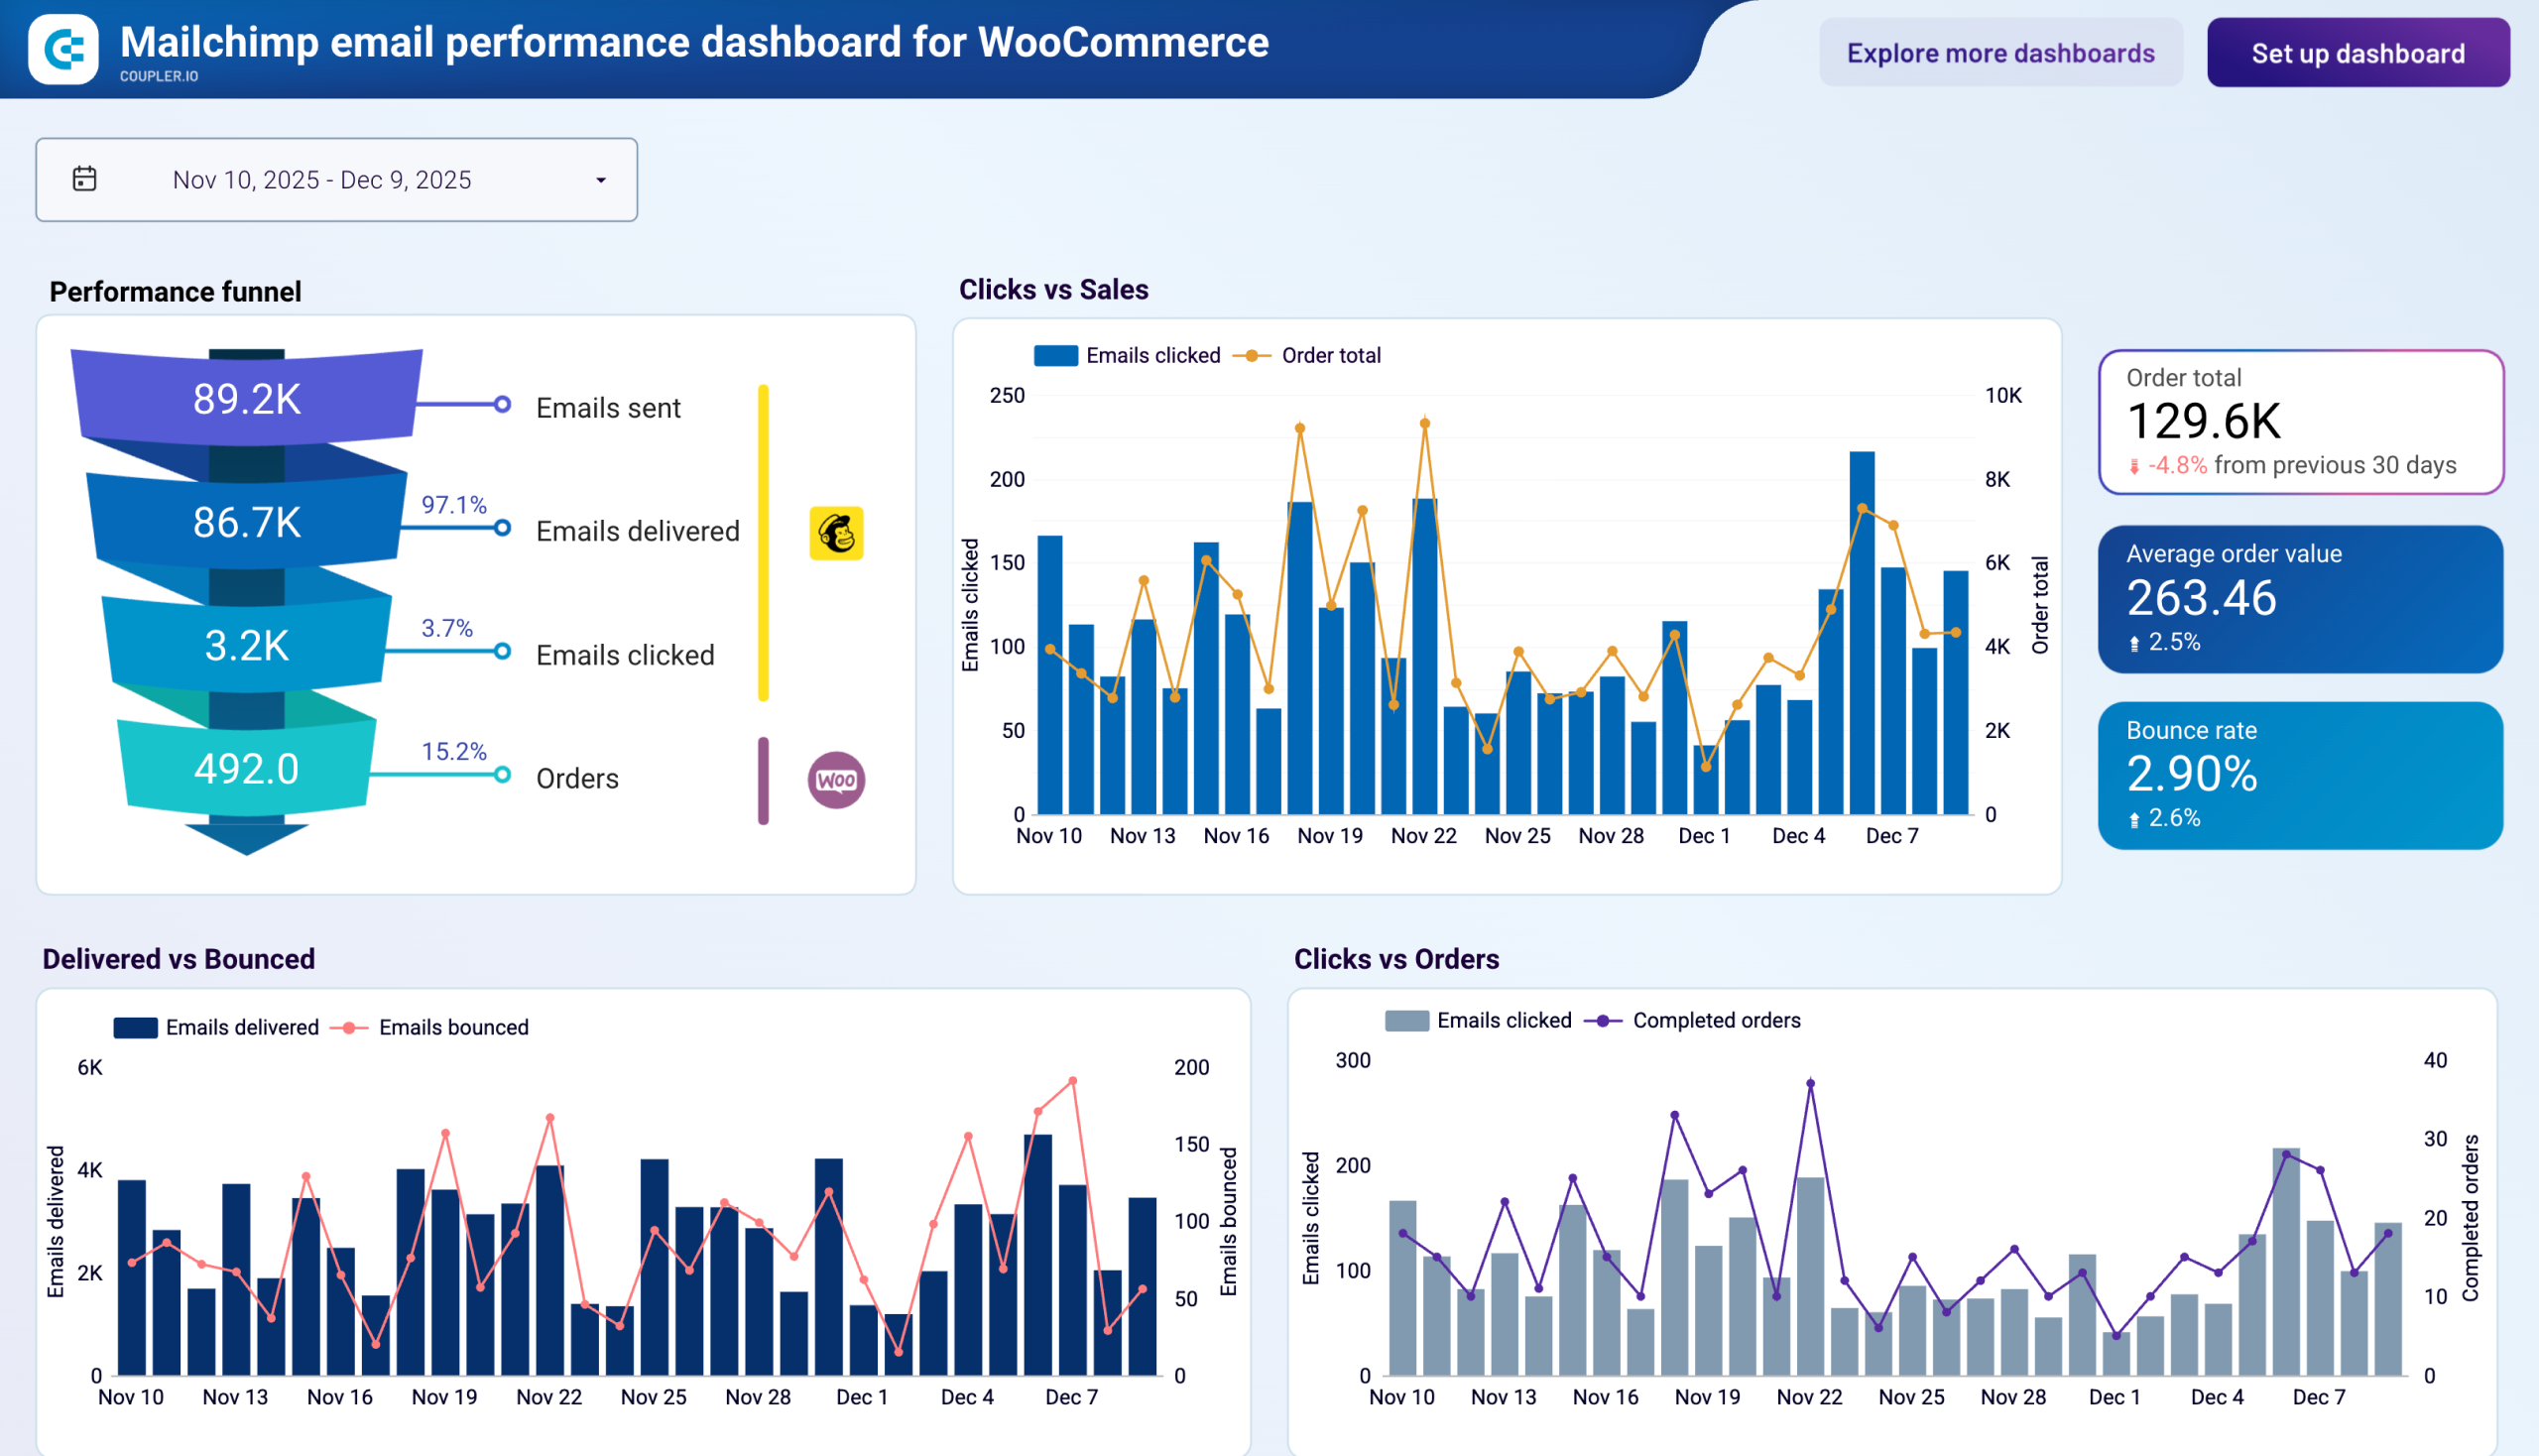
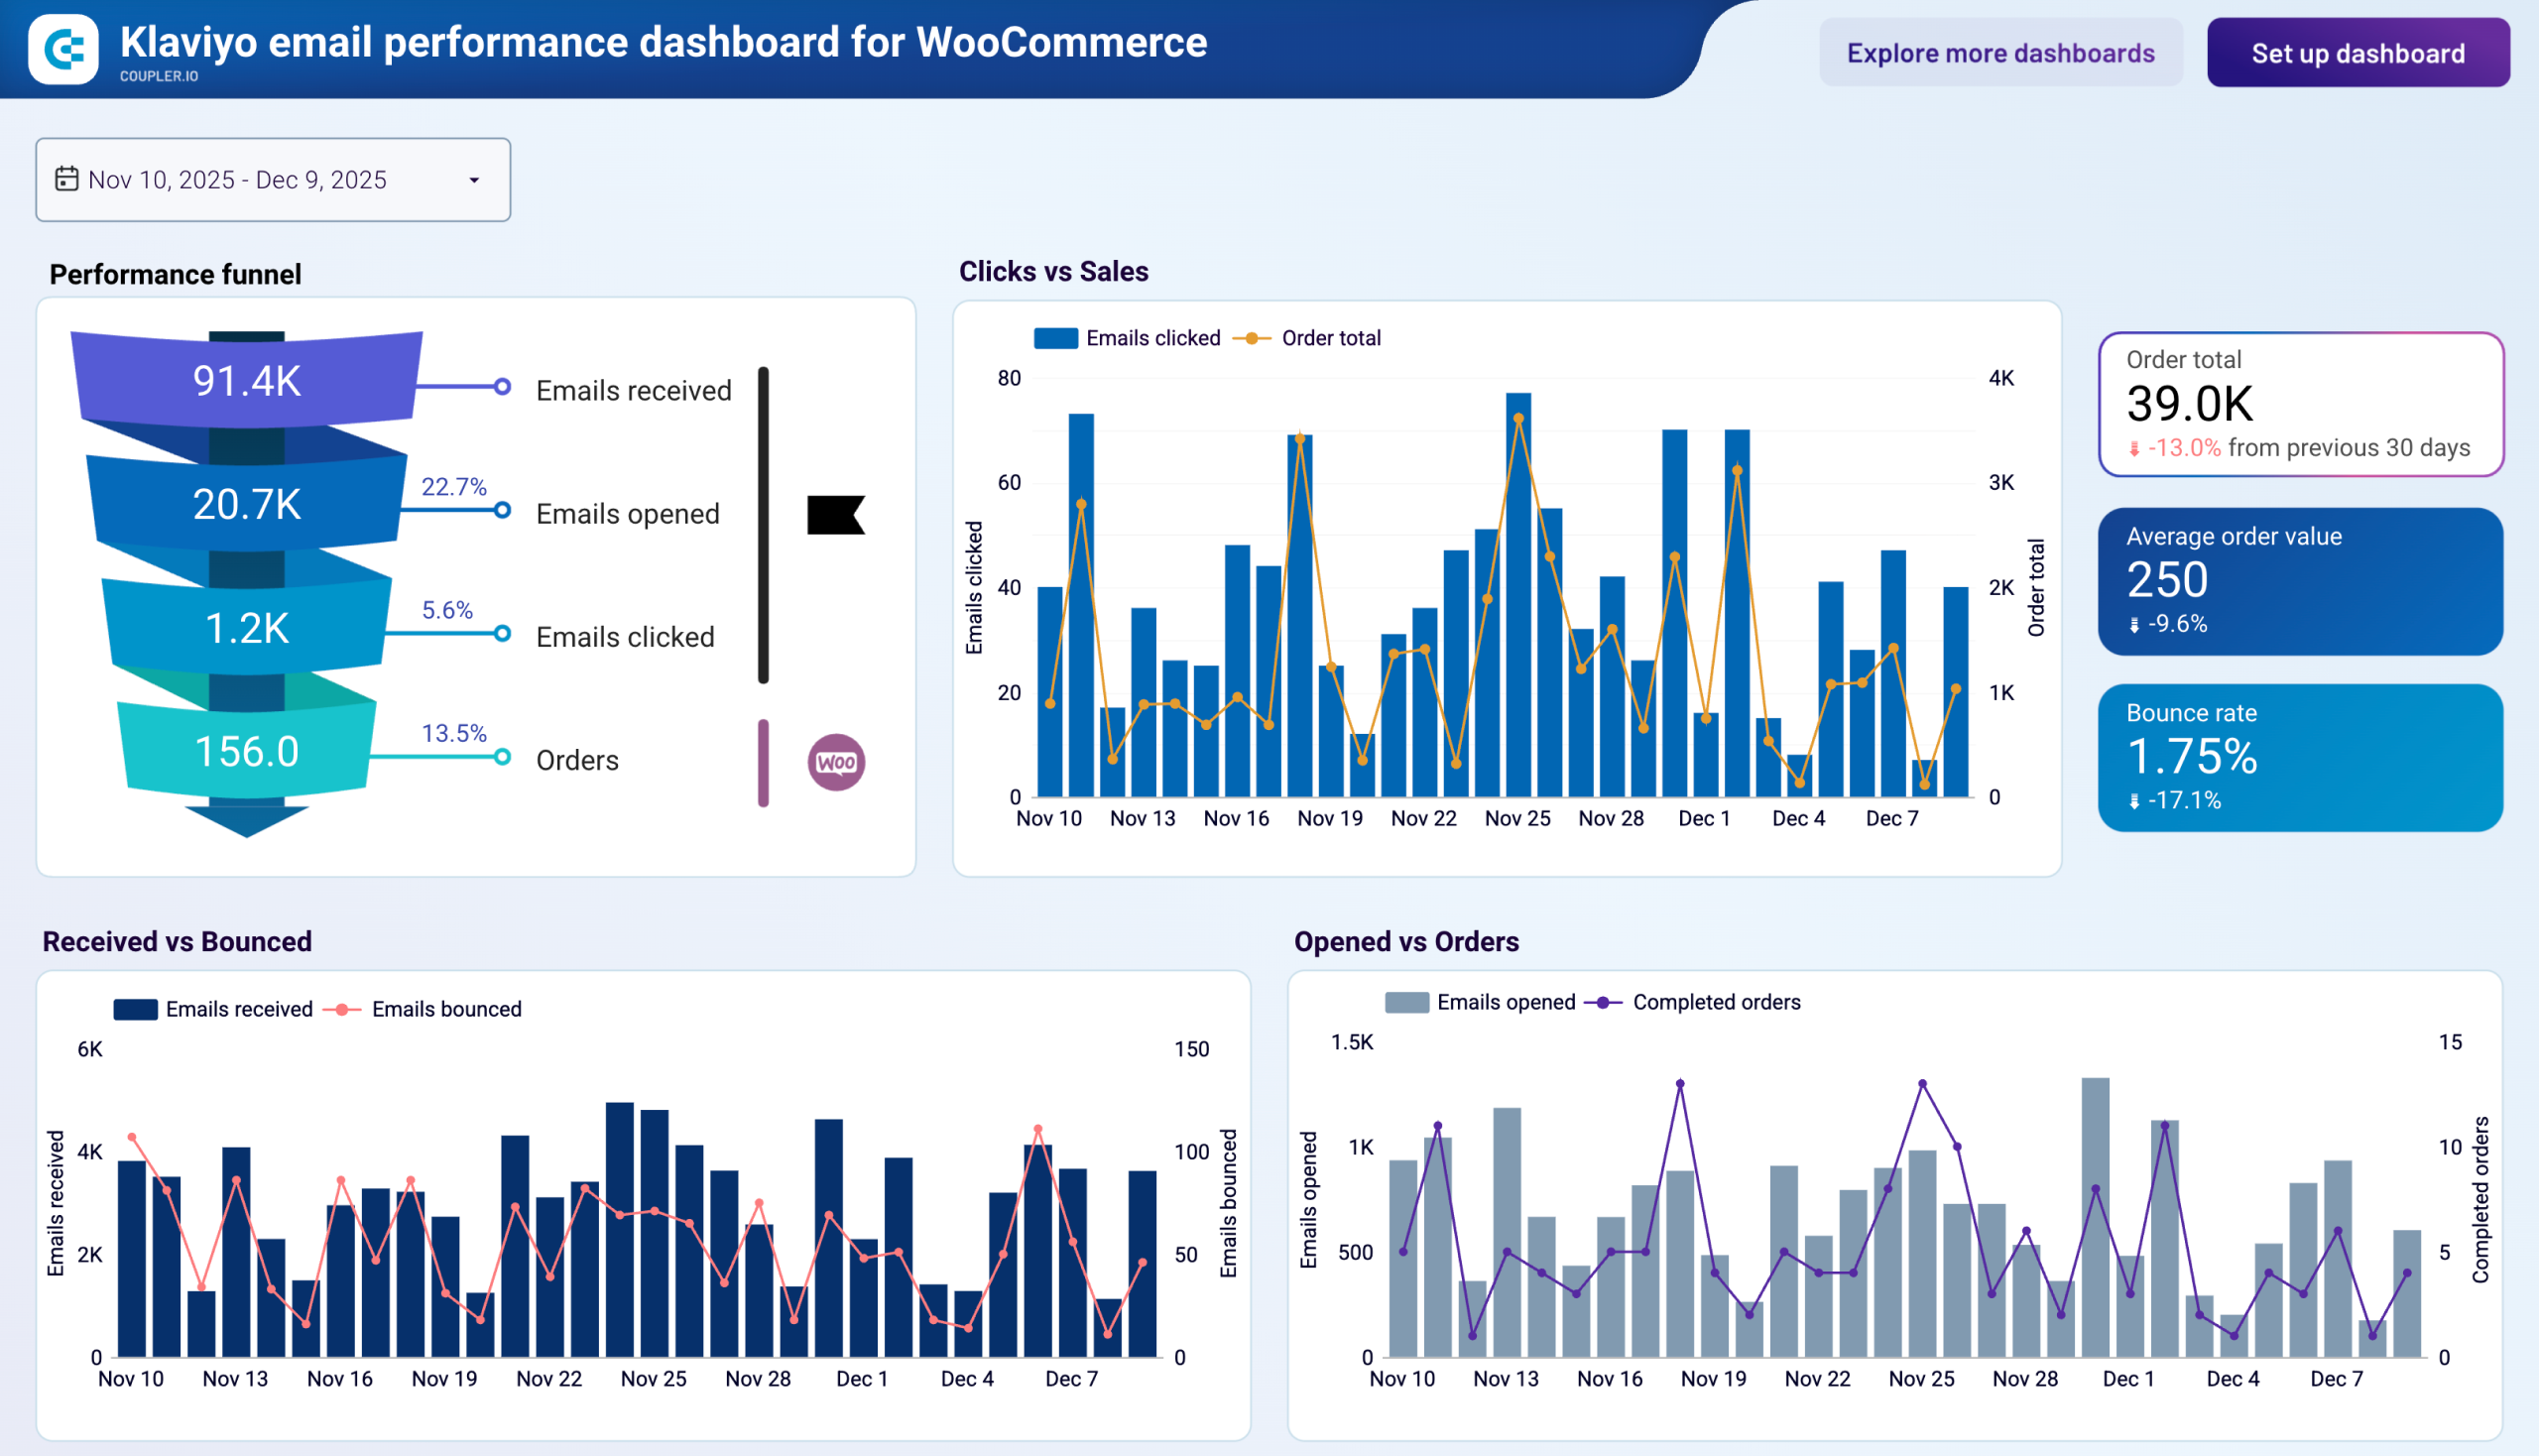
Ecommerce Funnel dashboards
Visualize the complete customer journey from initial ad impression through final purchase completion. These specialized ecommerce dashboards track conversion rates at each funnel stage, helping identify drop-off points and optimize the path to purchase for improved sales performance and reduced acquisition costs.
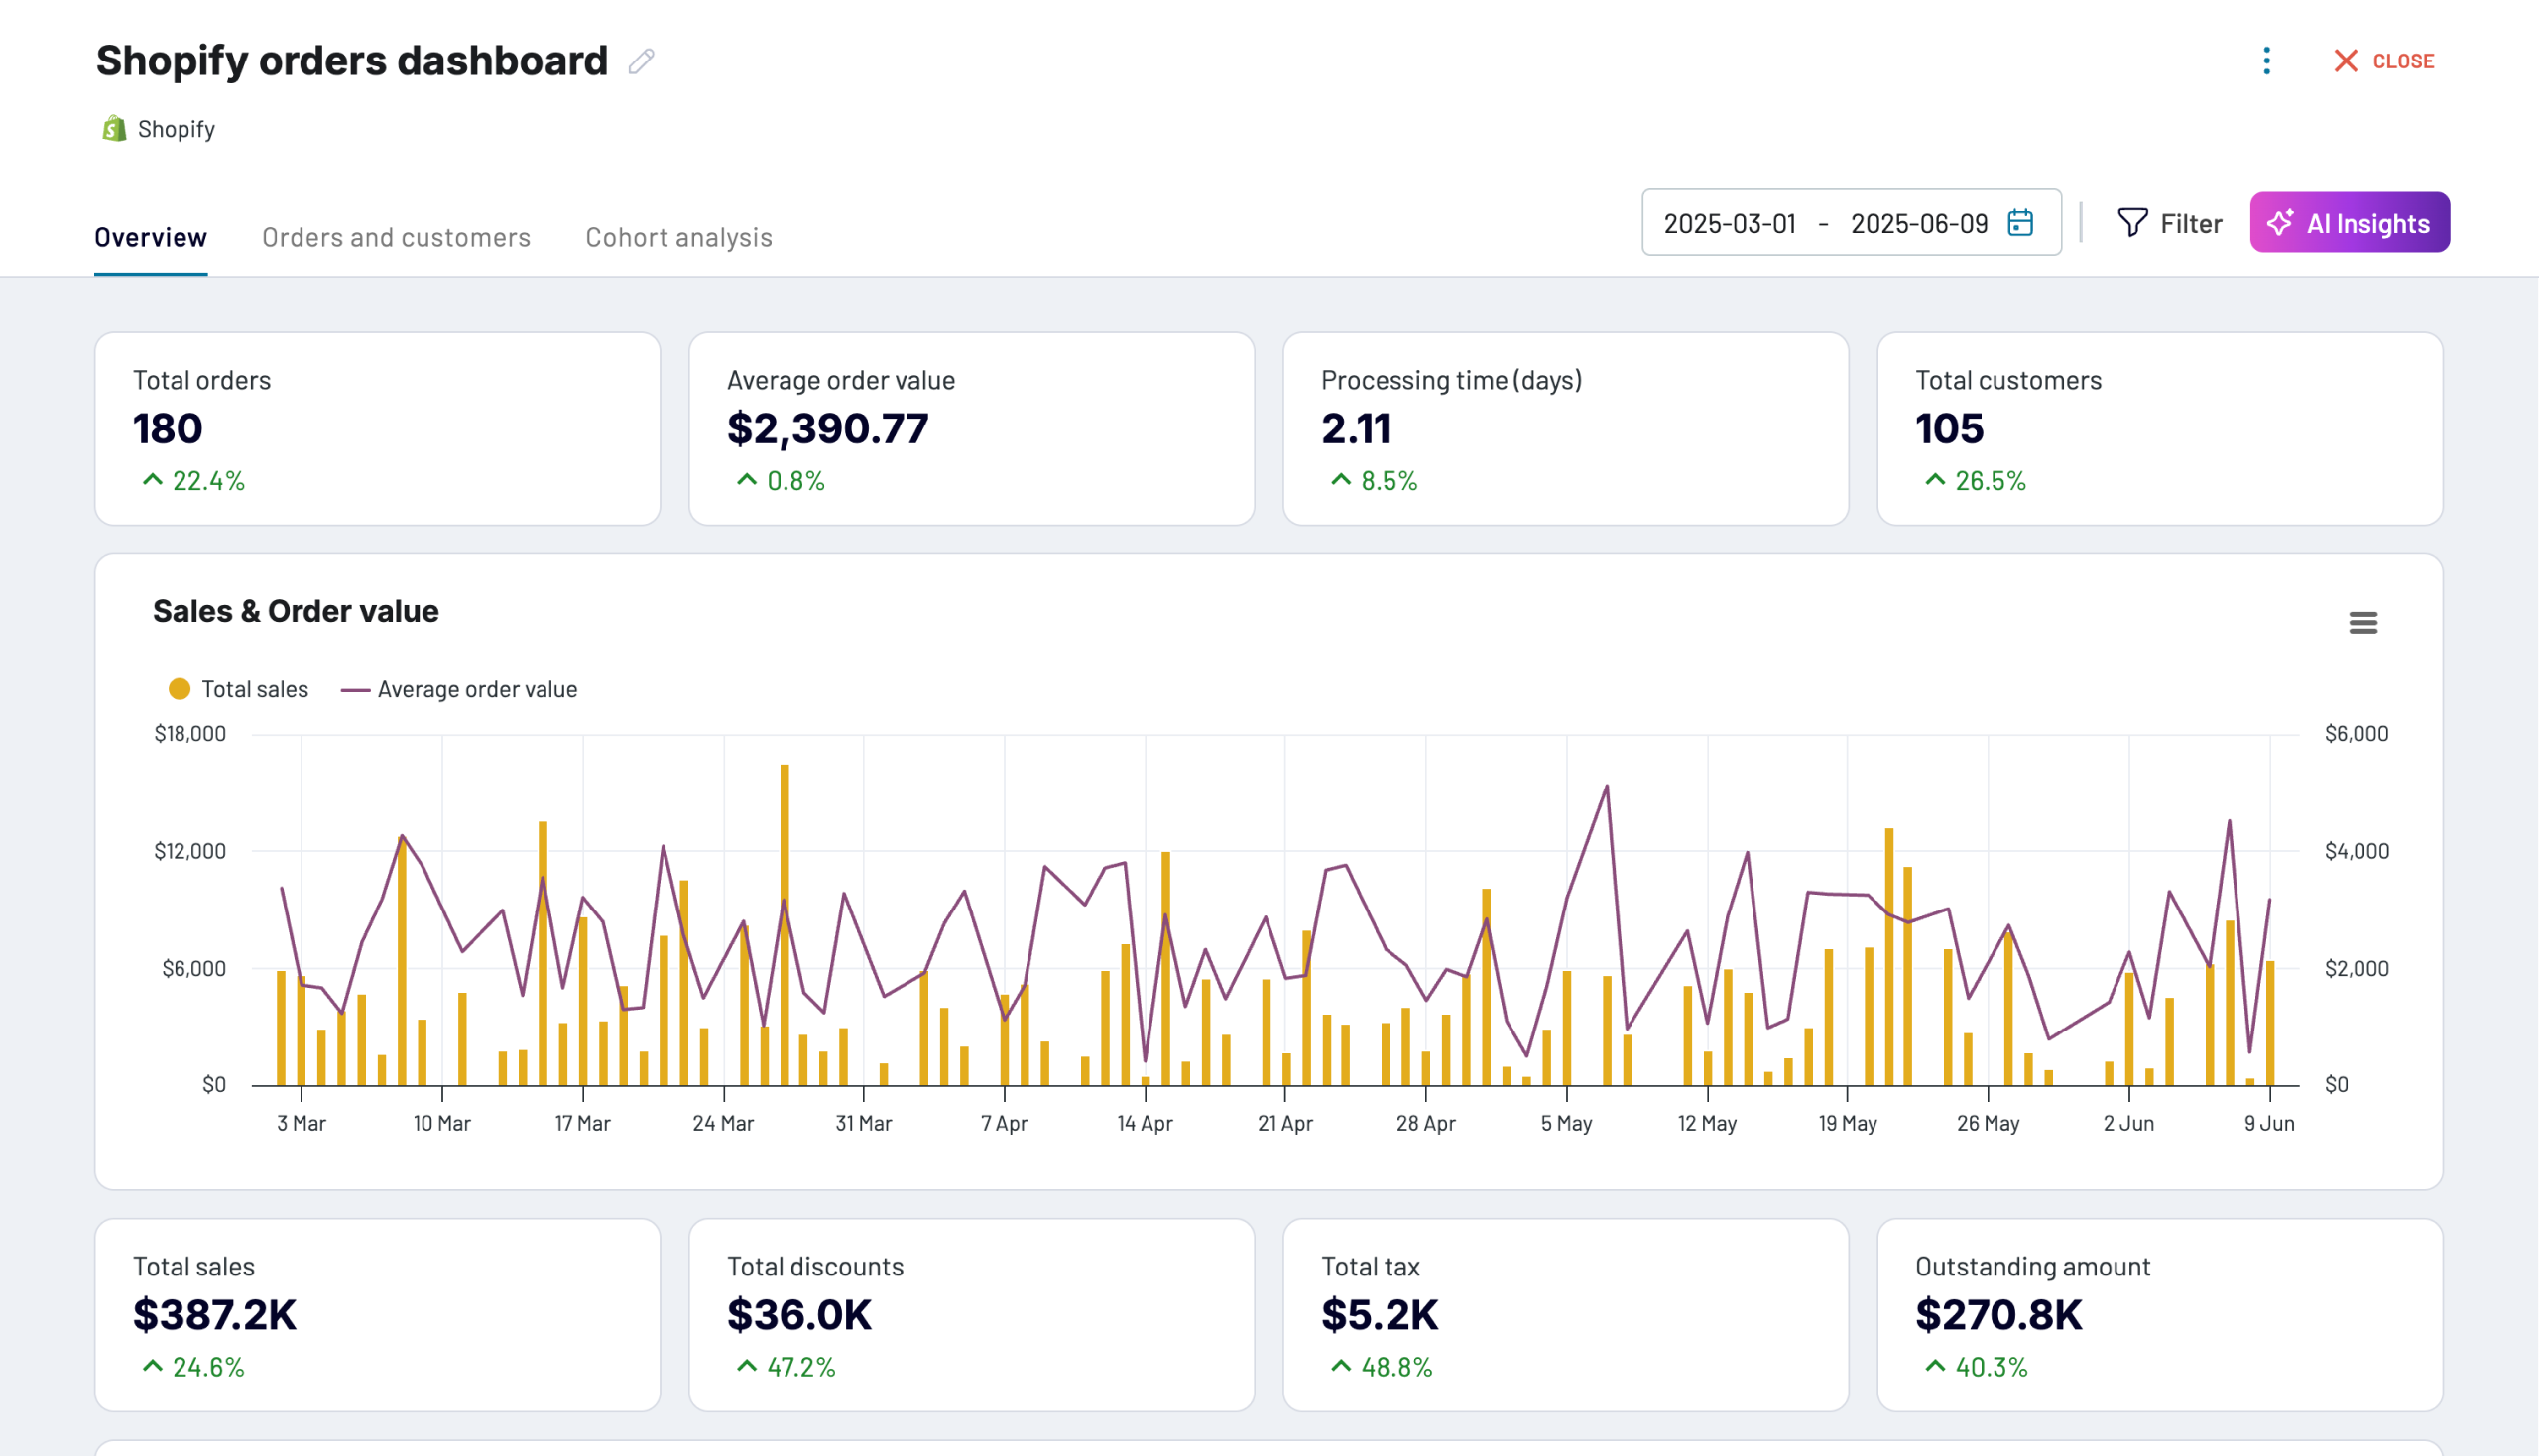
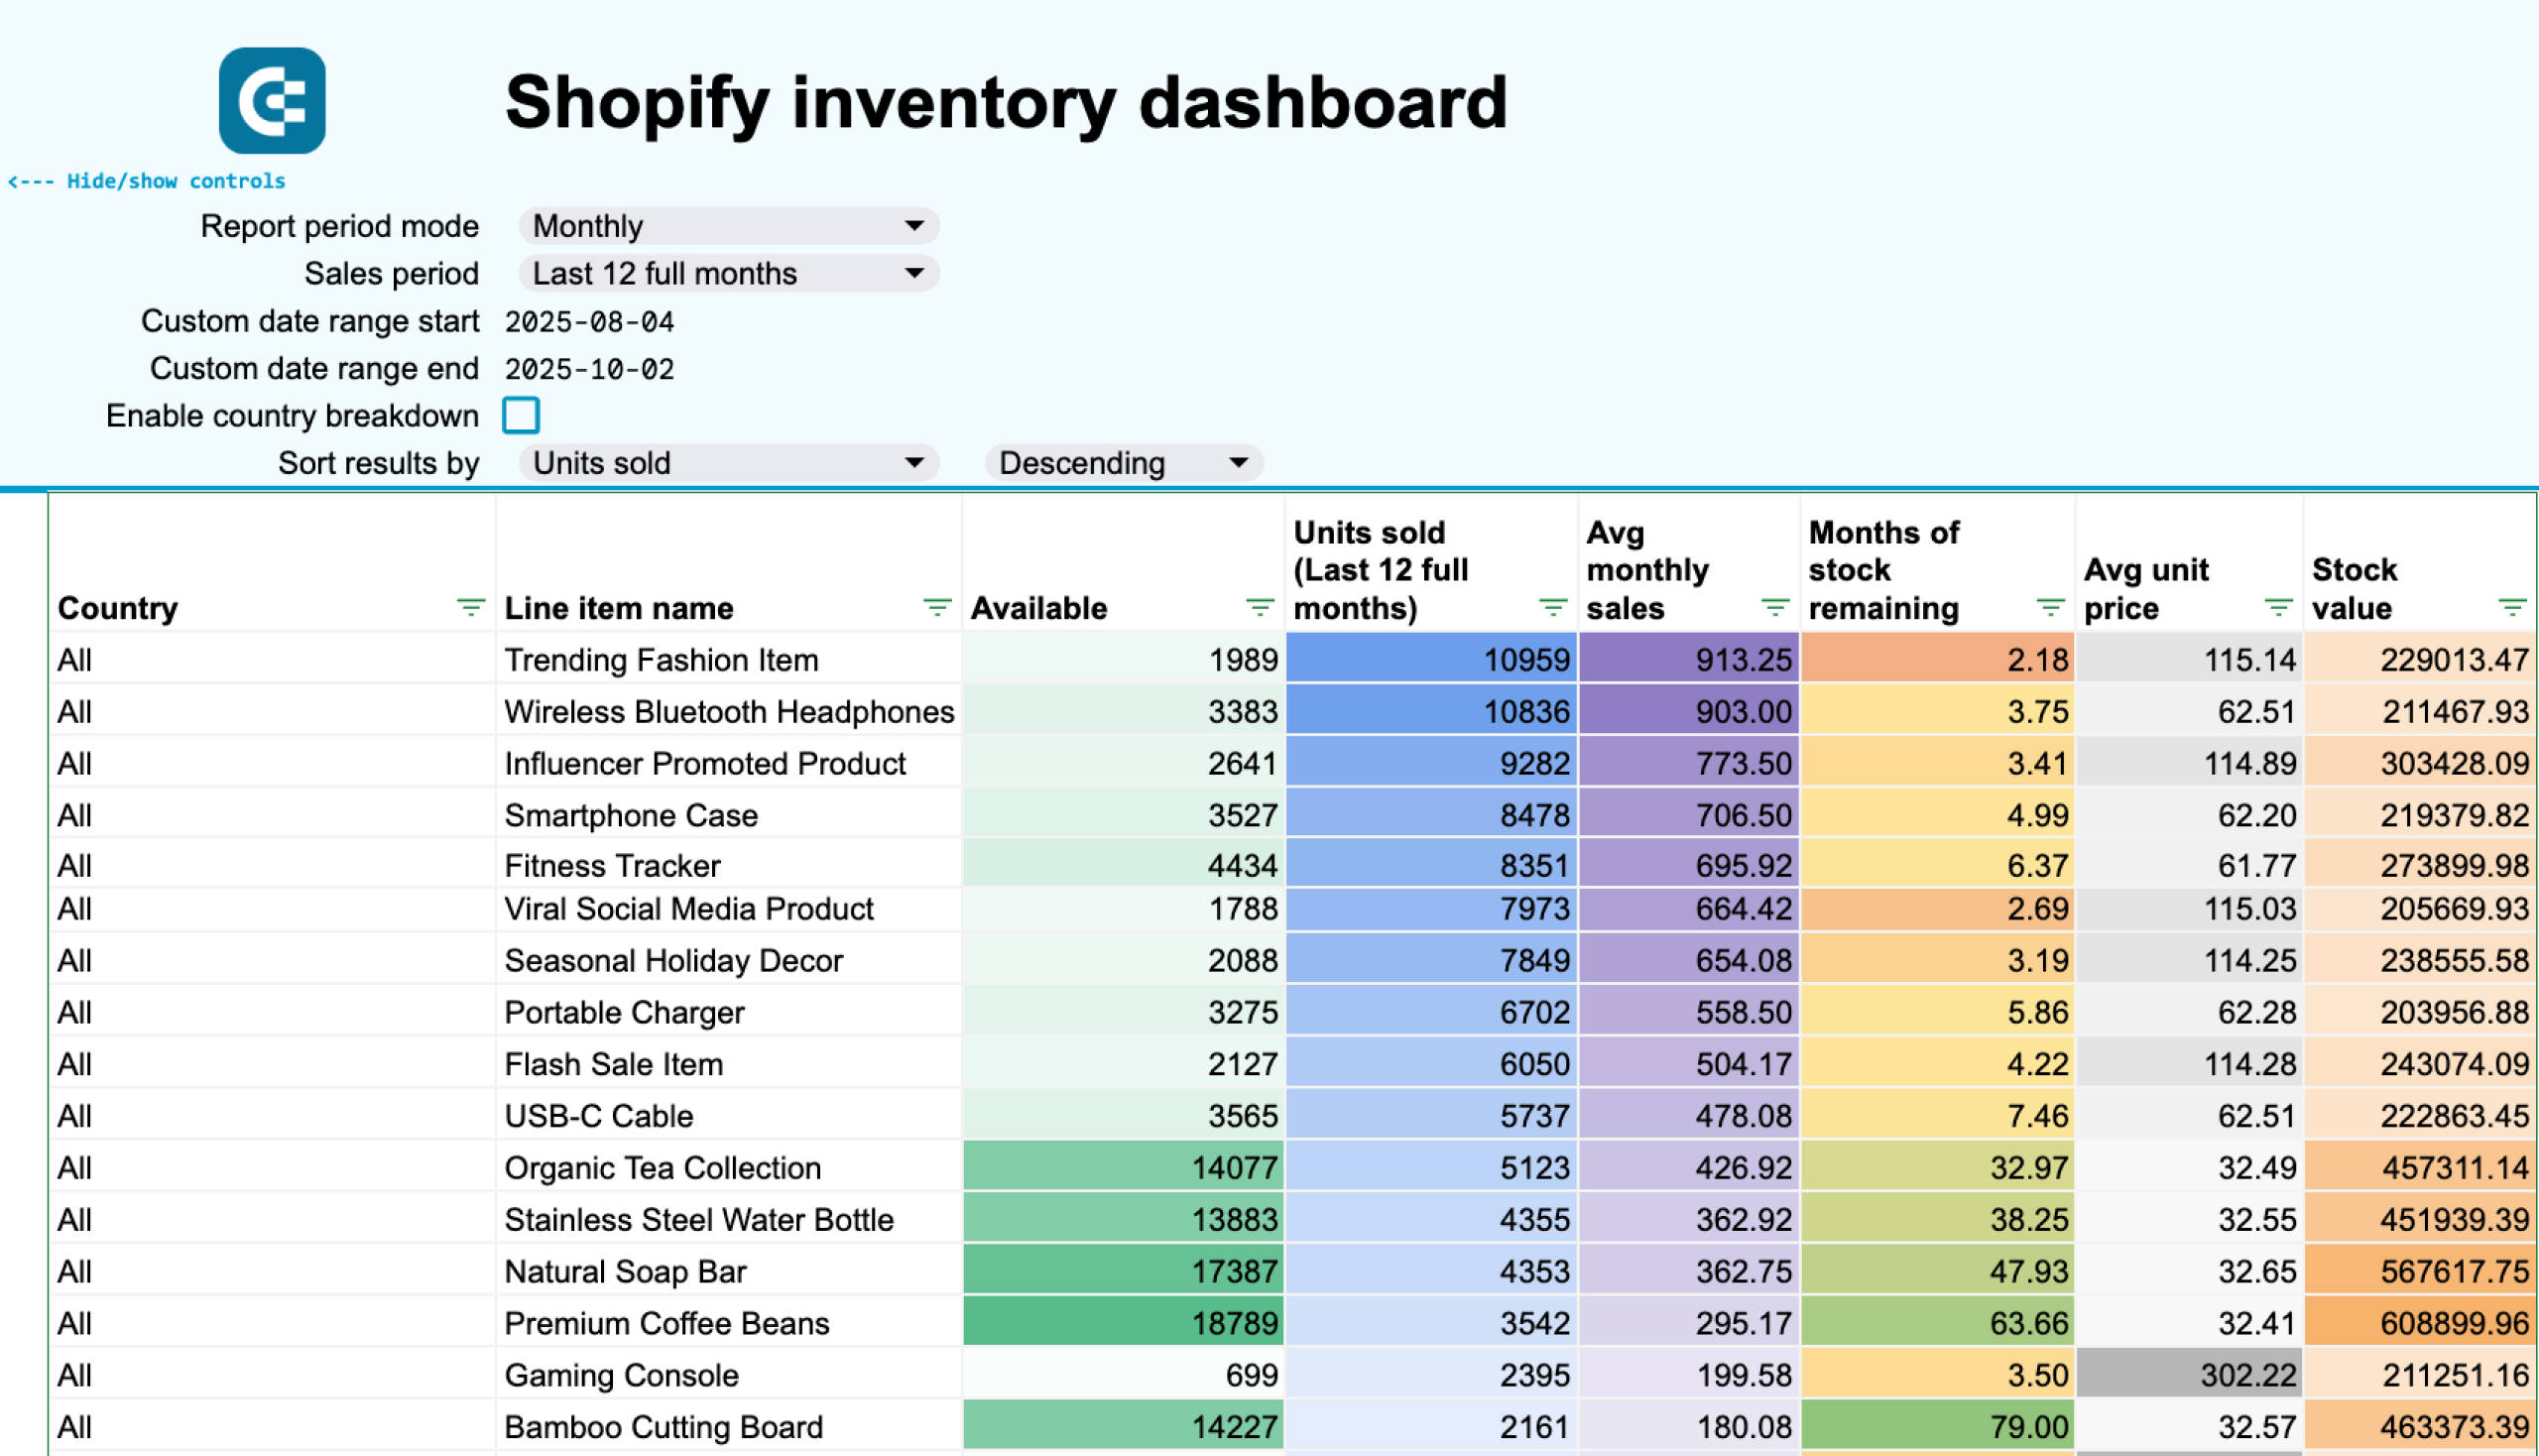
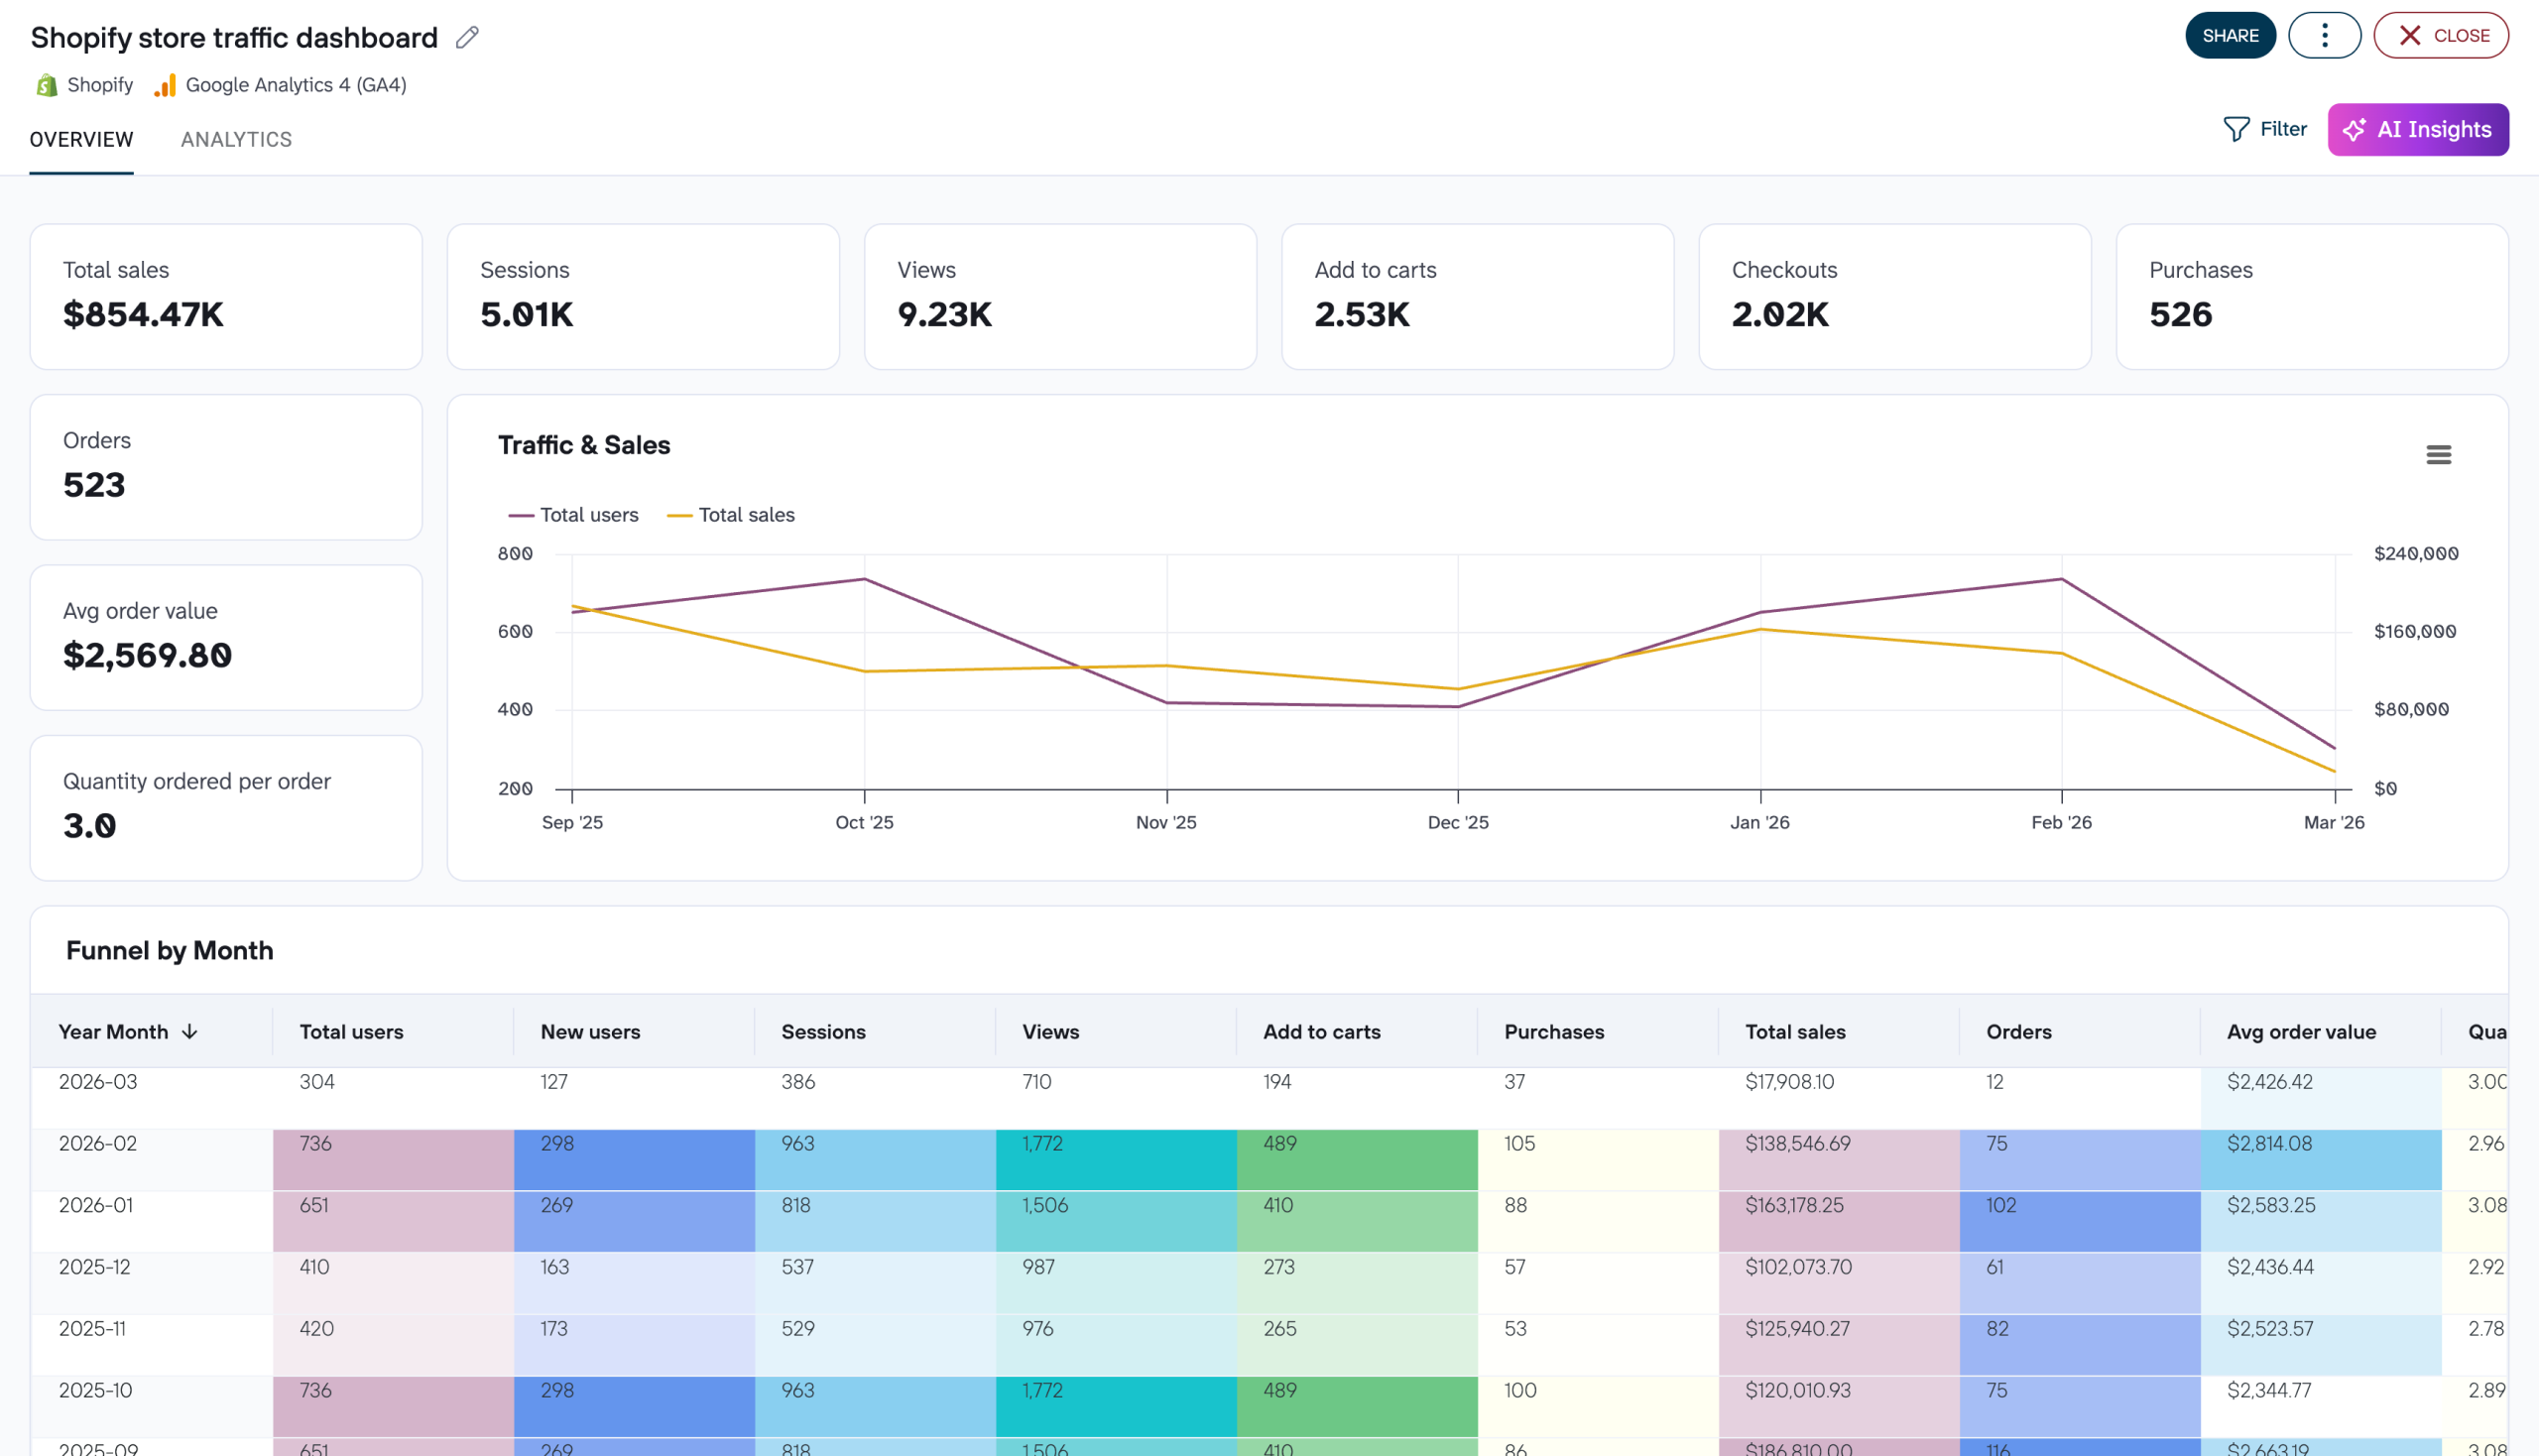
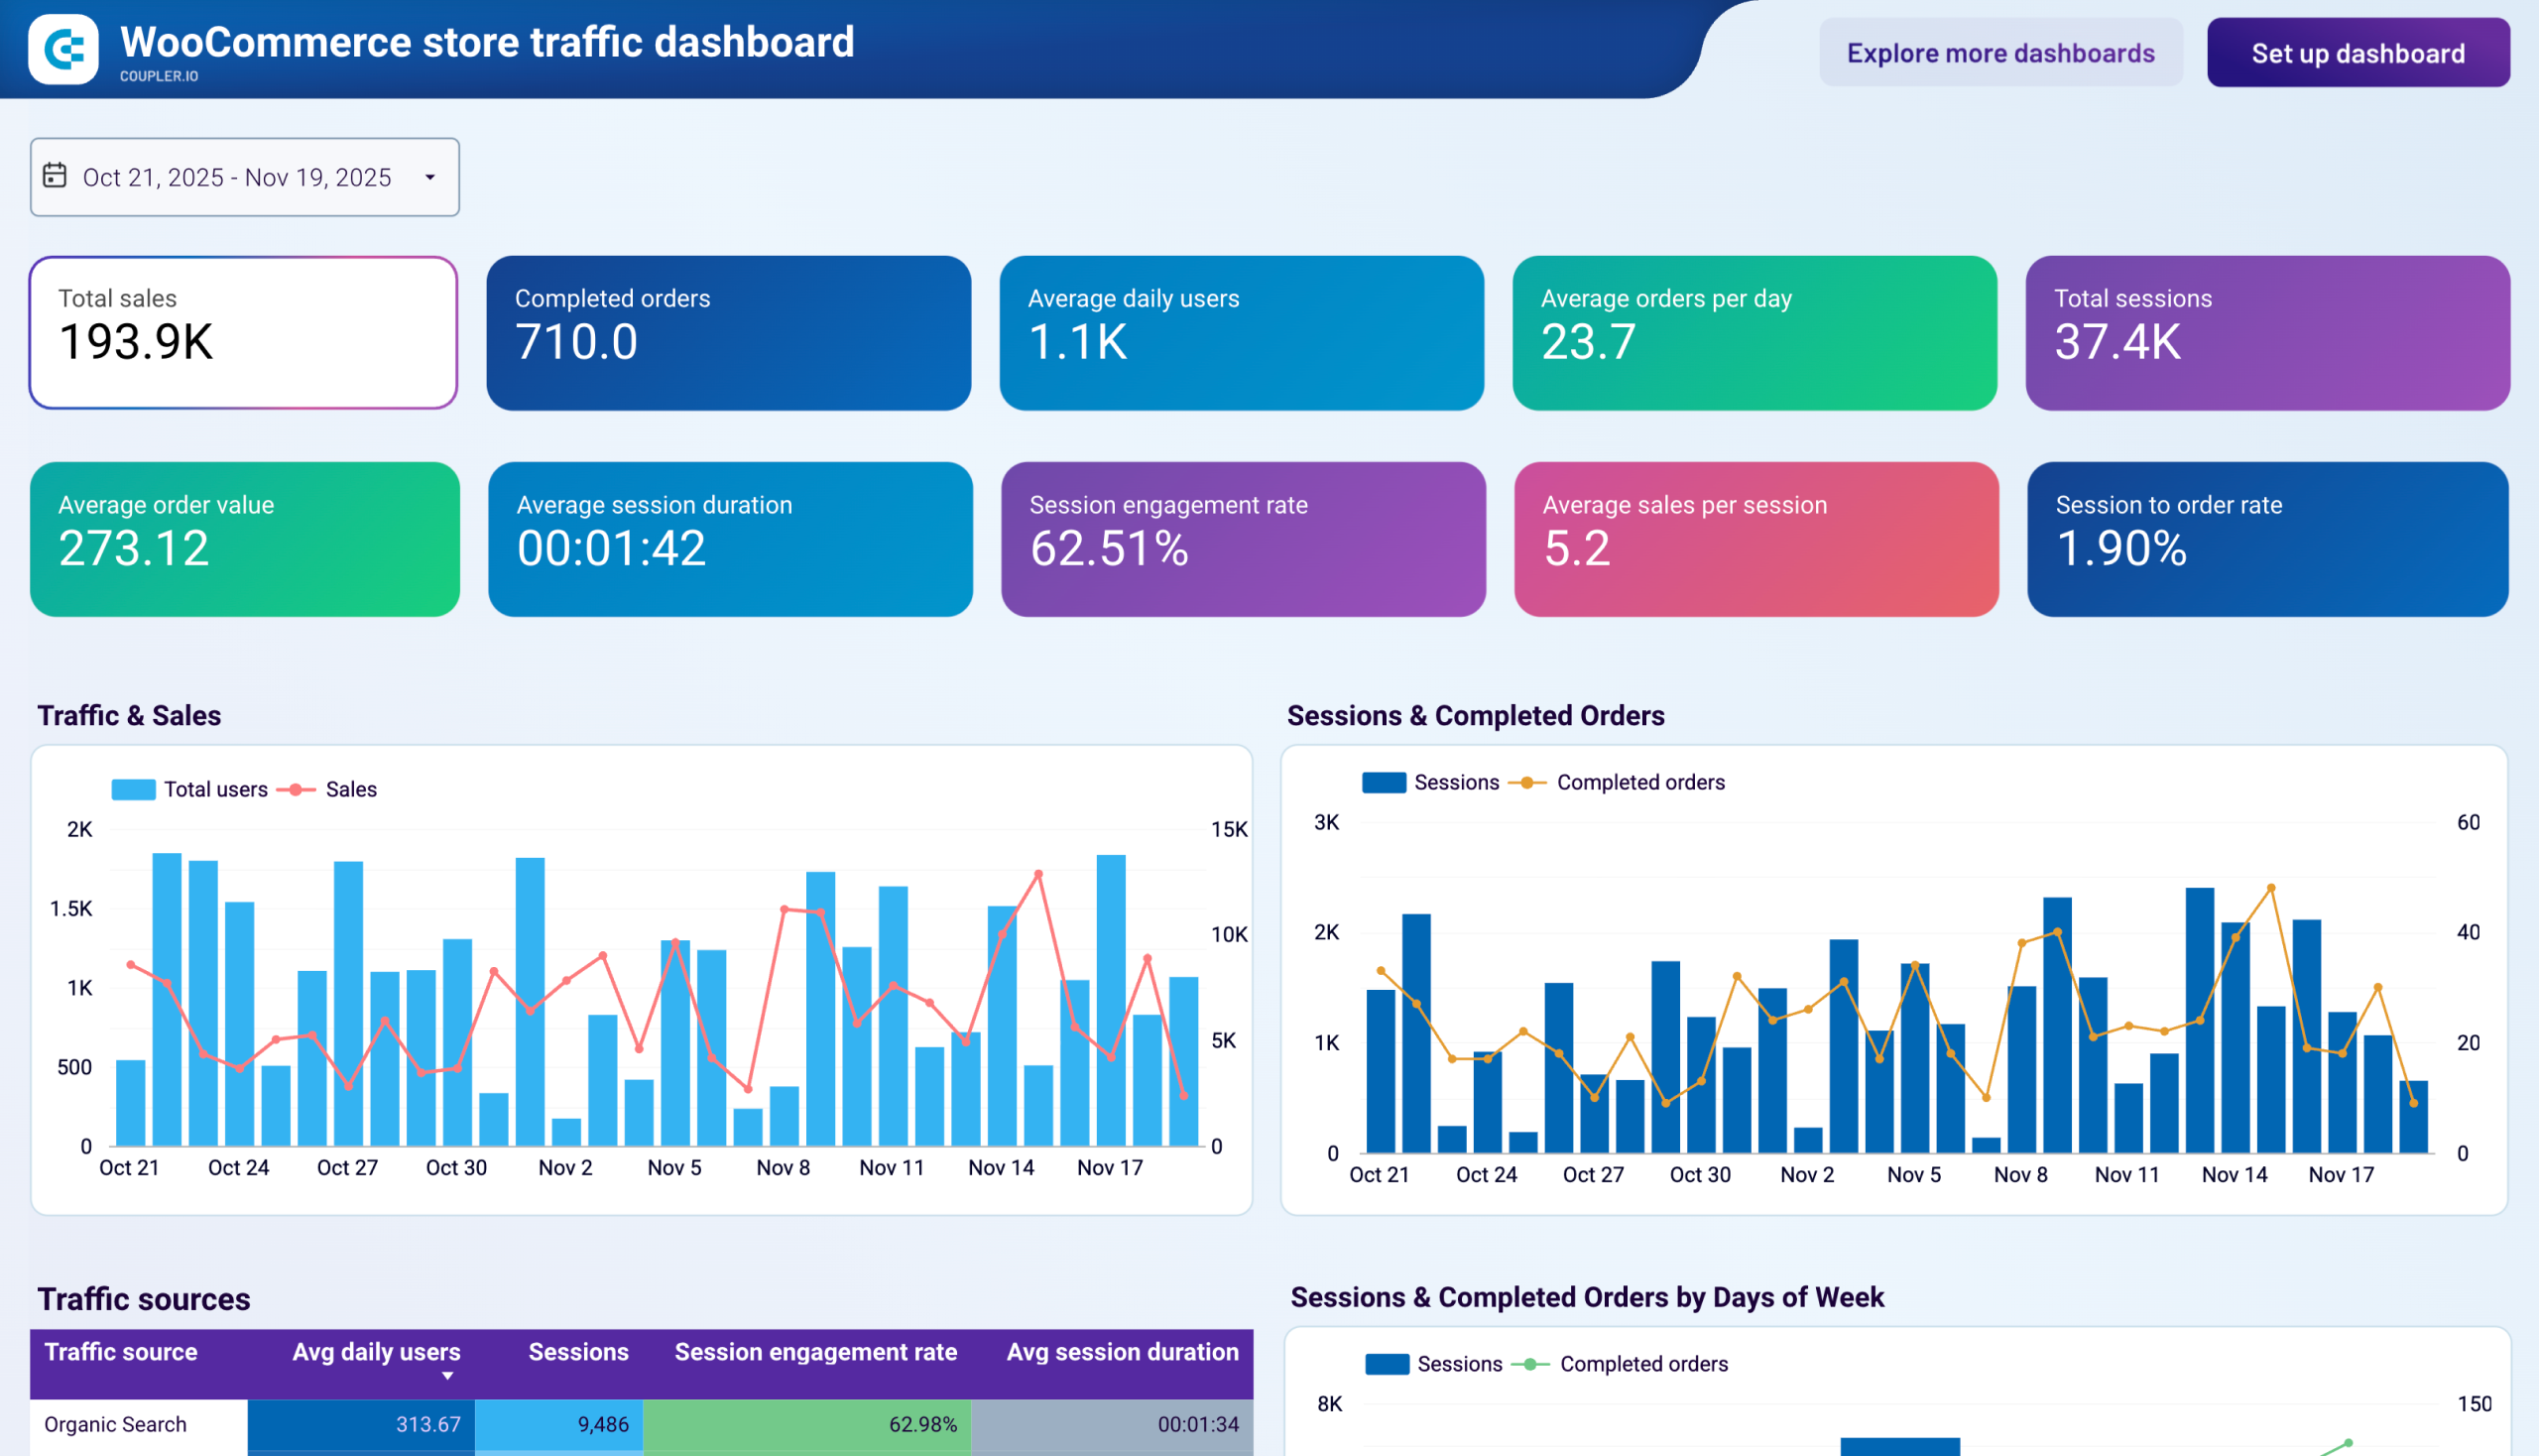
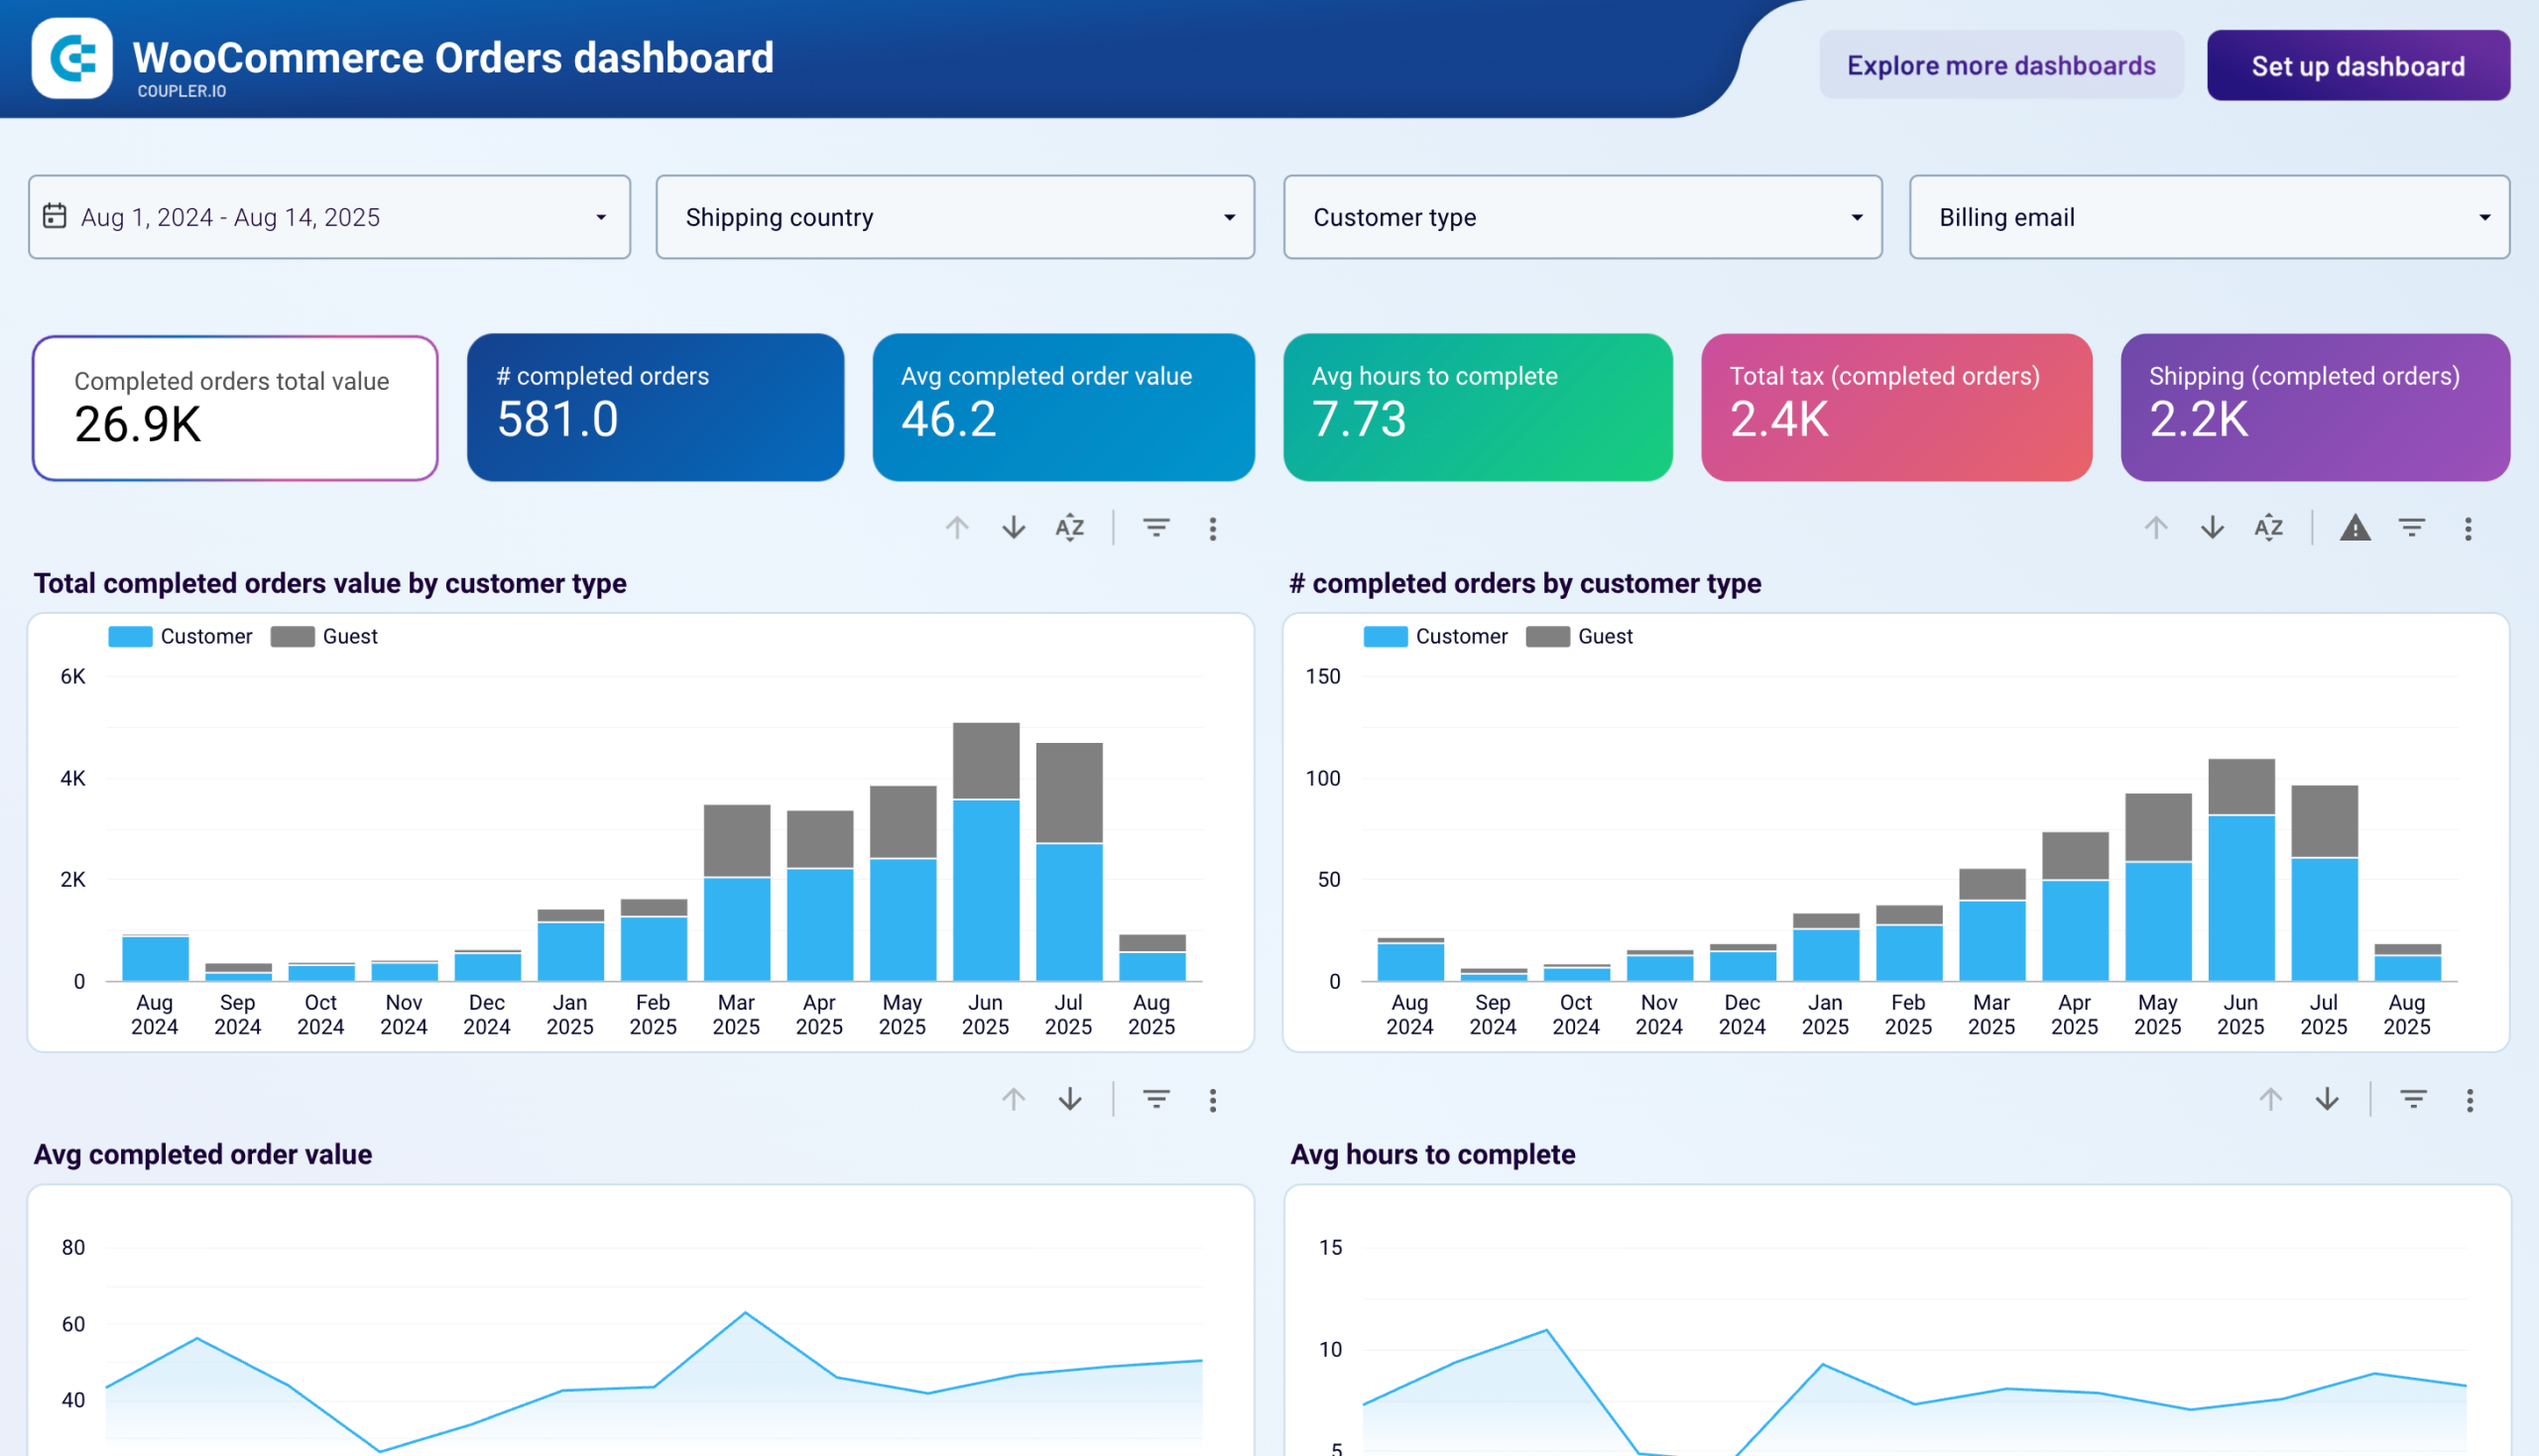
Store Performance dashboards
Analyze operational metrics including inventory turnover, product performance, geographic sales distribution, and fulfillment efficiency. These ecommerce dashboard template solutions focus on day-to-day store operations, enabling better inventory planning, shipping optimization, and regional market analysis for sustainable business growth.
Choose your Ecommerce dashboard template to kick off
What is an ecommerce dashboard?
Ecommerce dashboard templates integrate multiple data sources to provide real-time visibility into sales funnels, revenue trends, product performance, and customer acquisition costs. Through automated data refreshing via Coupler.io, these dashboards eliminate manual reporting while ensuring you always work with current information. They combine transactional data with marketing analytics to reveal which products drive profits, which channels convert best, and where operational improvements can boost overall performance.

What should an ecommerce reporting dashboard include?
Effective ecommerce reporting dashboards should encompass comprehensive sales performance tracking, inventory management insights, and customer behavior analysis. Revenue reporting forms the foundation, displaying sales trends across multiple timeframes, product performance breakdowns, and geographic revenue distribution to identify market opportunities. Customer acquisition analytics track the complete buyer journey from initial touchpoint through purchase completion, revealing which marketing channels deliver the highest-value customers and optimal conversion rates.
Another vital component is channel analytics. You should see how each marketing channel is performing, including website traffic patterns, social media engagement levels, email campaign results, paid advertising performance, and more. Having all these insights in one place enables you to optimize your channel activities and budget allocation.
Inventory intelligence provides crucial operational visibility through stock level monitoring, days-of-supply calculations, and return rate analysis by product and geography. This prevents stockouts while identifying slow-moving inventory that impacts cash flow. Marketing funnel analysis connects advertising spend with actual sales outcomes, showing how impressions translate to clicks, visitors convert to customers, and which campaigns generate profitable returns. Financial performance tracking includes profit margins, average order values, customer lifetime value, and seasonal trend analysis to support strategic planning and budget allocation decisions for sustainable growth.
How to create ecommerce dashboards from templates?
