Ecommerce analytics & KPI dashboard examples and reporting templates
Transform your online store data into actionable insights with an automated ecommerce analytics dashboard template that consolidates information from Shopify, Klaviyo, Mailchimp, Google Business Profile, and other sources. Track sales performance, monitor marketing attribution across channels, analyze customer behavior, and optimize product strategies based on real-time data from your ecommerce platforms.
Ecommerce analytics & KPI dashboard examples for every need


about your case. It doesn't cost you a penny 😉
What is an ecommerce analytics dashboard?
Unlike static reports, a modern ecommerce KPI dashboard delivers real-time insights that enable quick decision-making for inventory management, marketing optimization, and revenue growth. Through automated data integration via Coupler.io, these dashboards eliminate manual reporting tasks while ensuring accuracy and timeliness of your business metrics.

Choose your white label ecommerce analytics & KPI dashboard templates to kick off
What reports should be included in ecommerce analytics & KPI dashboards?
A comprehensive ecommerce analytics dashboard requires multiple interconnected reports that provide complete visibility into your online store's performance across all critical business areas. Based on our analysis of successful Shopify, email marketing, and local business dashboards, we recommend incorporating these four essential report types that work together to deliver actionable insights for revenue optimization, customer understanding, and strategic decision-making.
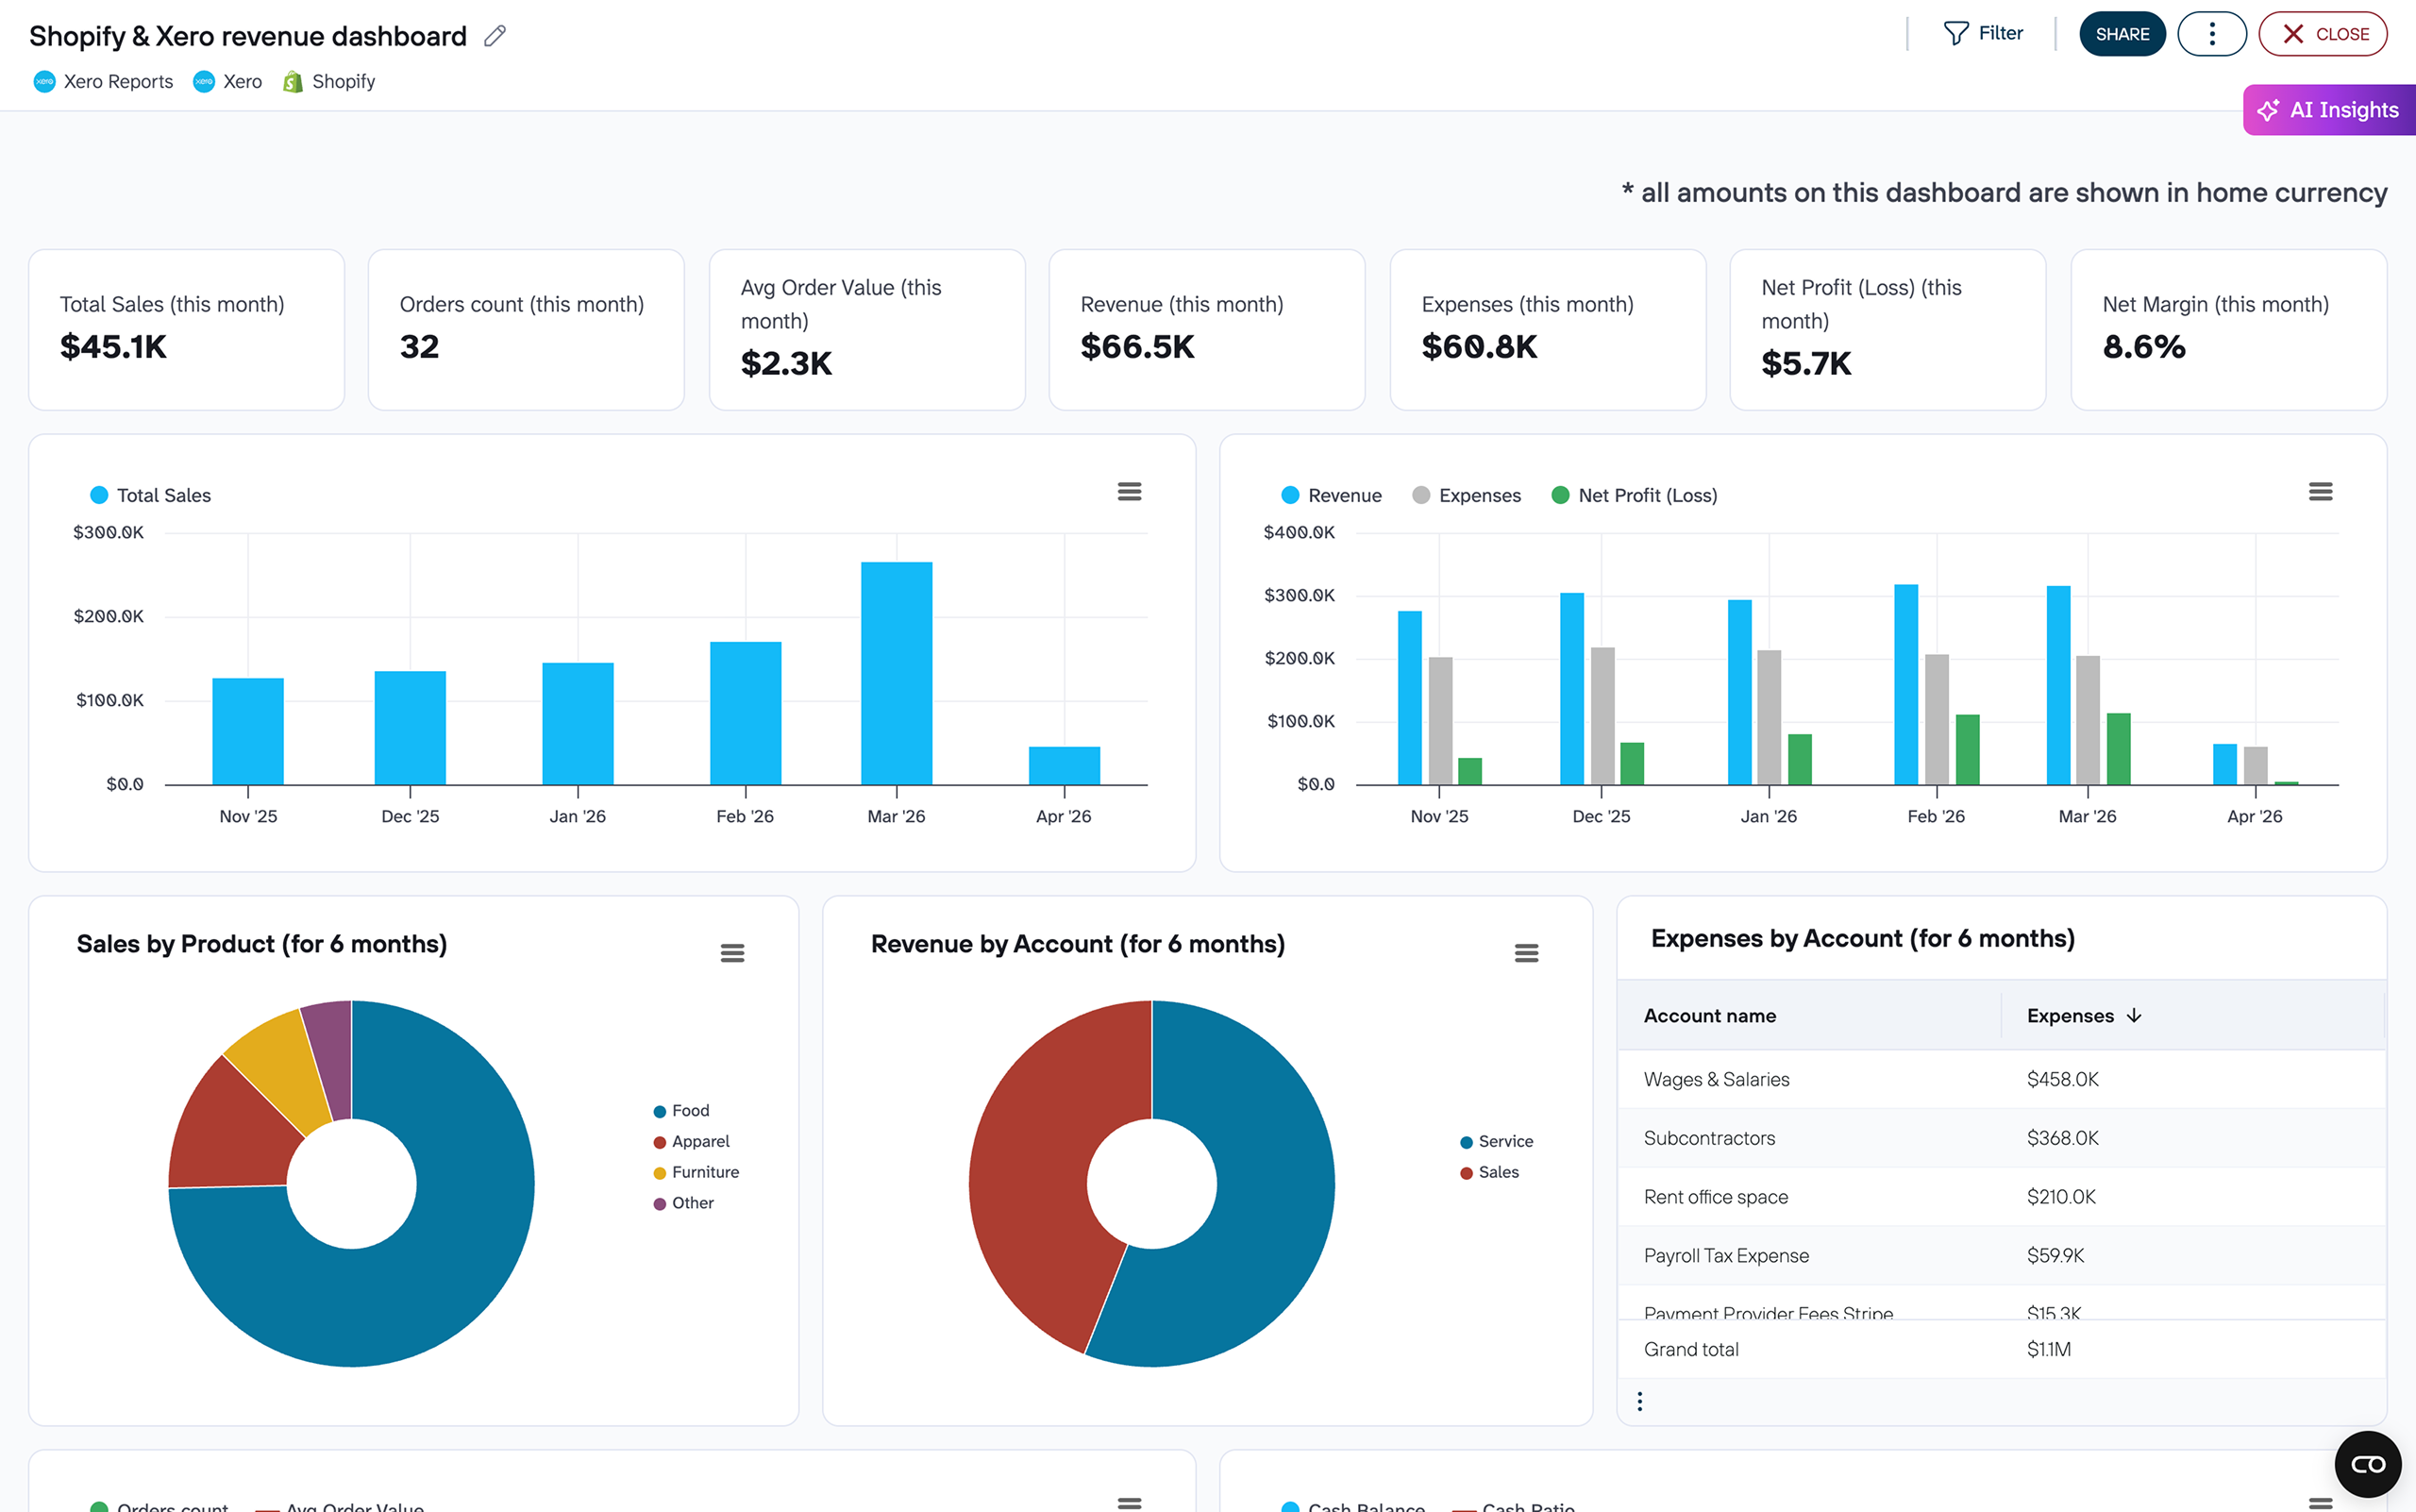
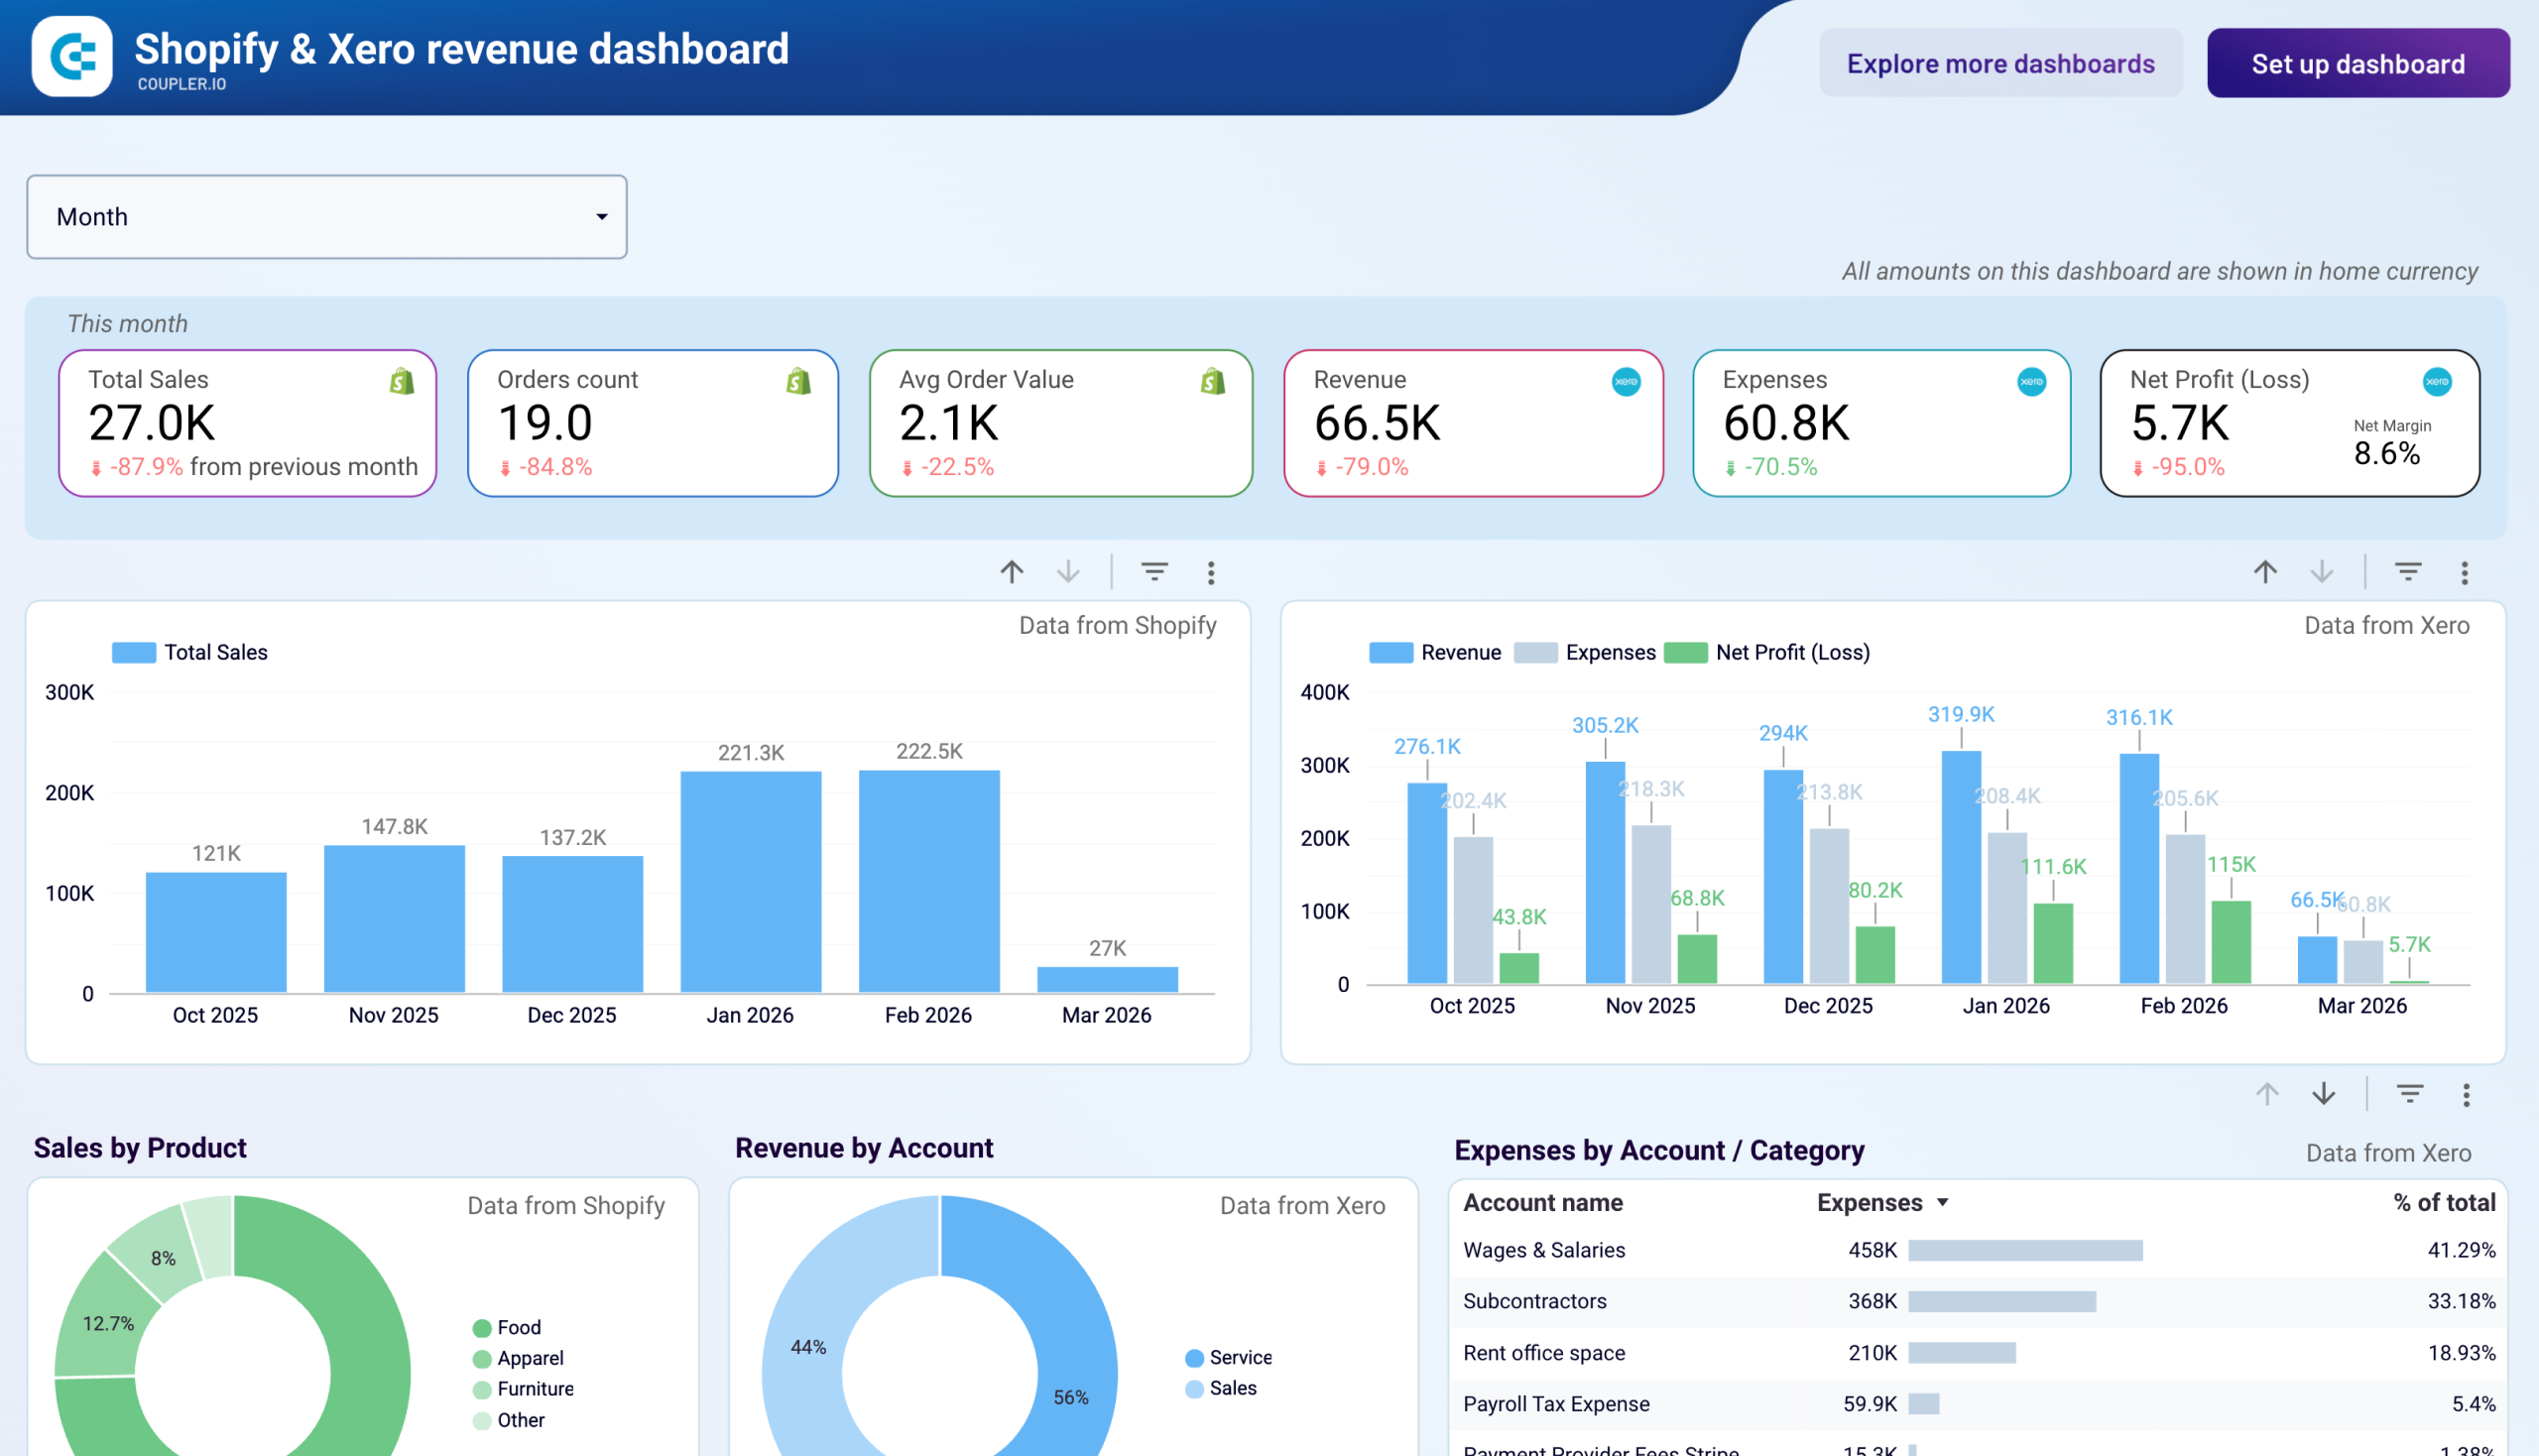
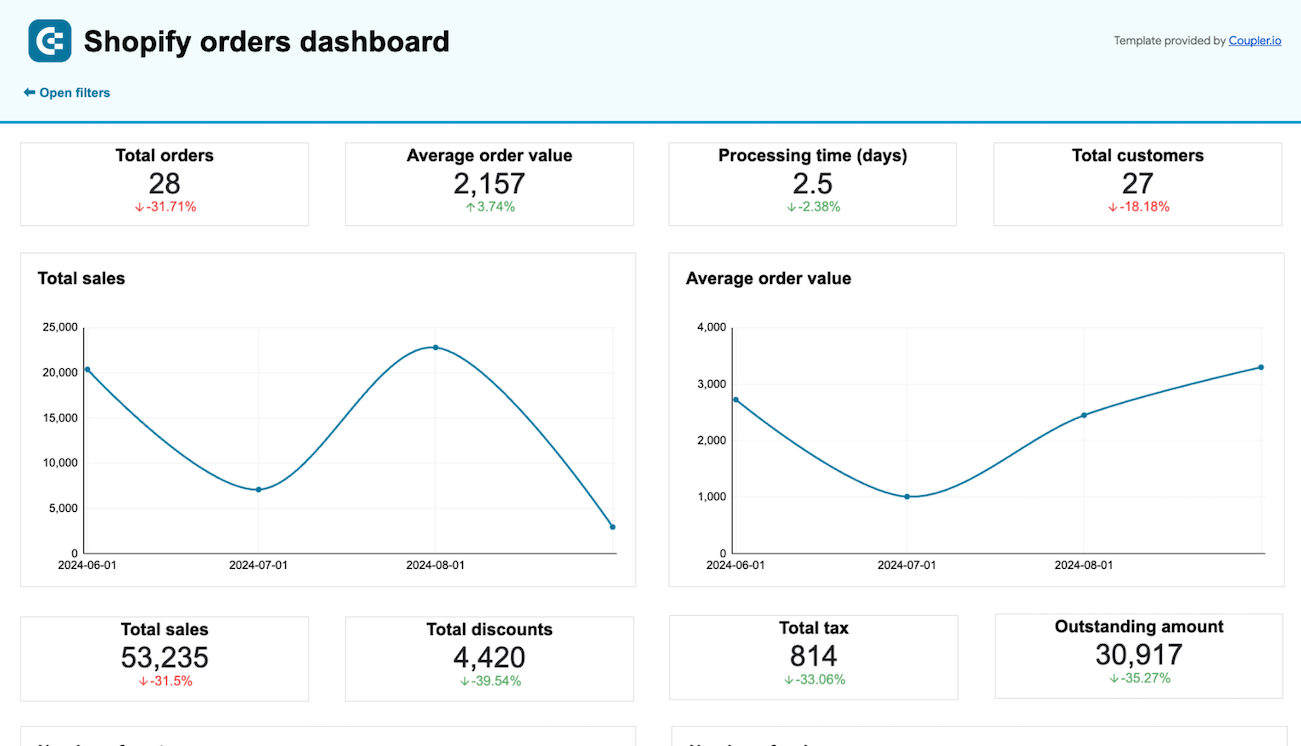
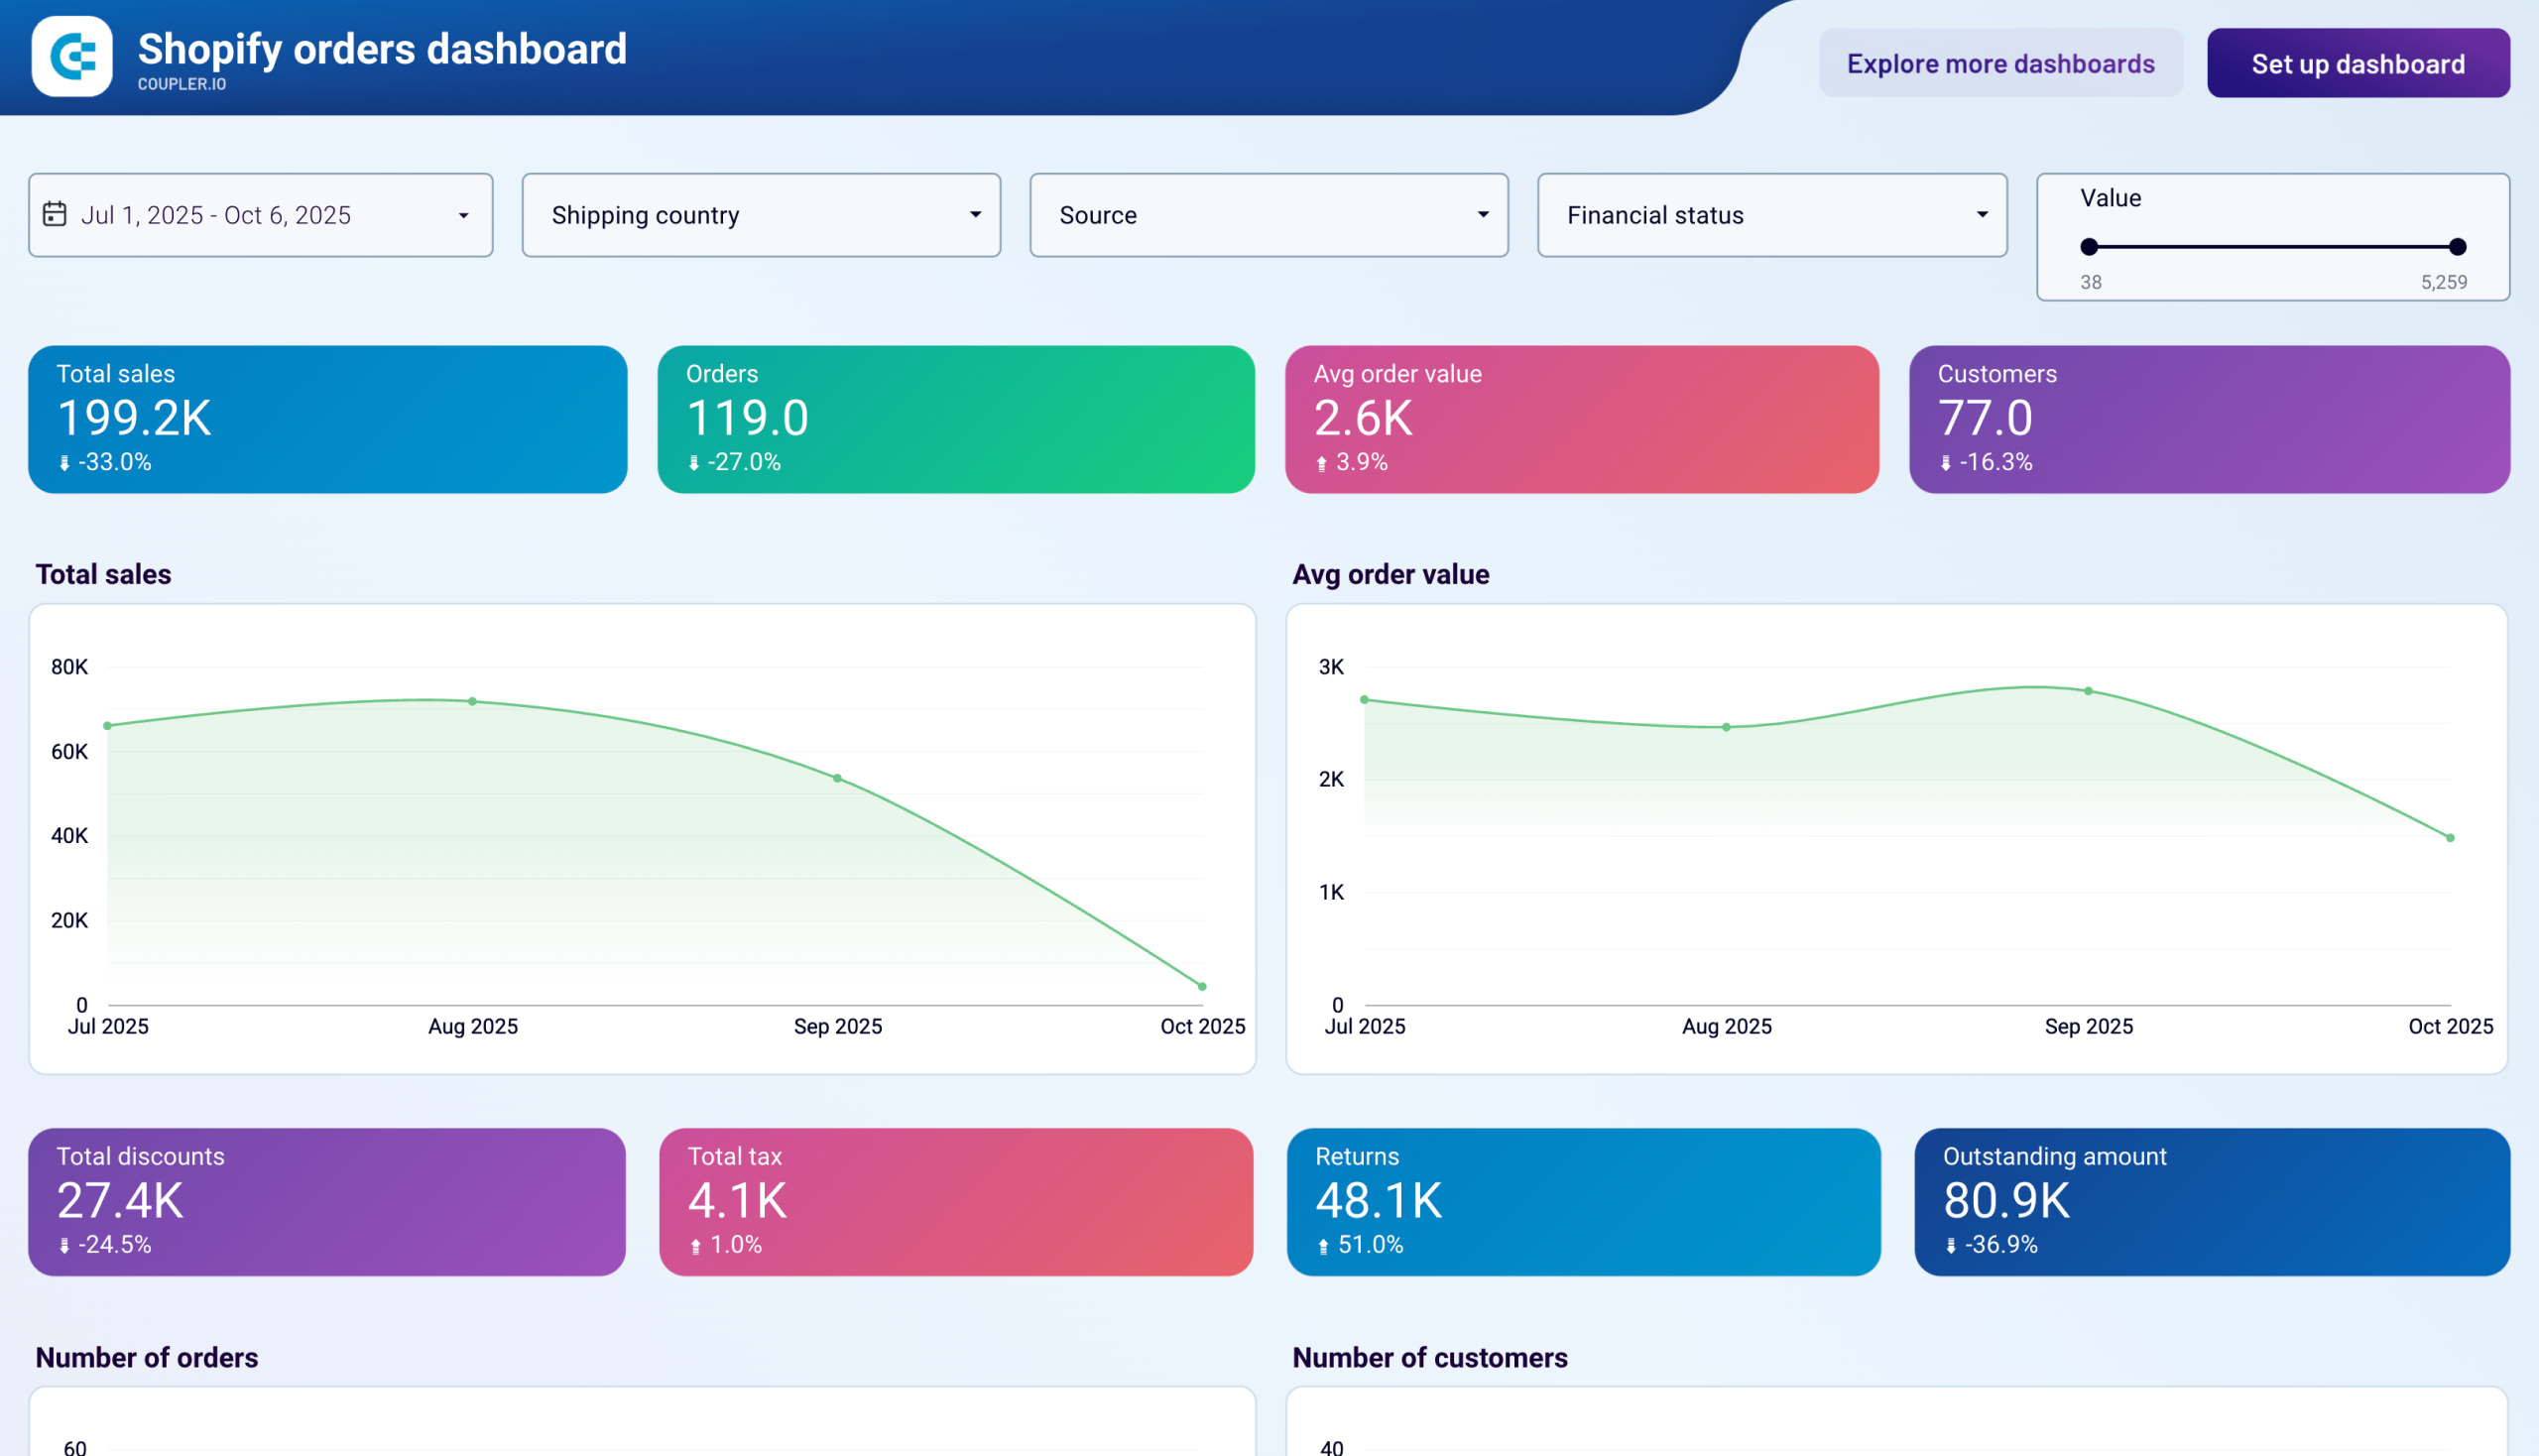
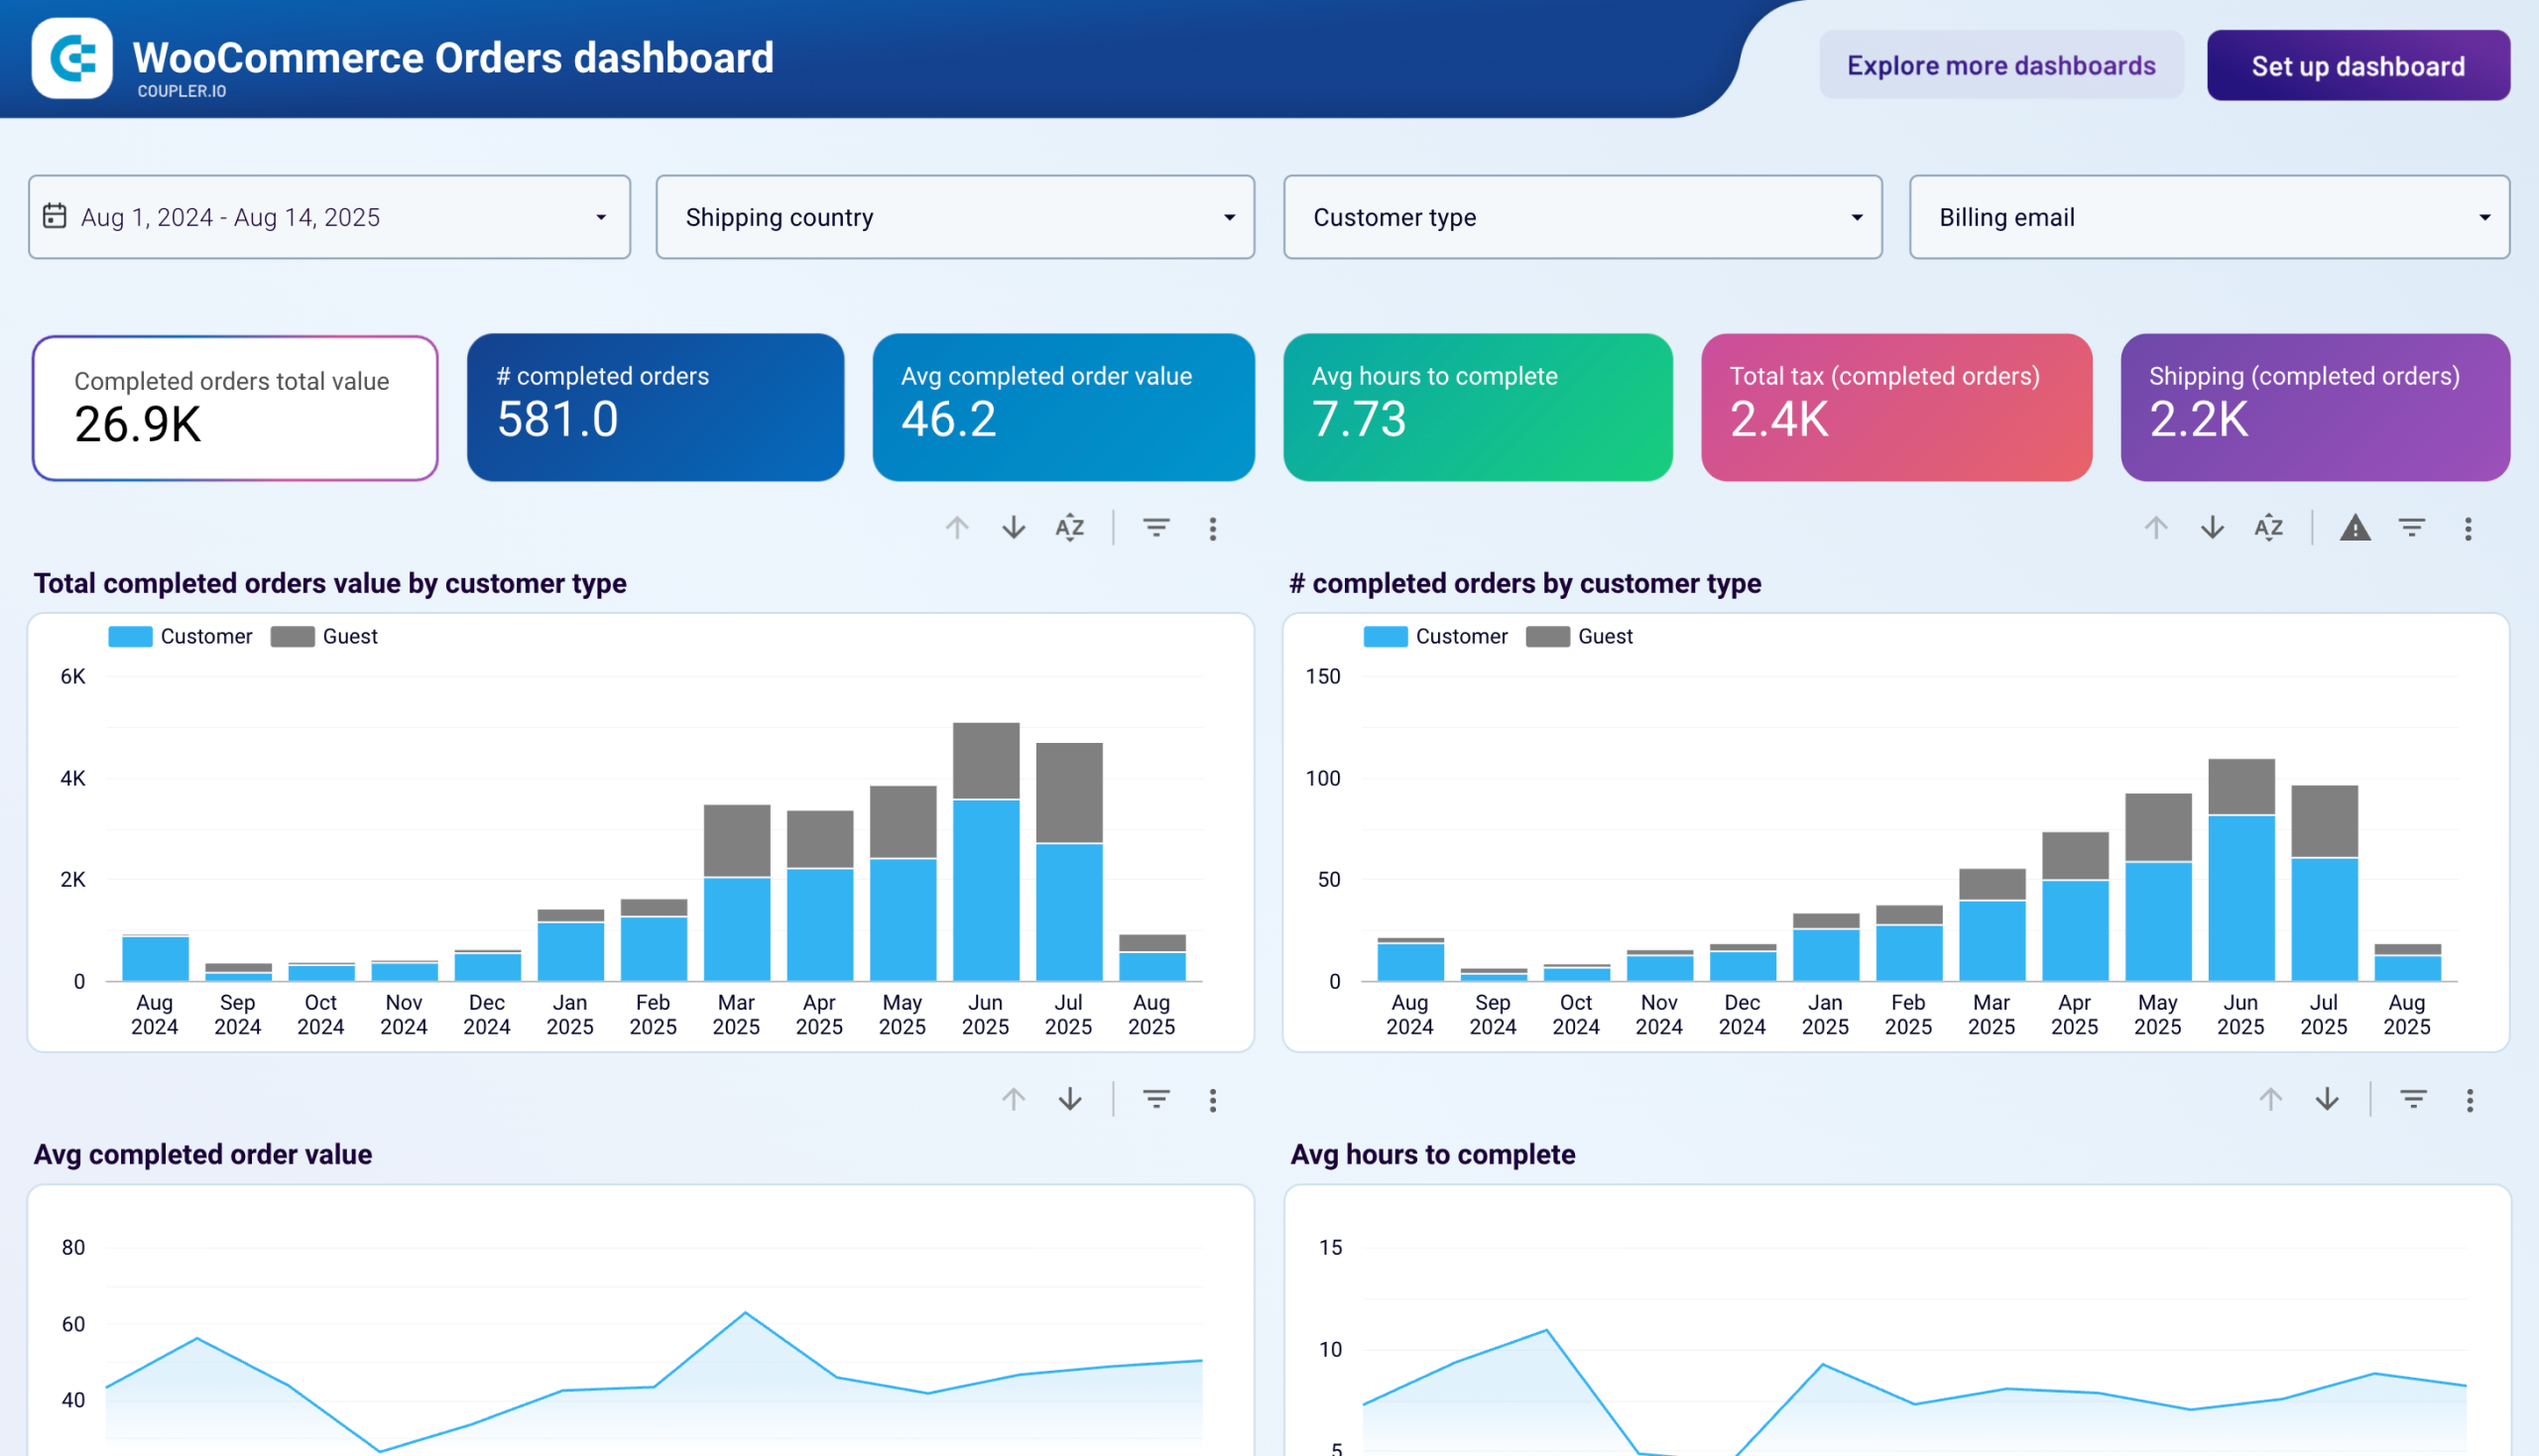
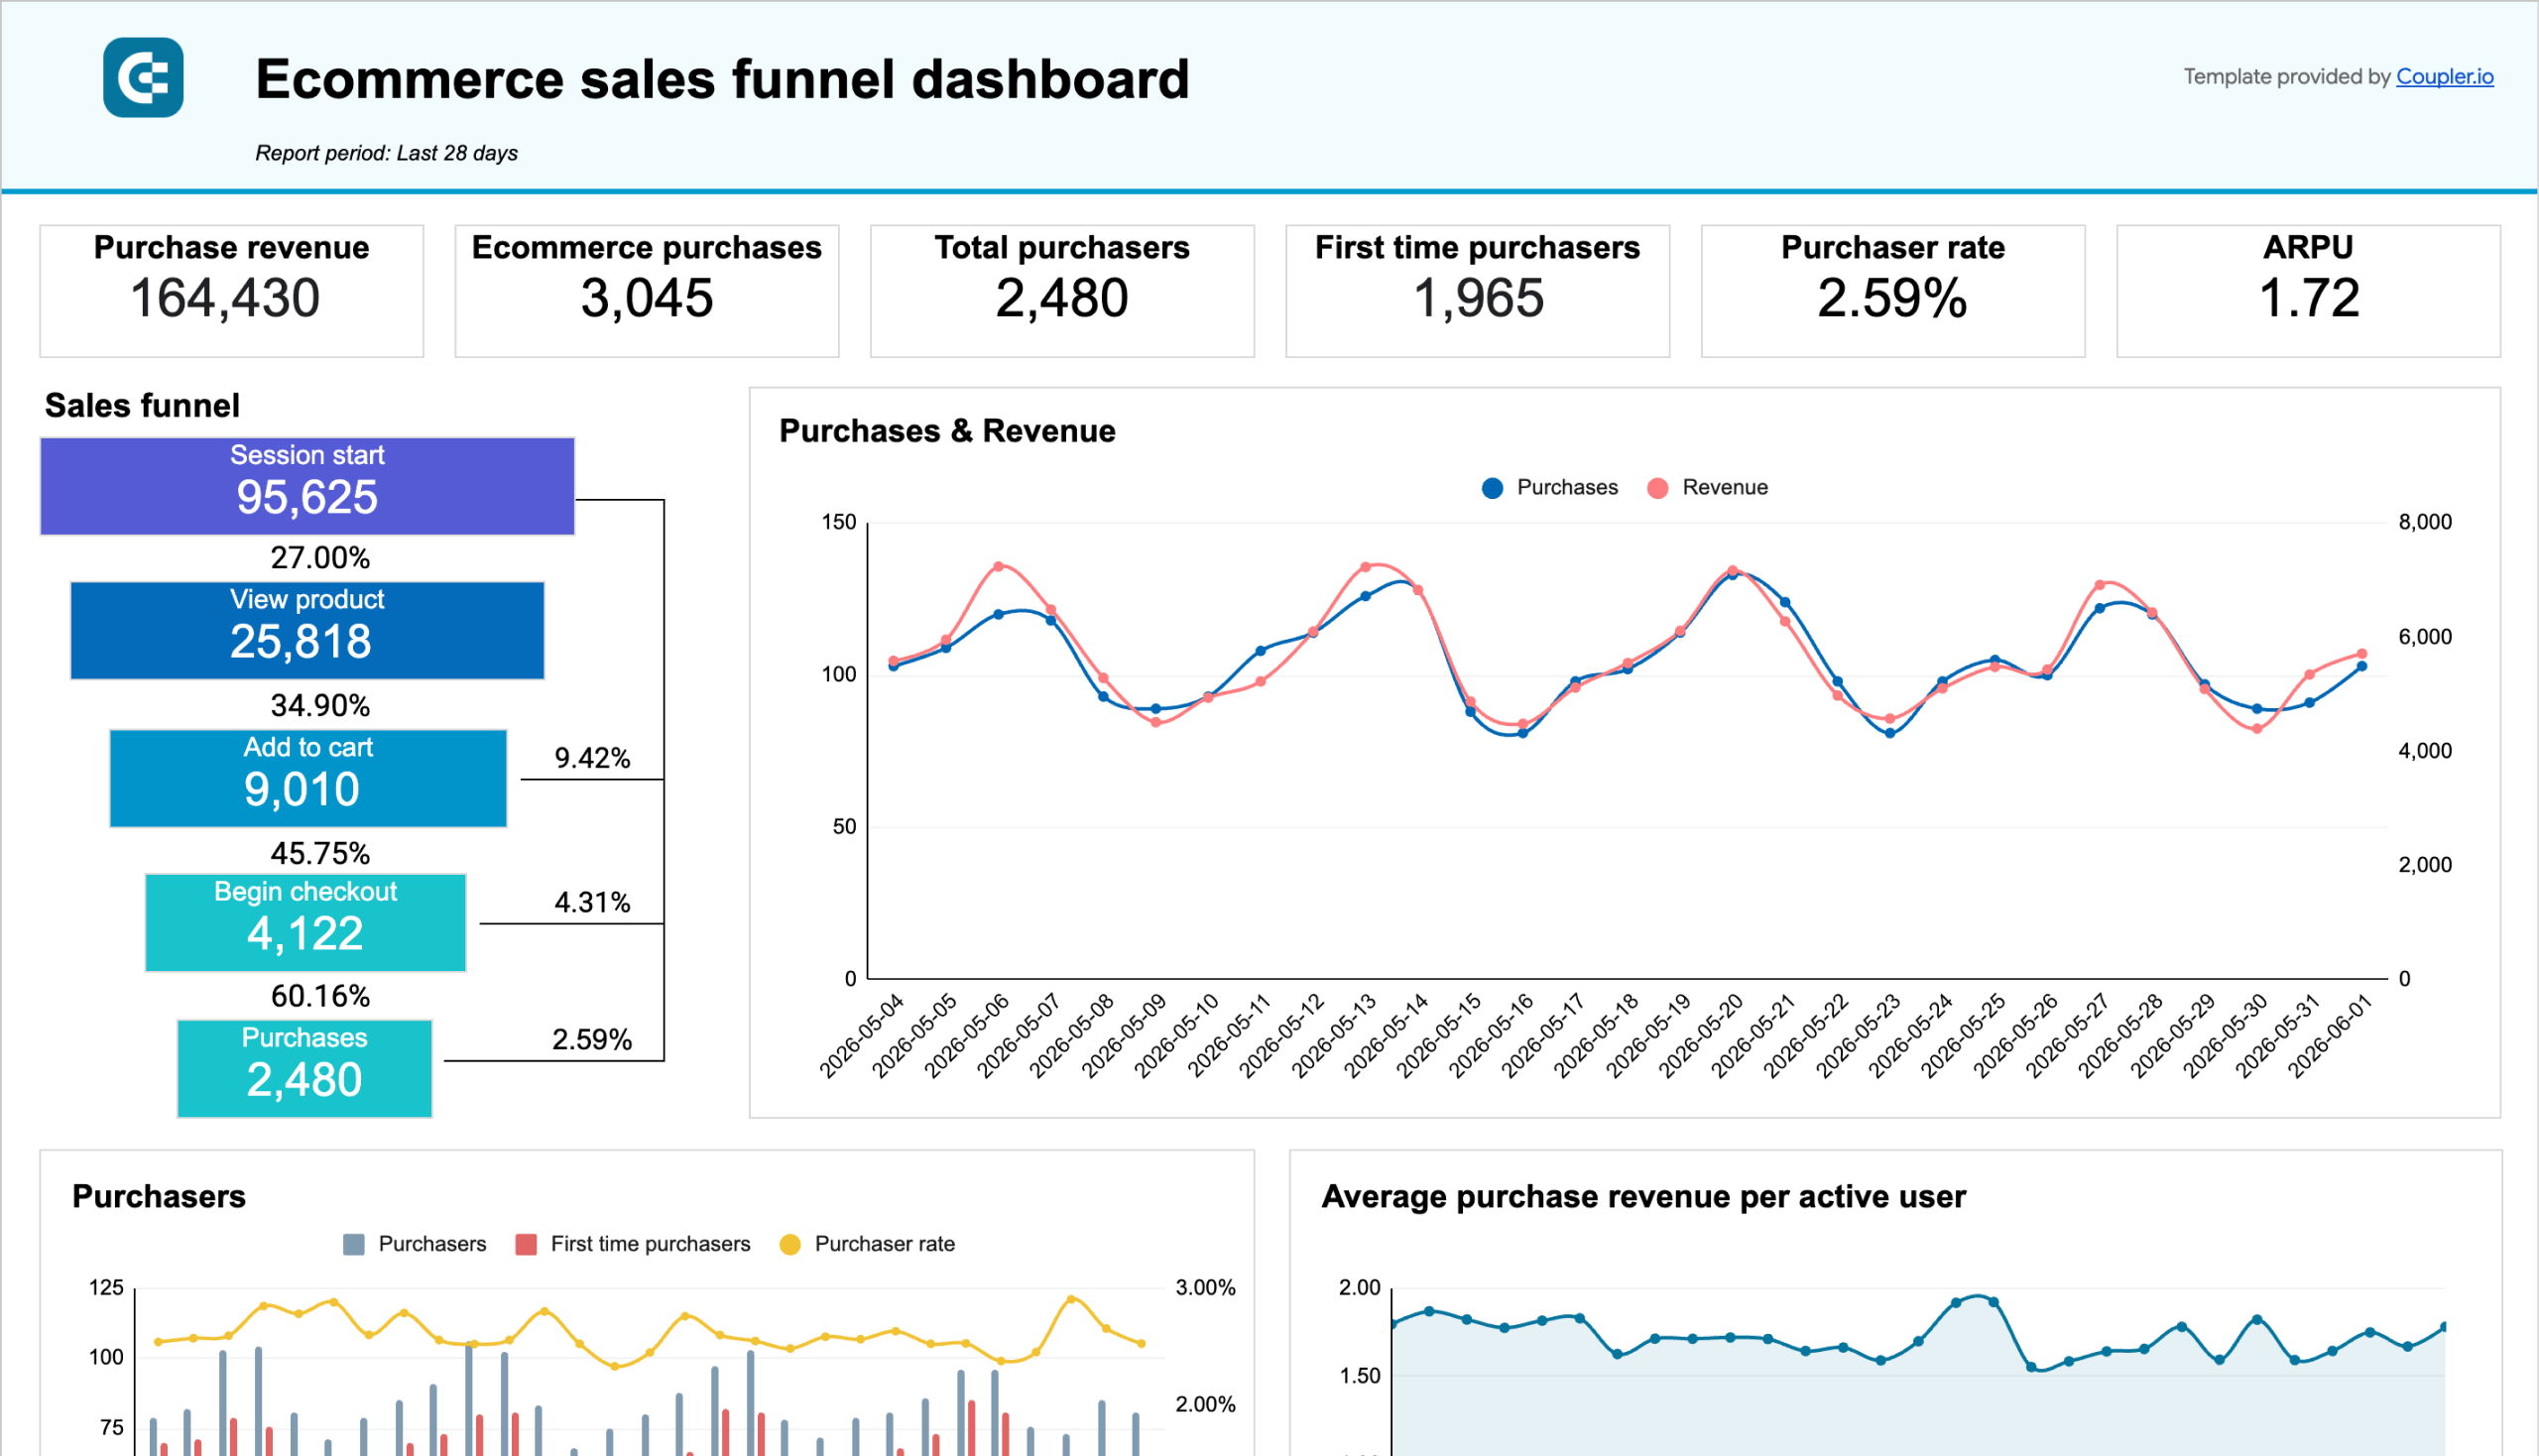
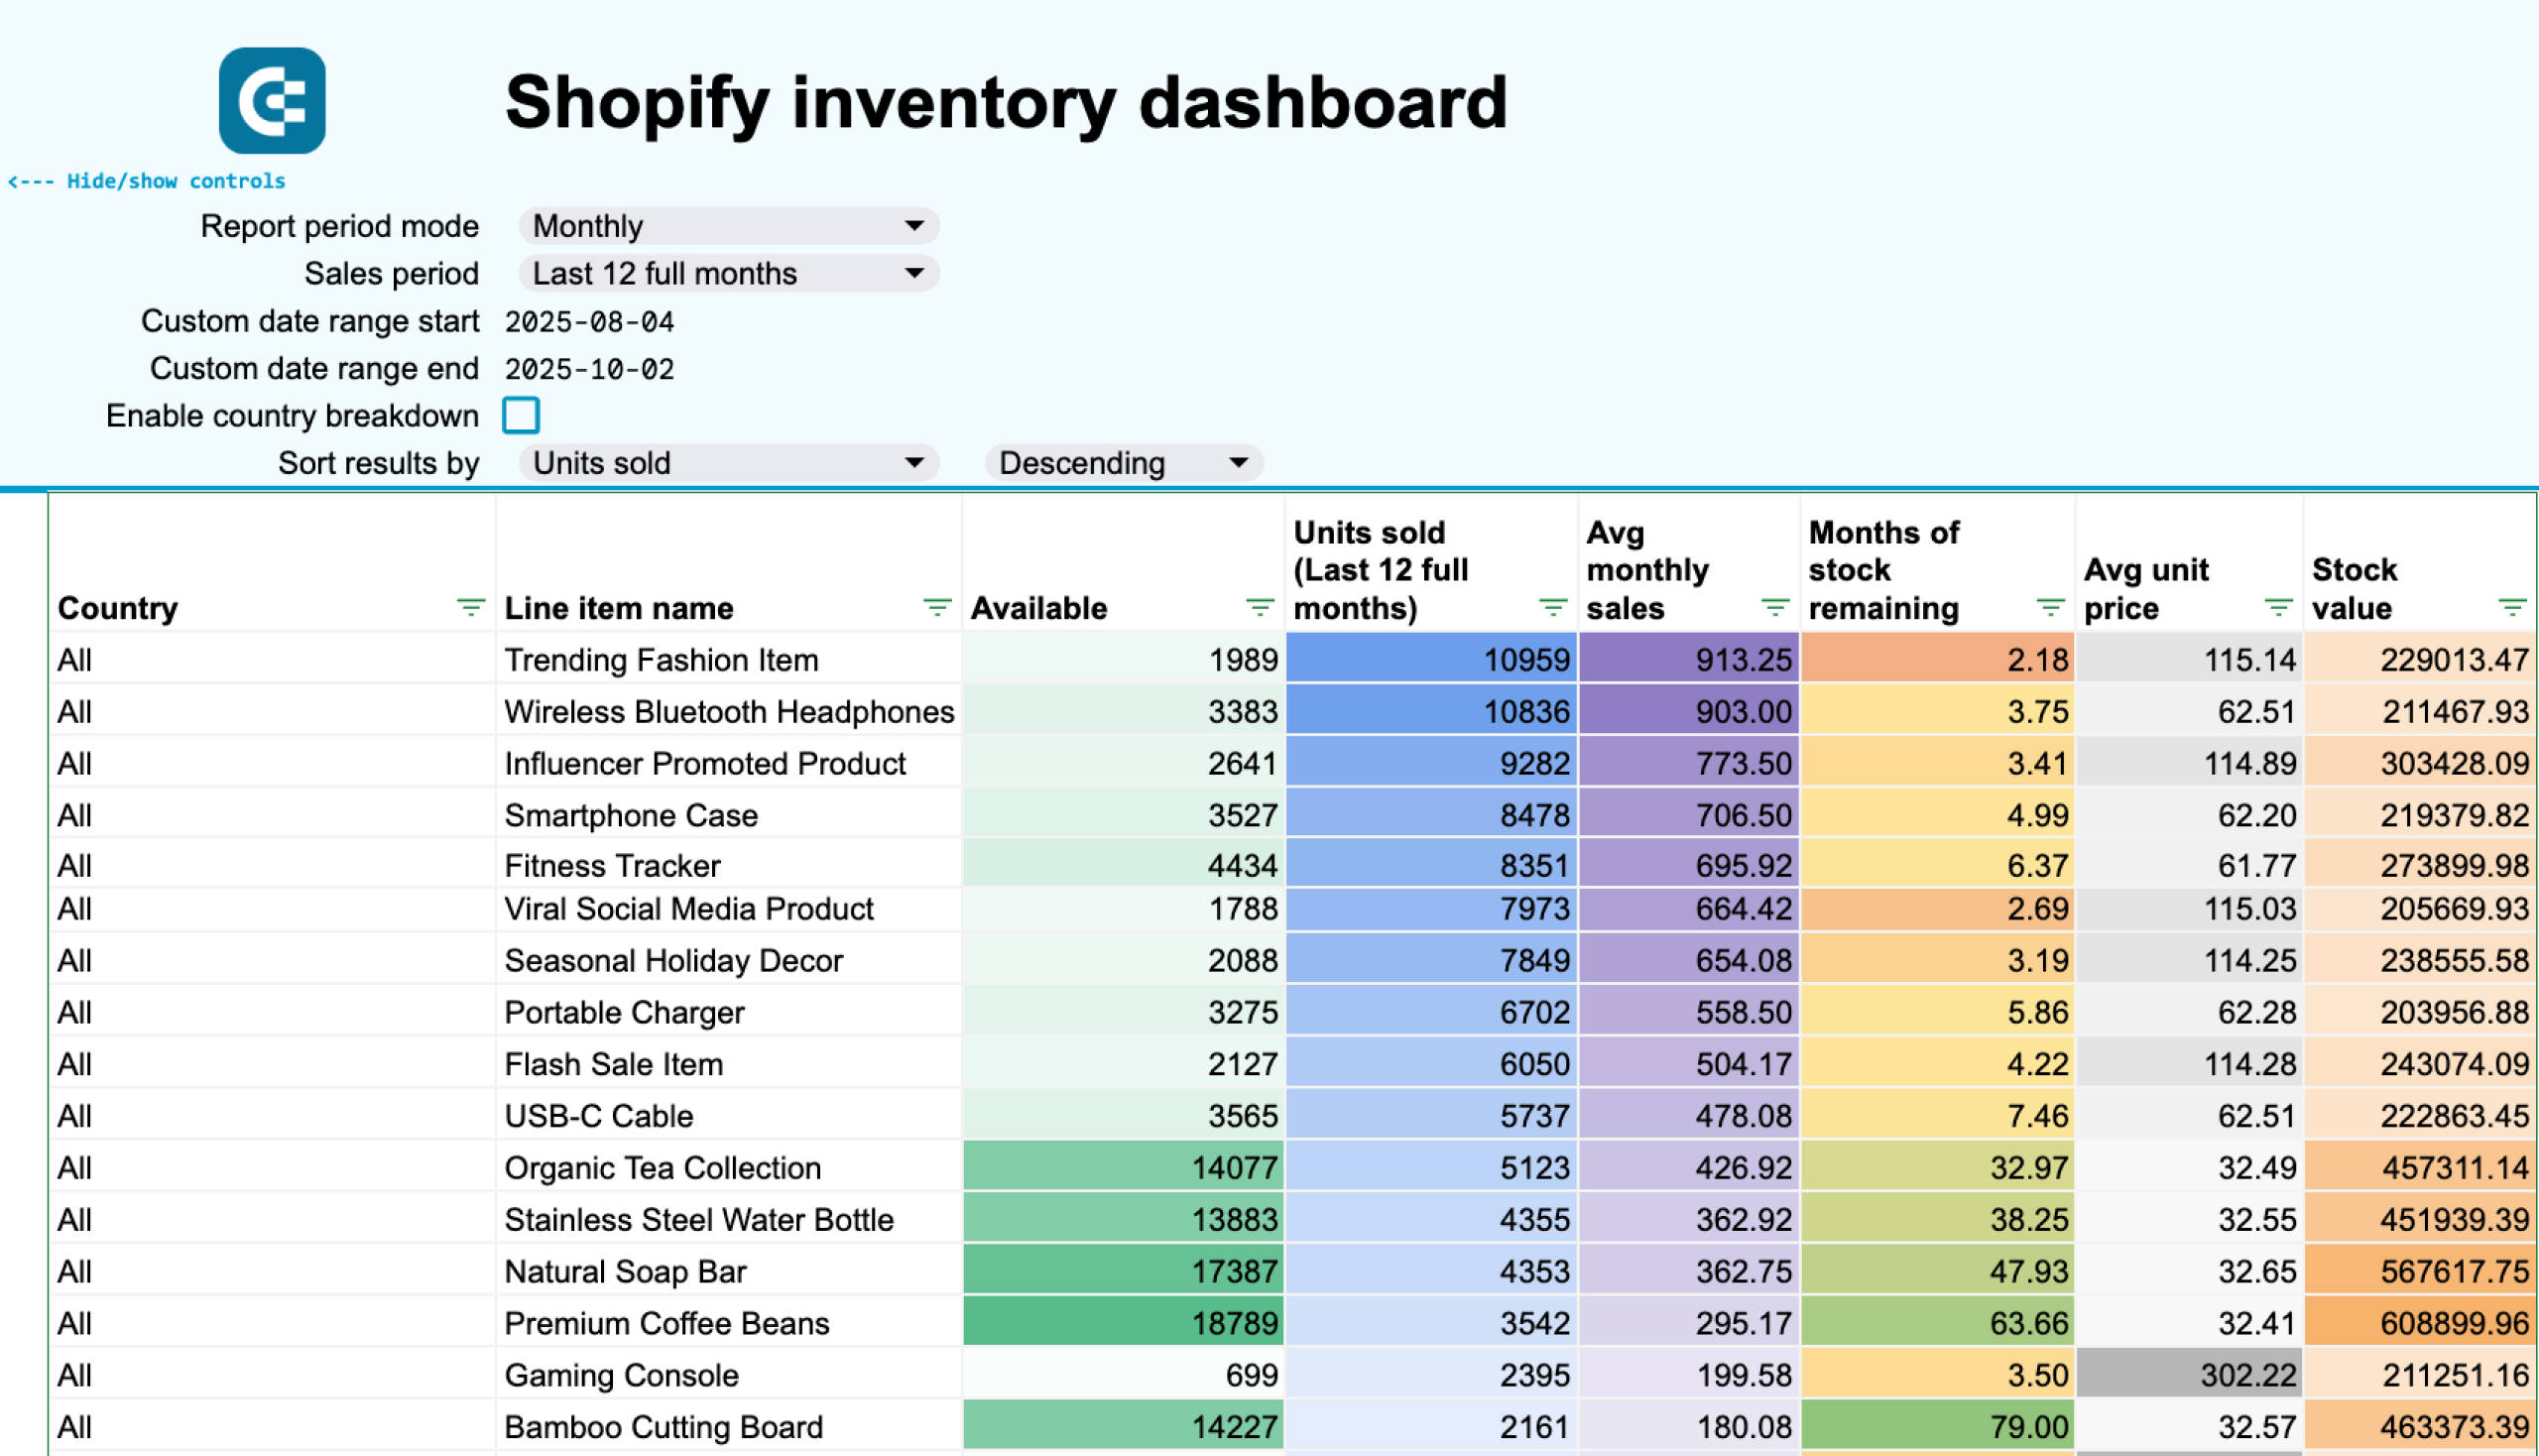
The foundation of any effective ecommerce KPI dashboard template lies in comprehensive sales tracking that monitors revenue trends, order volumes, and transaction patterns over time. This report consolidates data from your Shopify store to display monthly sales dynamics, order status breakdowns, and financial performance indicators. Key components include revenue comparisons across different periods, order fulfillment tracking, and payment status monitoring. The sales performance report enables store owners to identify seasonal patterns, spot growth opportunities, and address potential issues in their order processing workflow before they impact customer satisfaction.
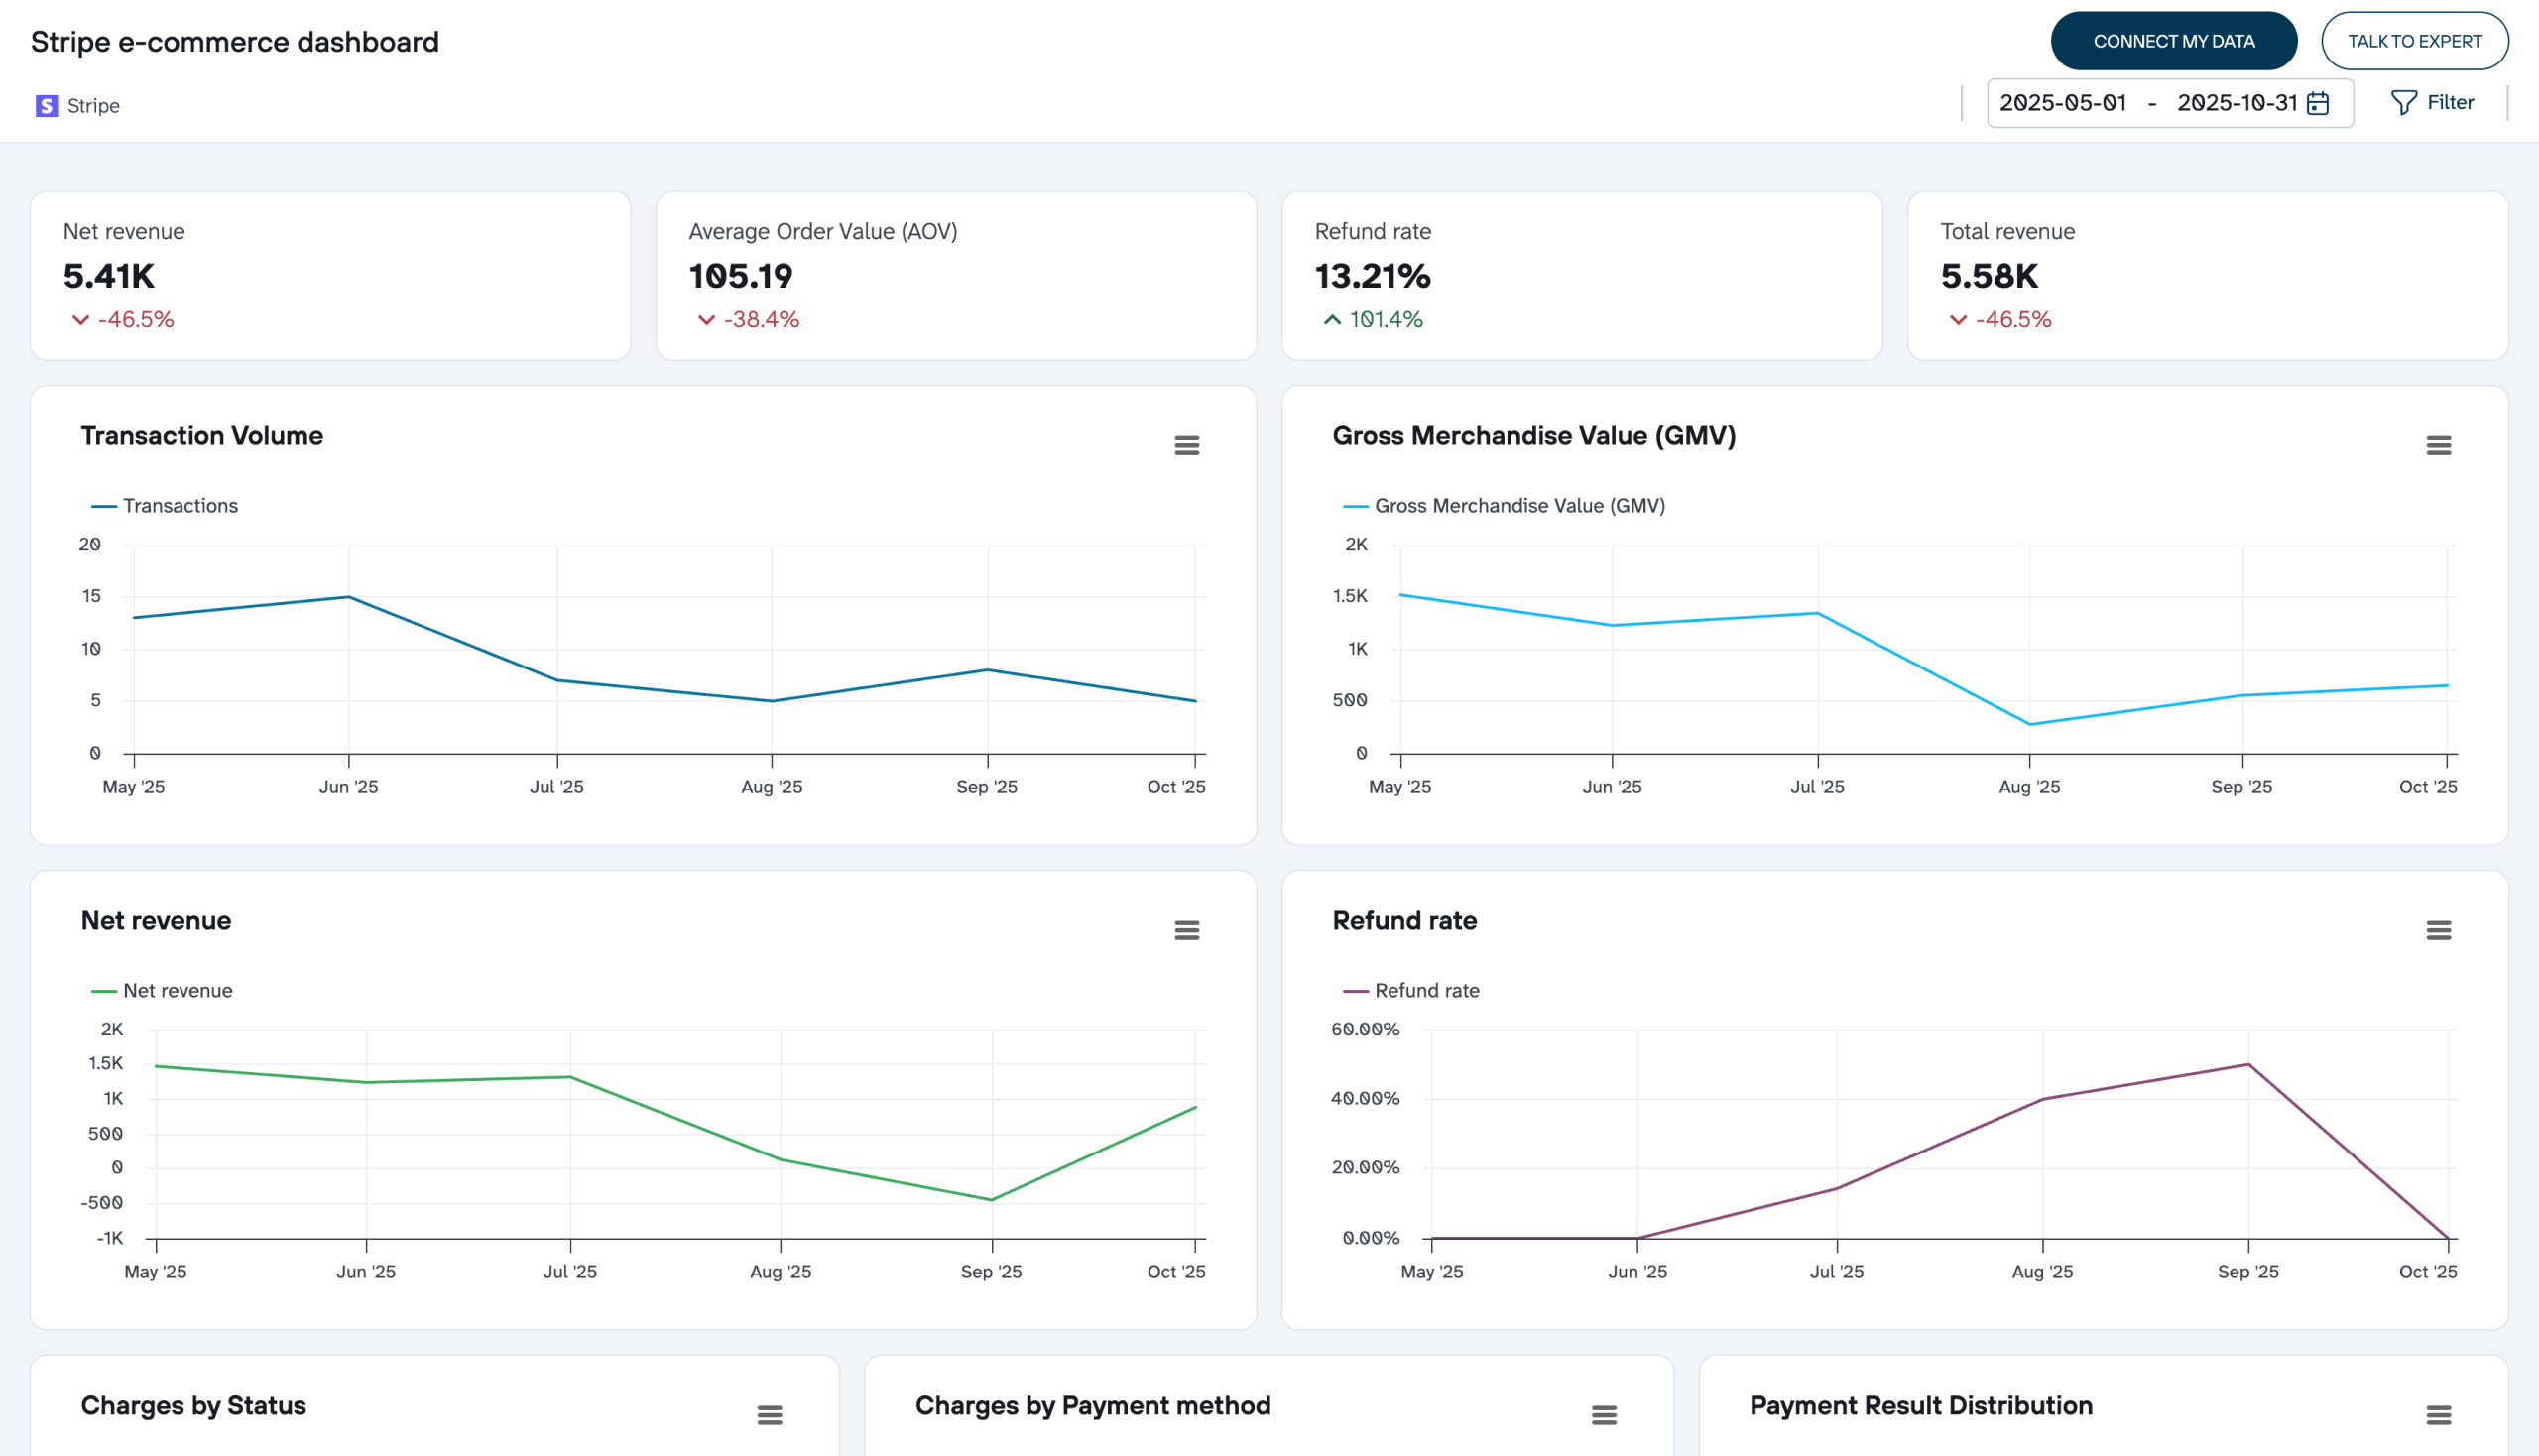
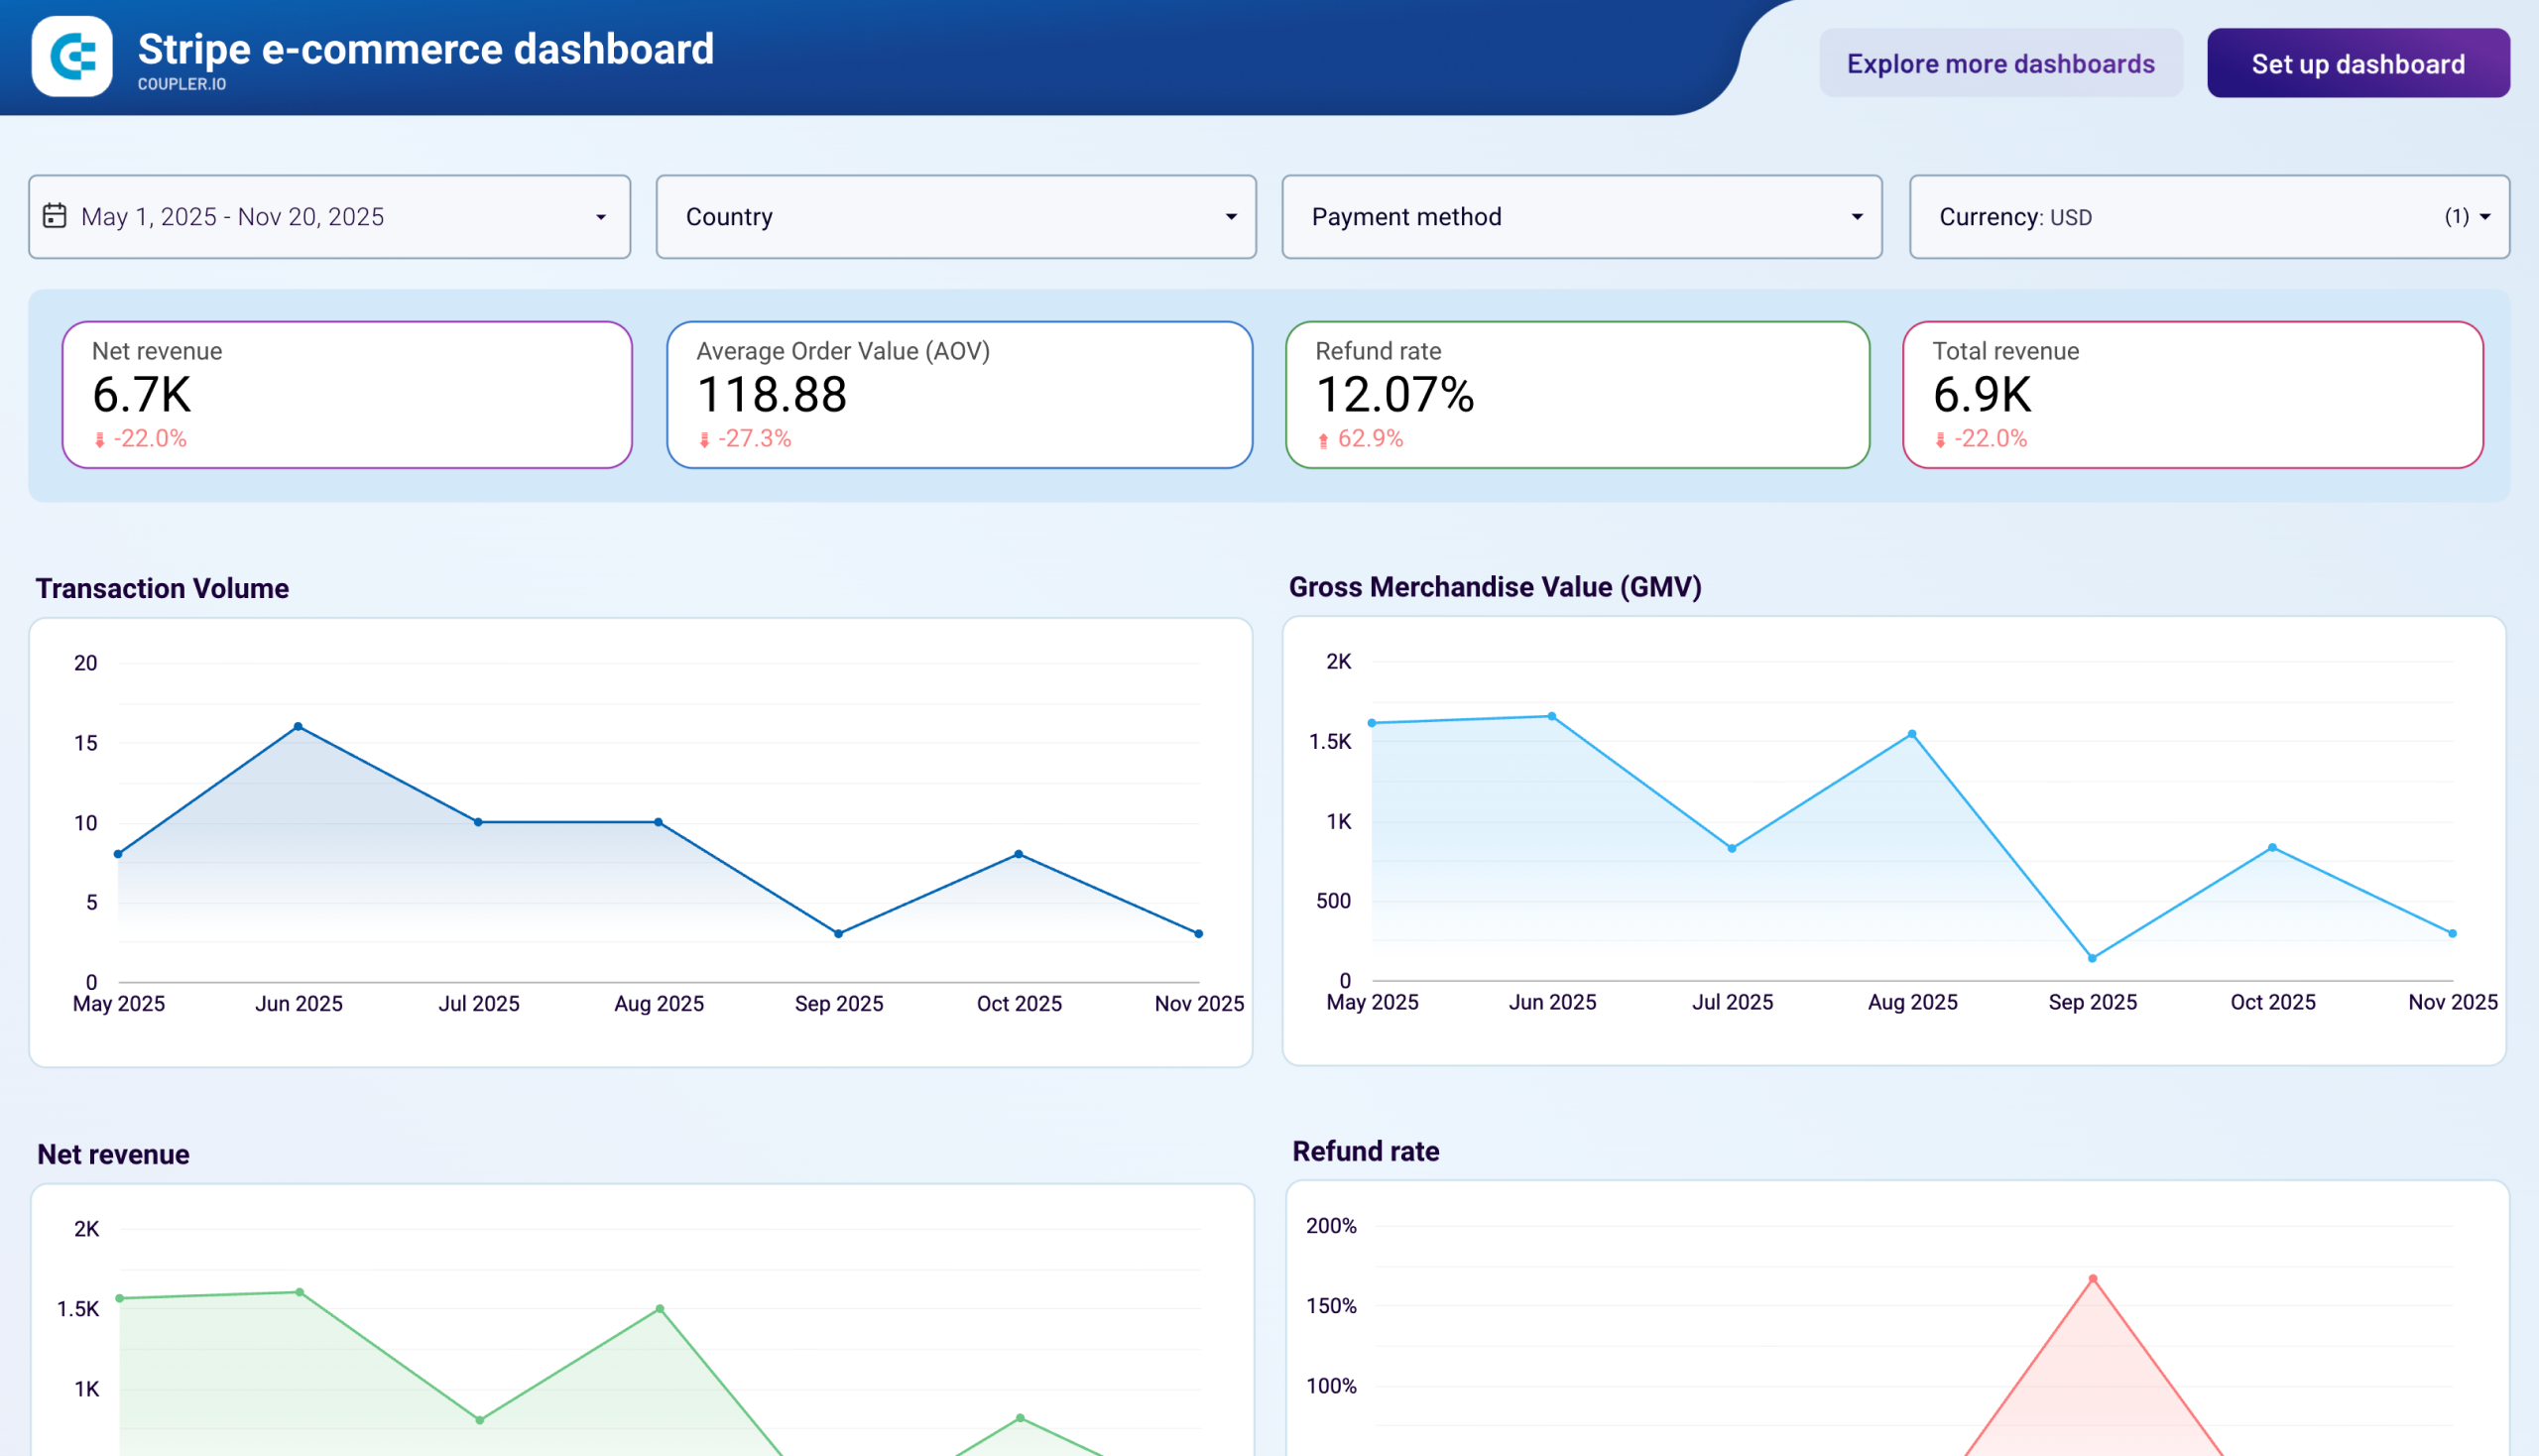
Understanding which marketing channels drive actual sales requires sophisticated attribution tracking that connects advertising spend to revenue outcomes. This report combines data from multiple advertising platforms with your Shopify sales data to show the complete customer journey from initial ad impression to final purchase. The marketing attribution analysis tracks platform-specific performance, calculates return on ad spend, and identifies the most cost-effective channels for customer acquisition. This insight proves essential for optimizing marketing budgets and scaling successful campaigns while eliminating underperforming advertising investments.
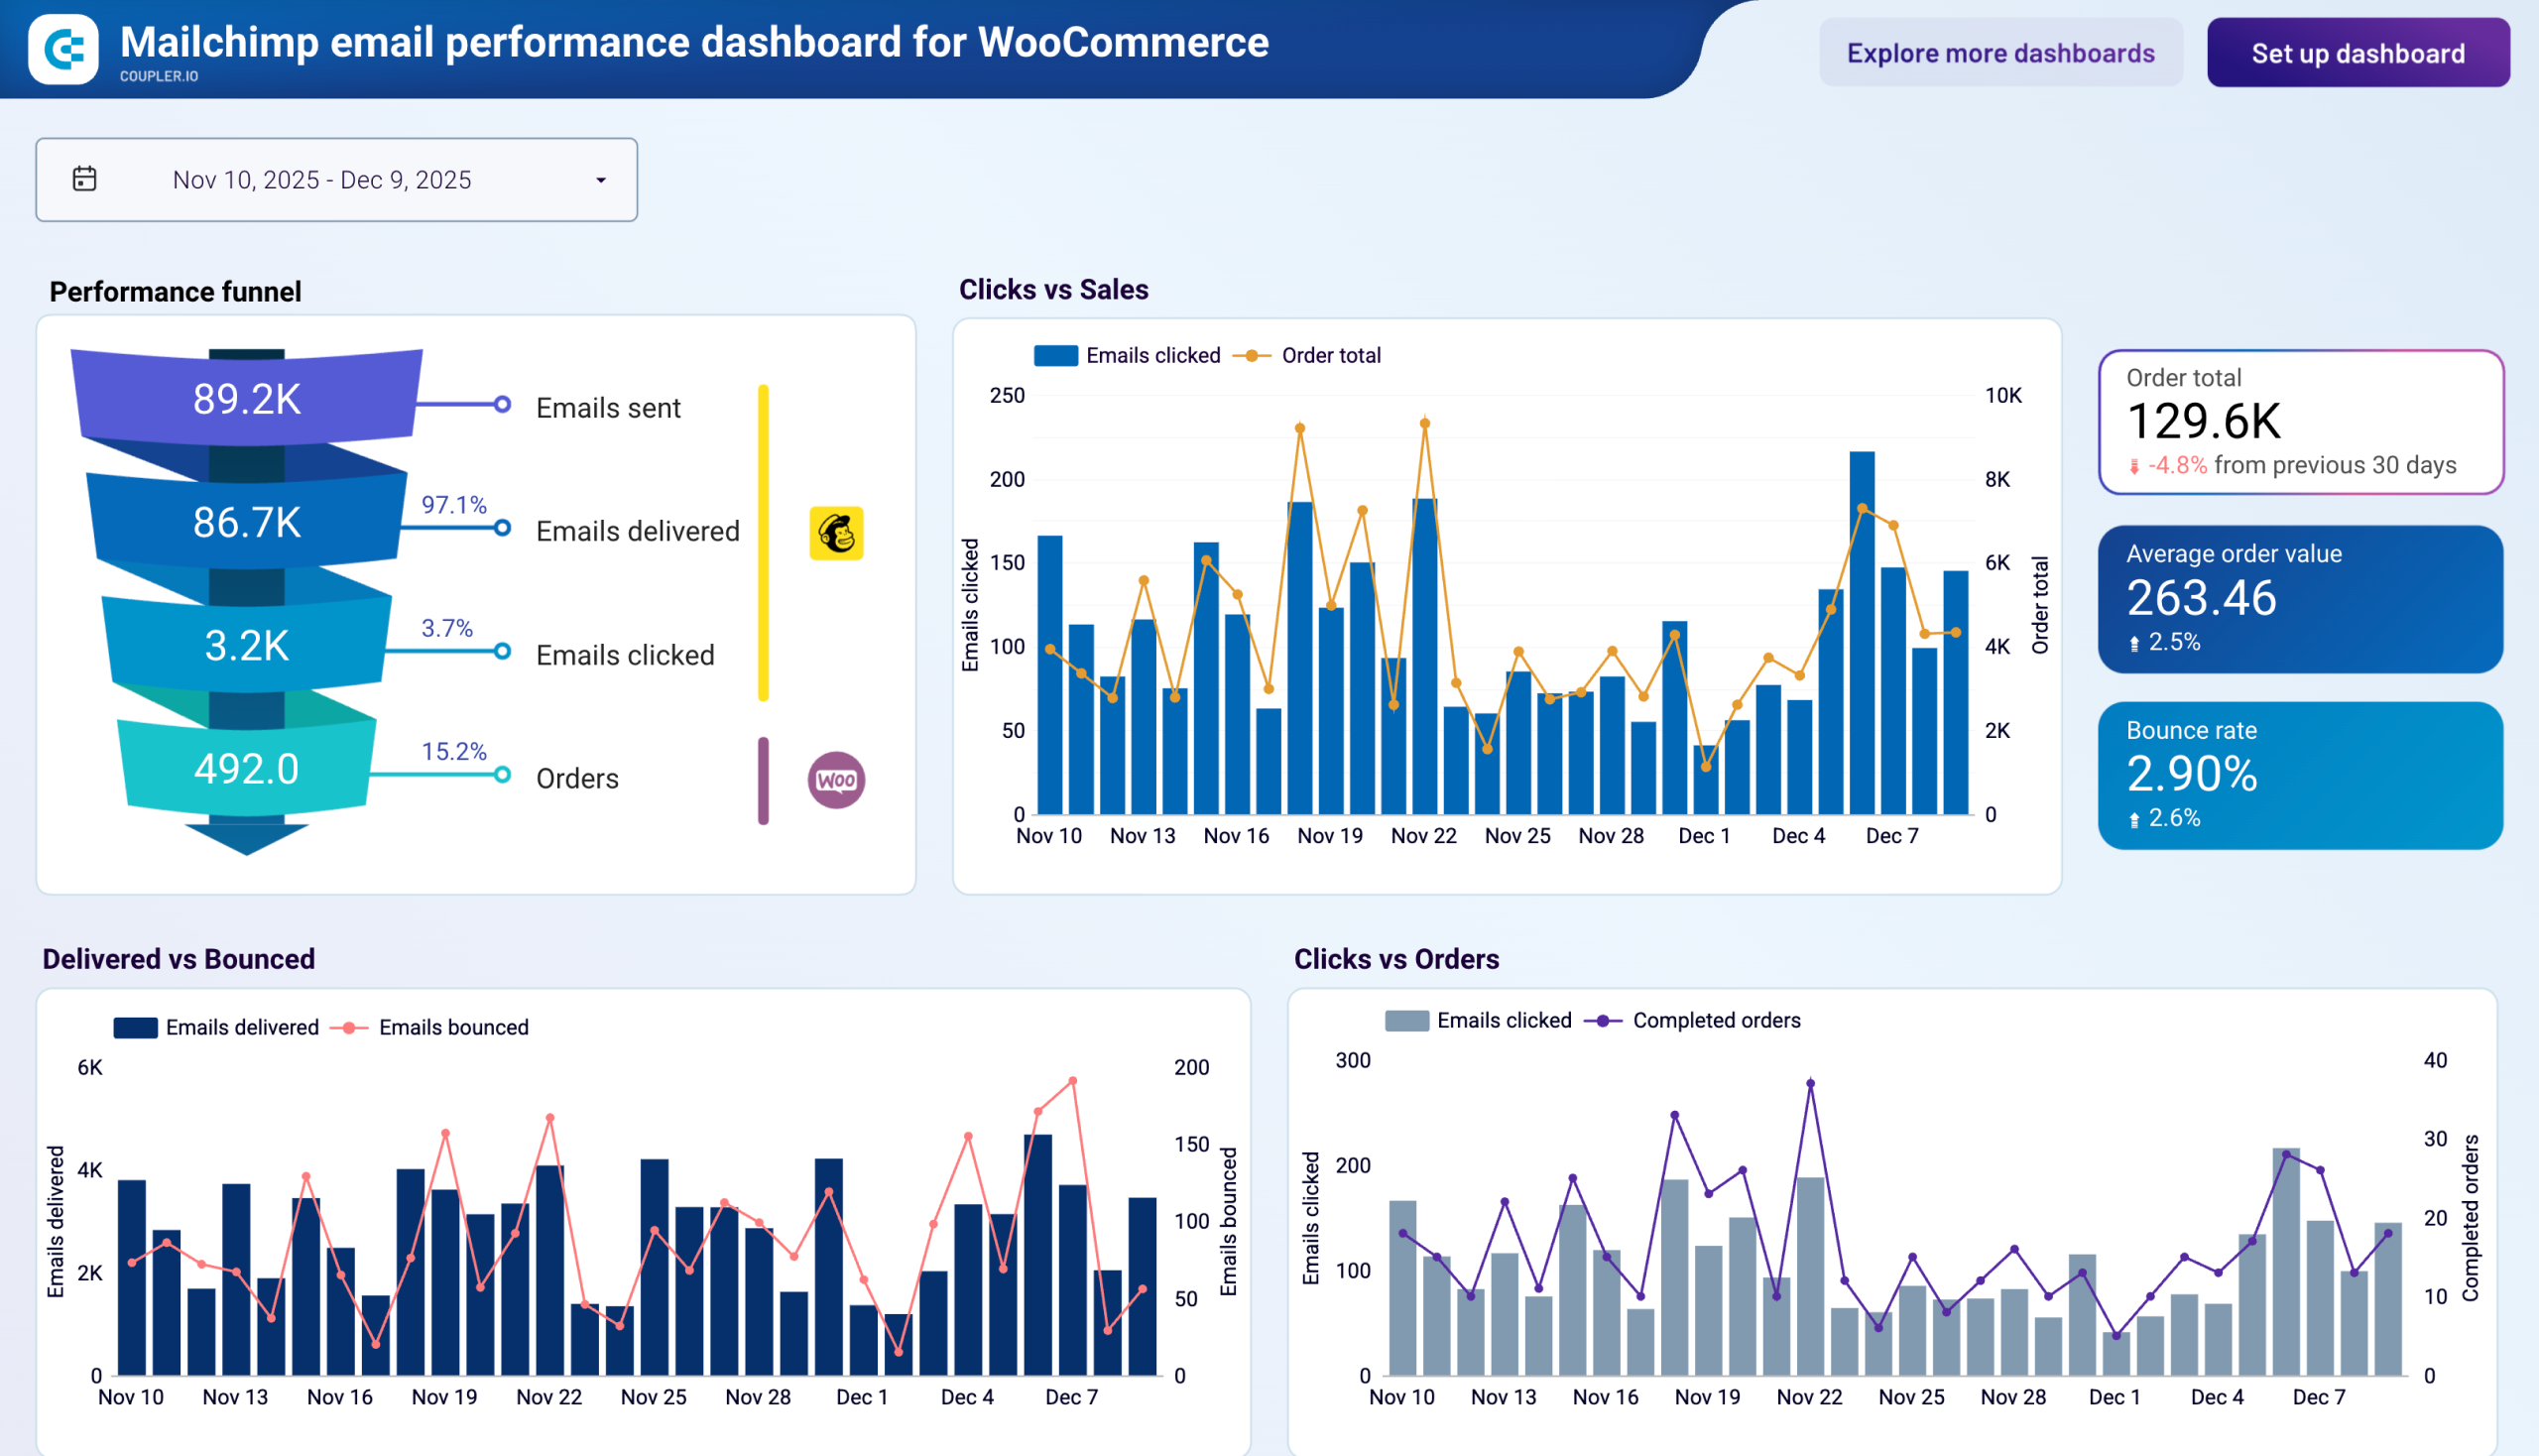
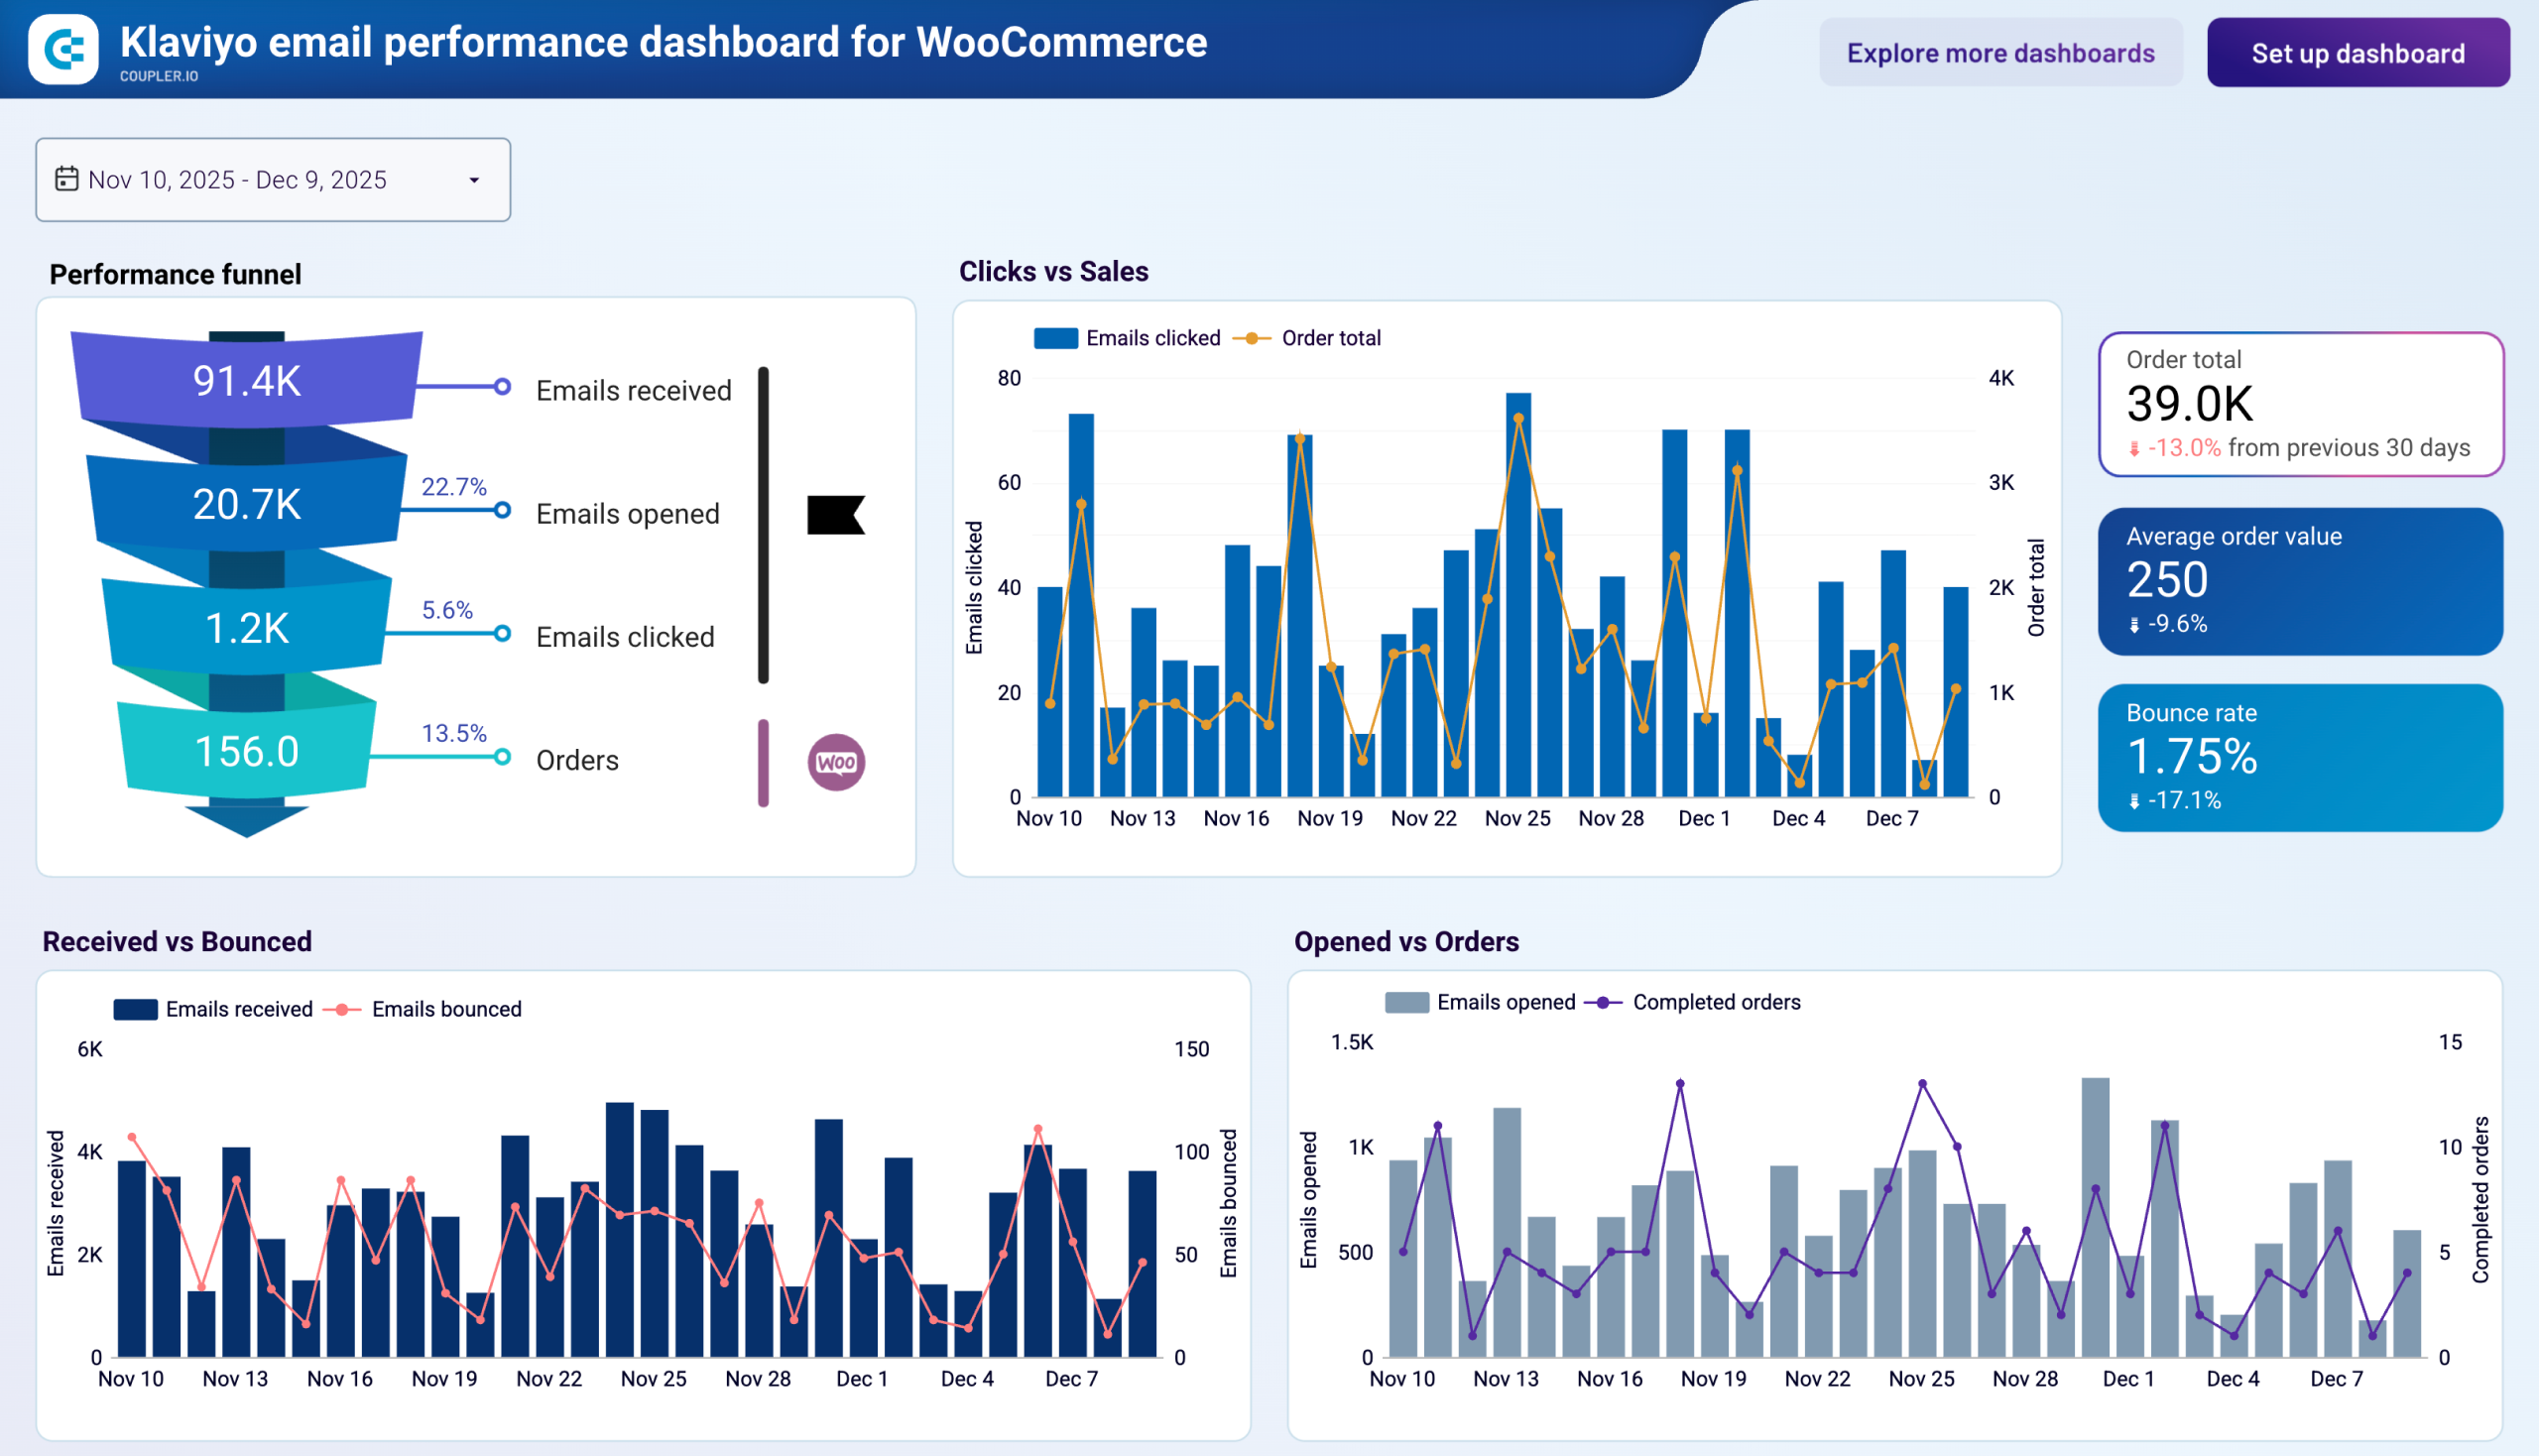
Analyzing how customers interact with your store and marketing communications reveals patterns that directly impact revenue and retention strategies. This report integrates email marketing performance from Klaviyo and Mailchimp with actual purchase data to show which campaigns drive the highest value customers. The customer behavior analysis tracks acquisition costs, lifetime value calculations, and retention rates across different customer segments. Understanding these patterns helps optimize email marketing strategies, improve customer targeting, and develop more effective retention campaigns that increase overall profitability.
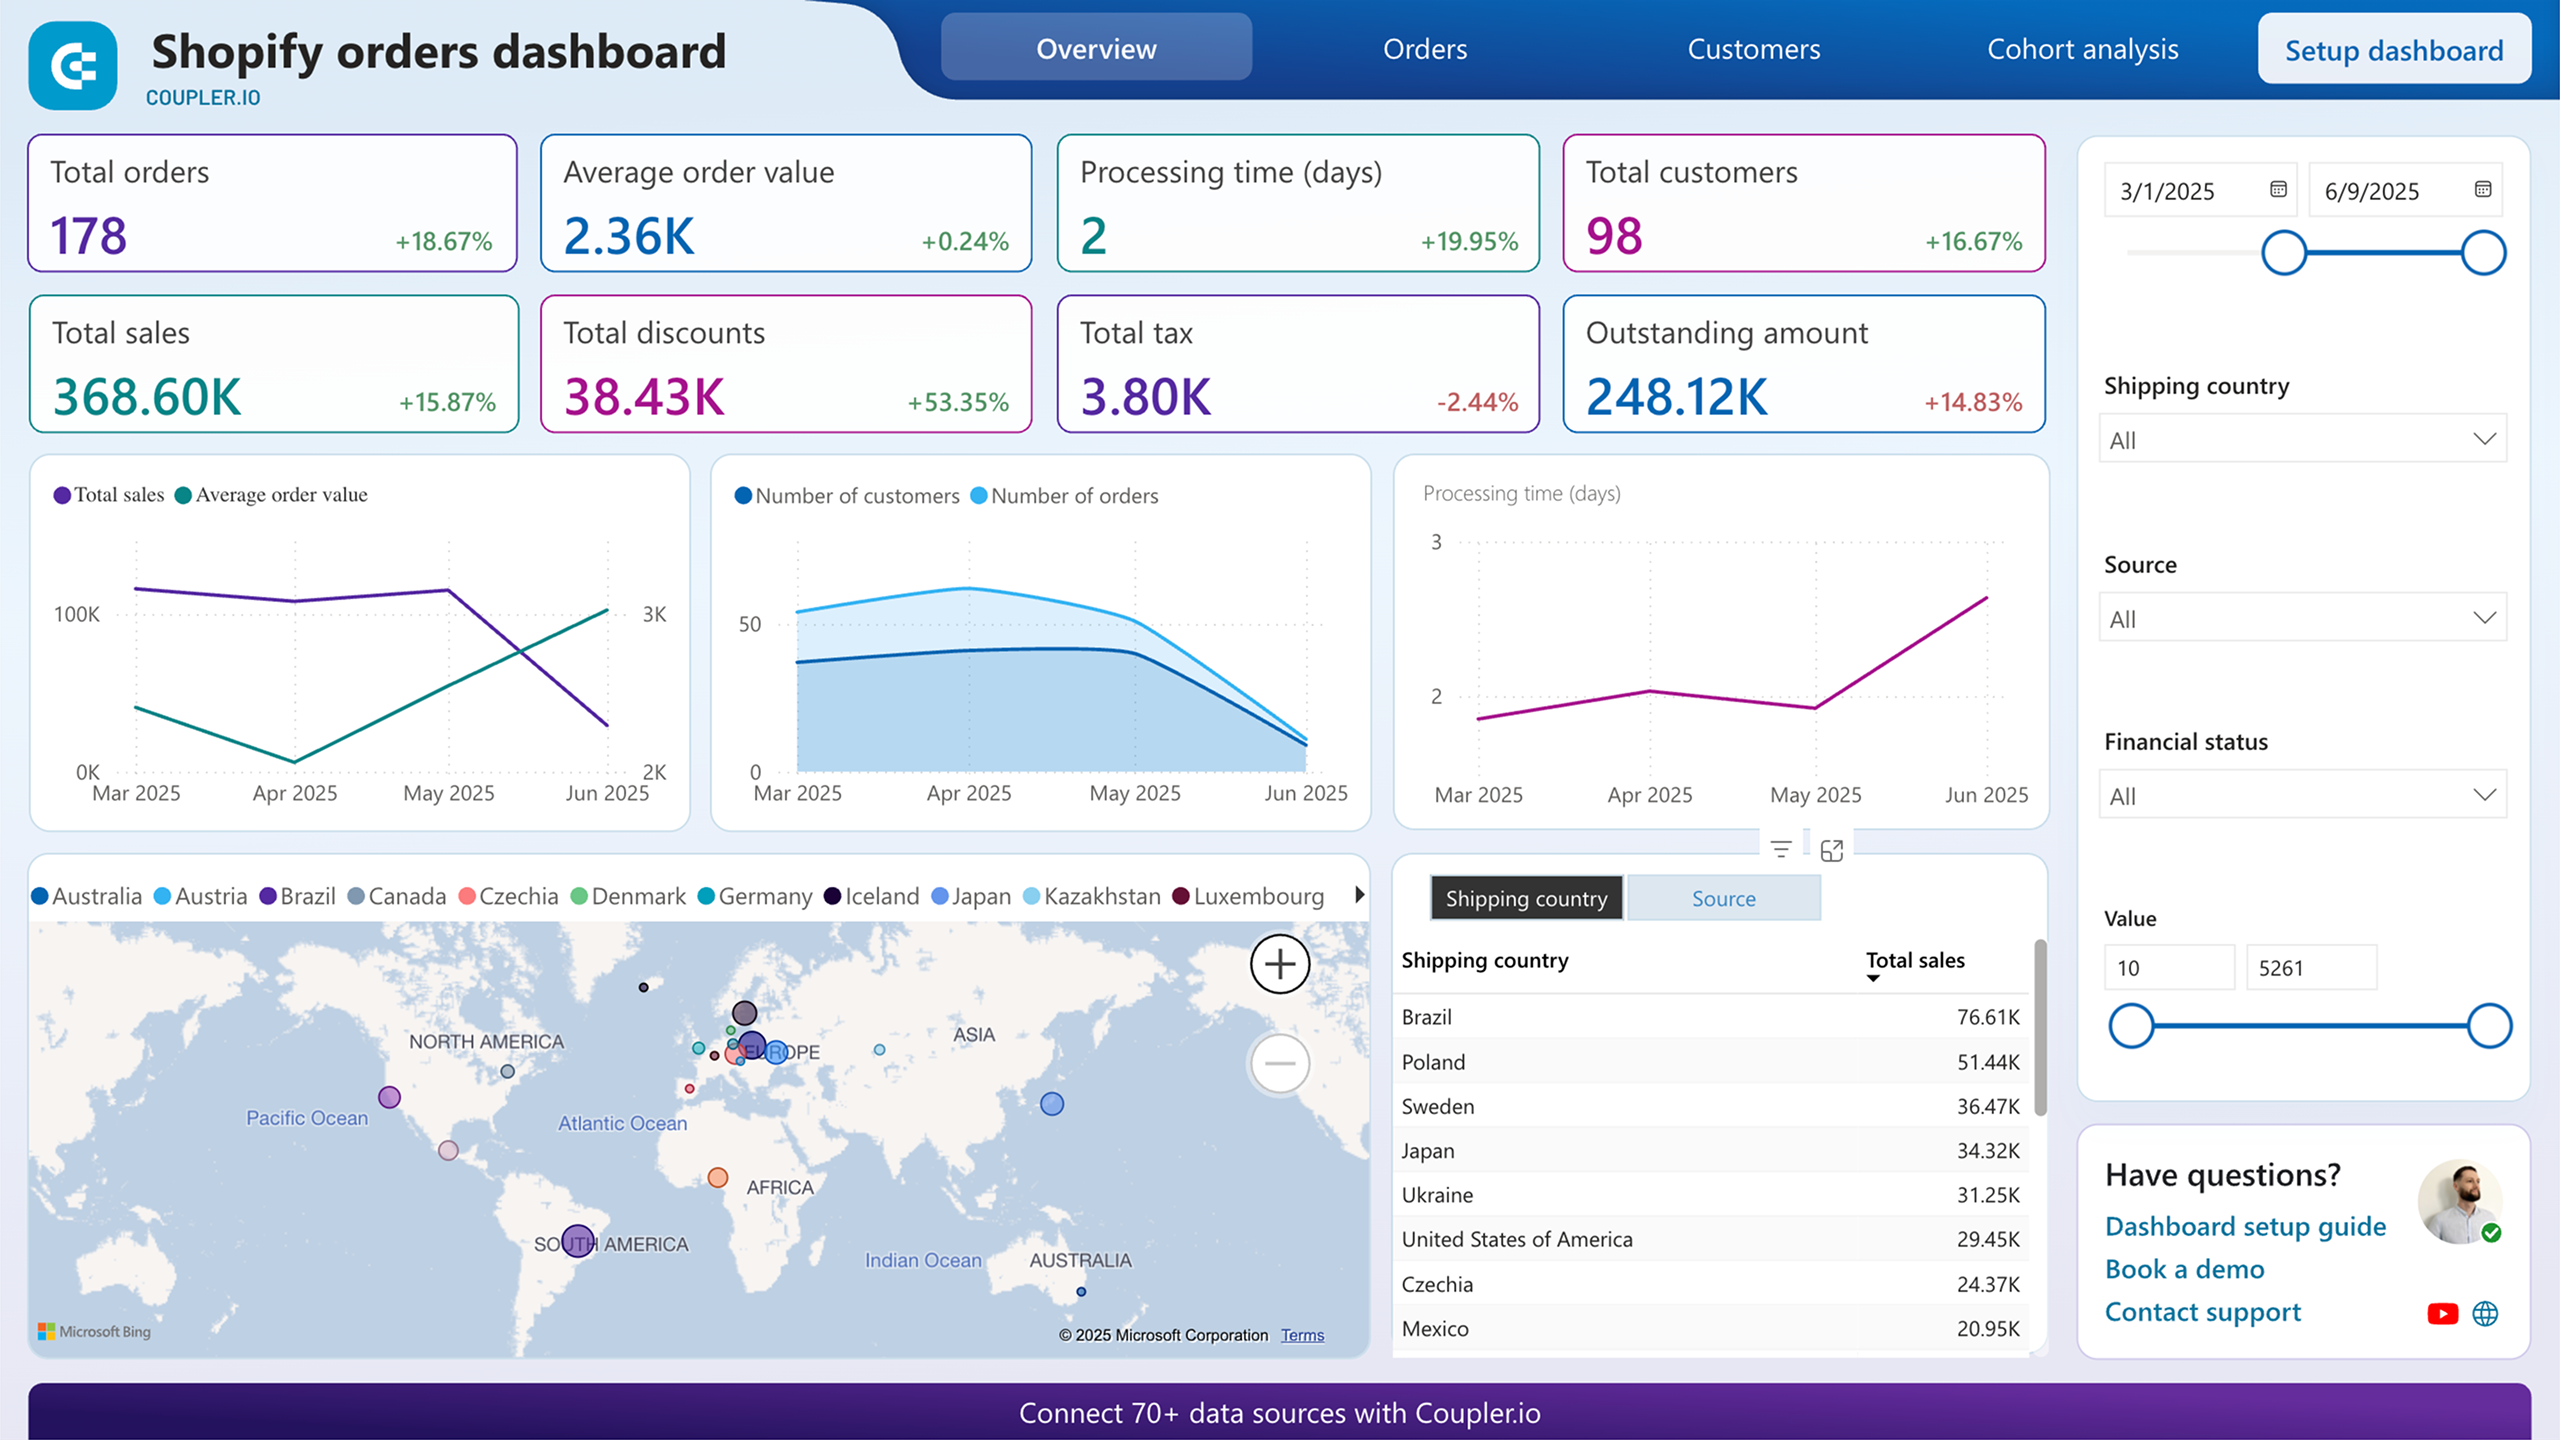
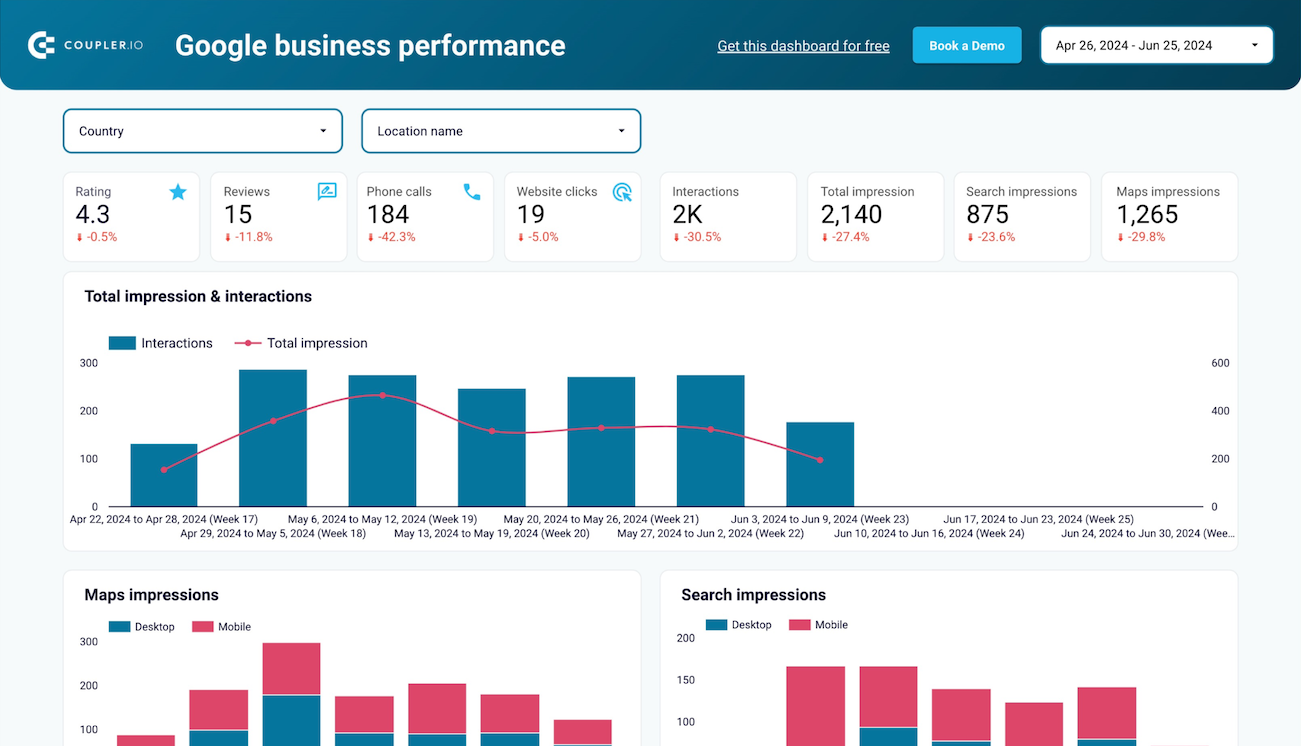
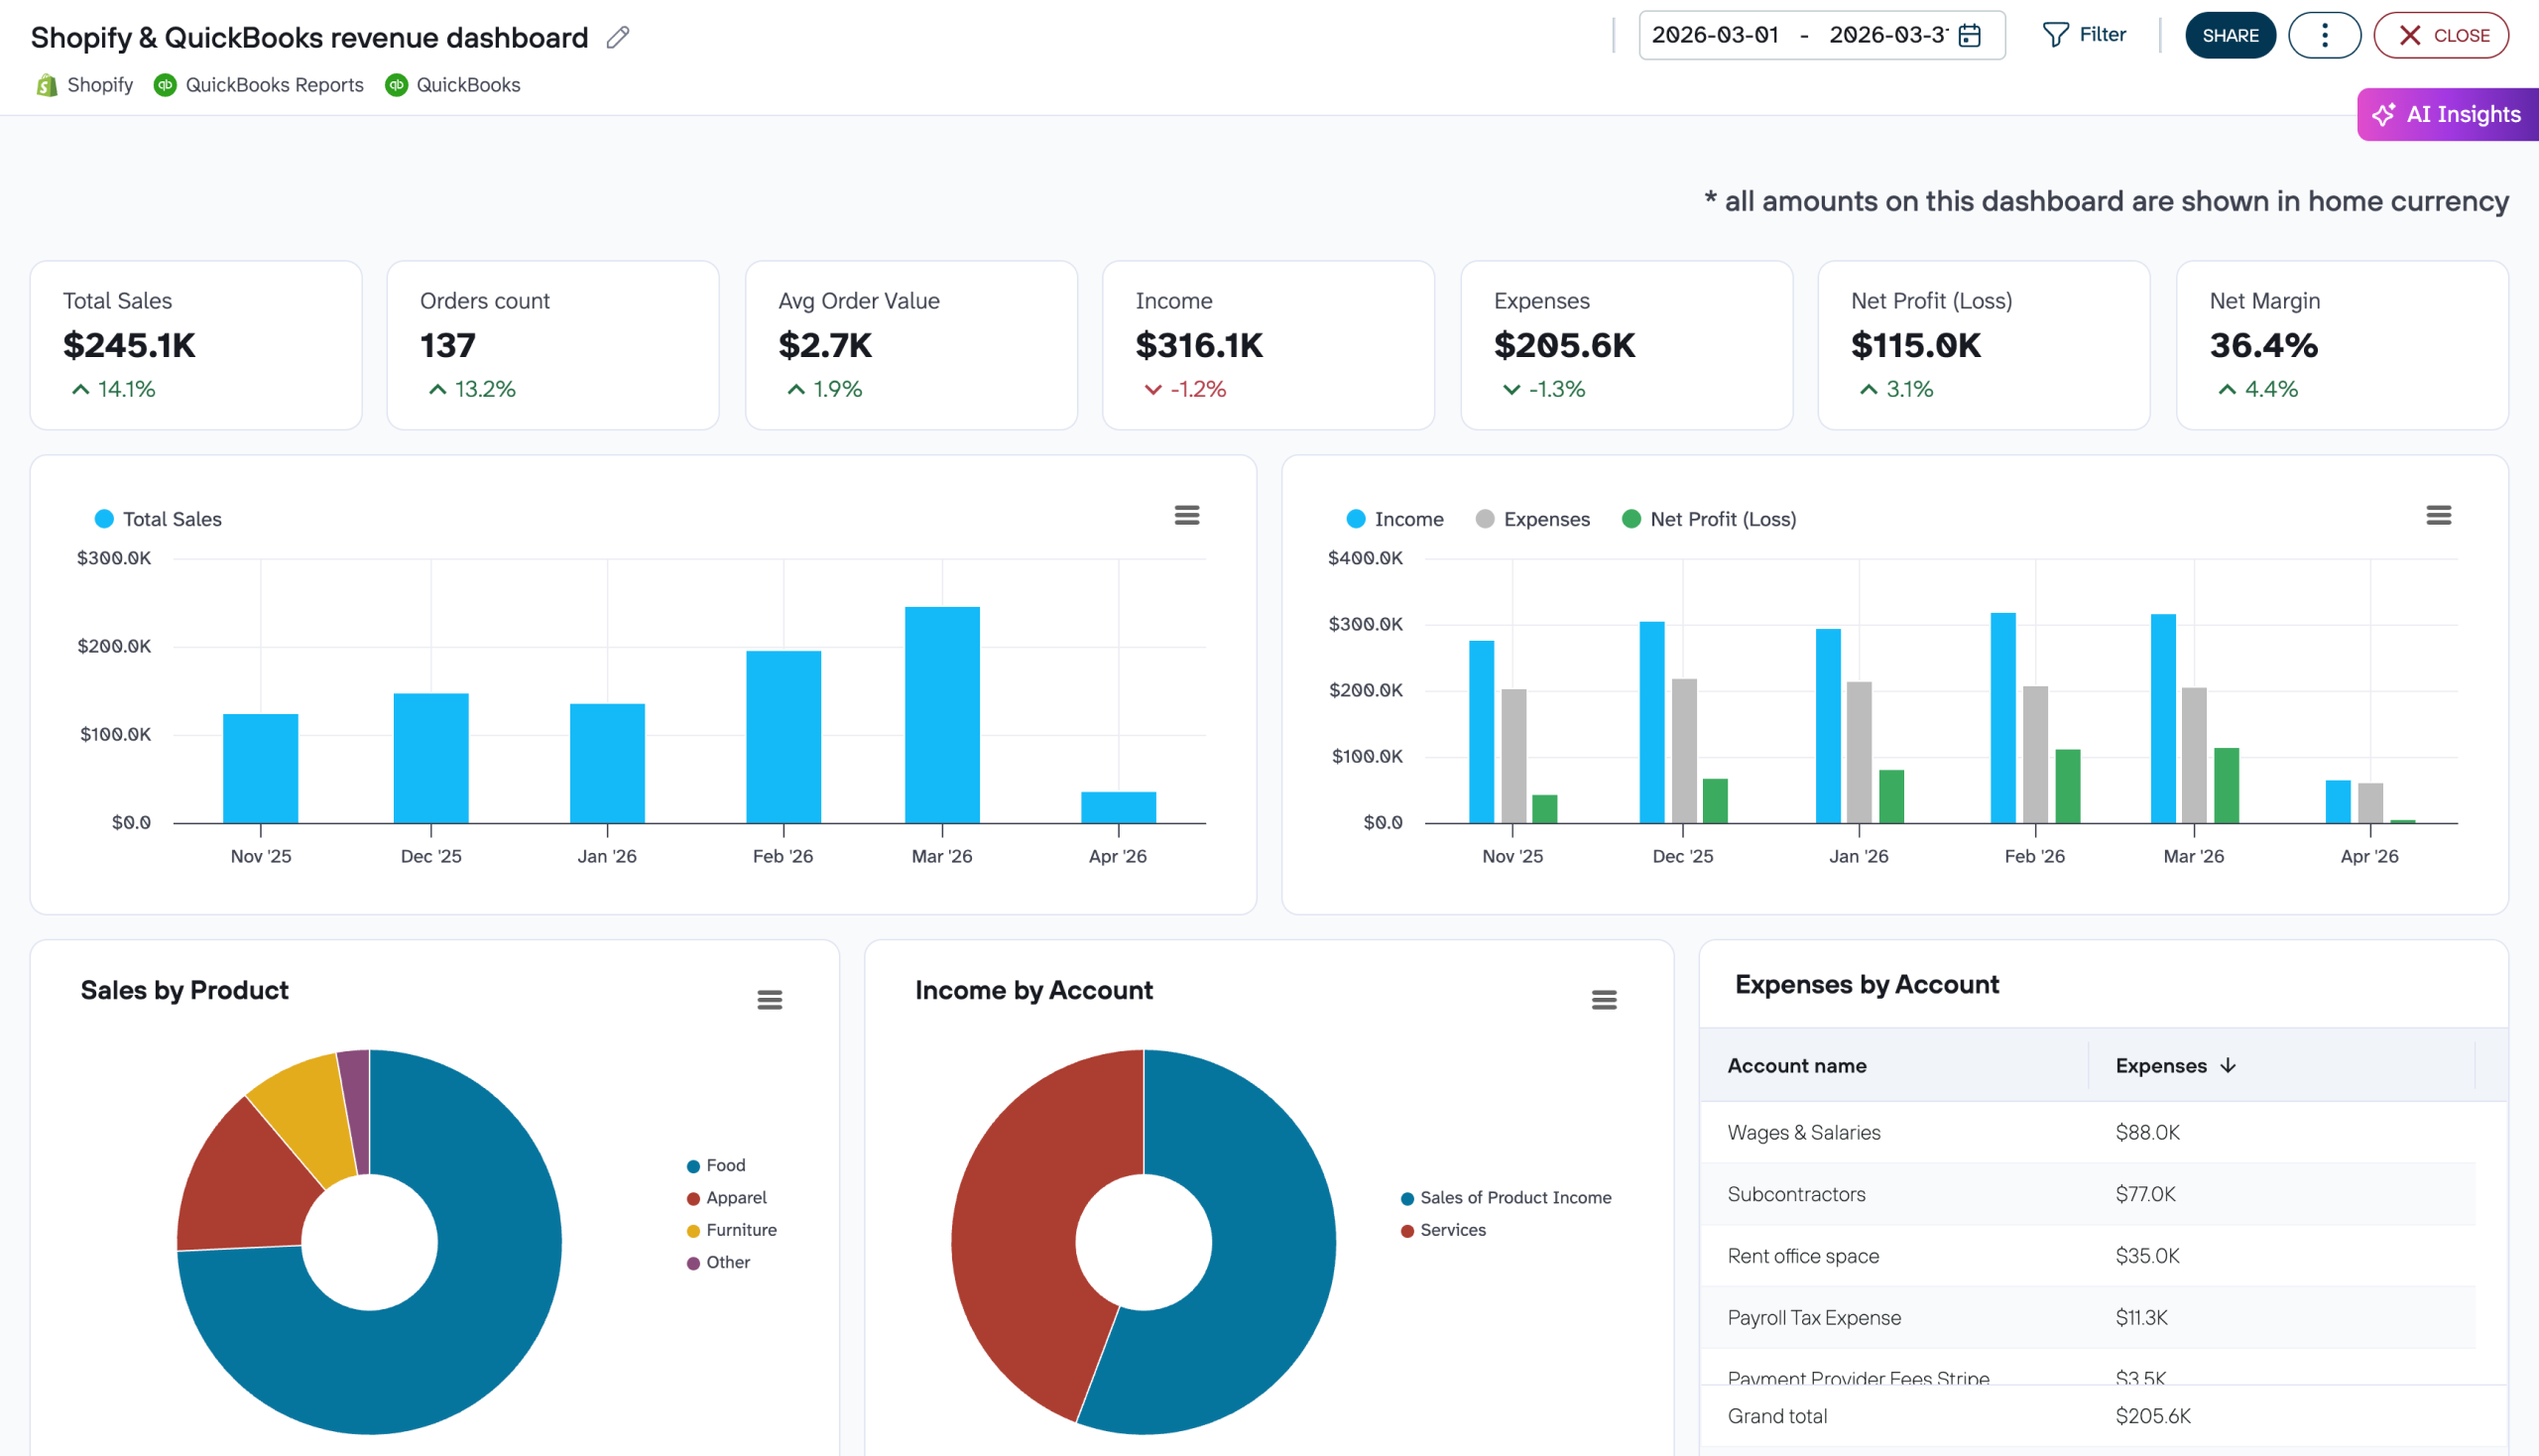
Location-based analytics provide crucial insights for expanding market reach and optimizing regional marketing strategies through comprehensive geographic data analysis. This report combines Shopify sales data with Google Business Profile insights to show revenue distribution across different countries and regions. The geographic analysis reveals which markets generate the highest order values, identifies shipping optimization opportunities, and highlights areas for potential business expansion. These insights enable data-driven decisions about international shipping policies, regional marketing investments, and local SEO strategies.
What insights you can get with the ecommerce KPI dashboard
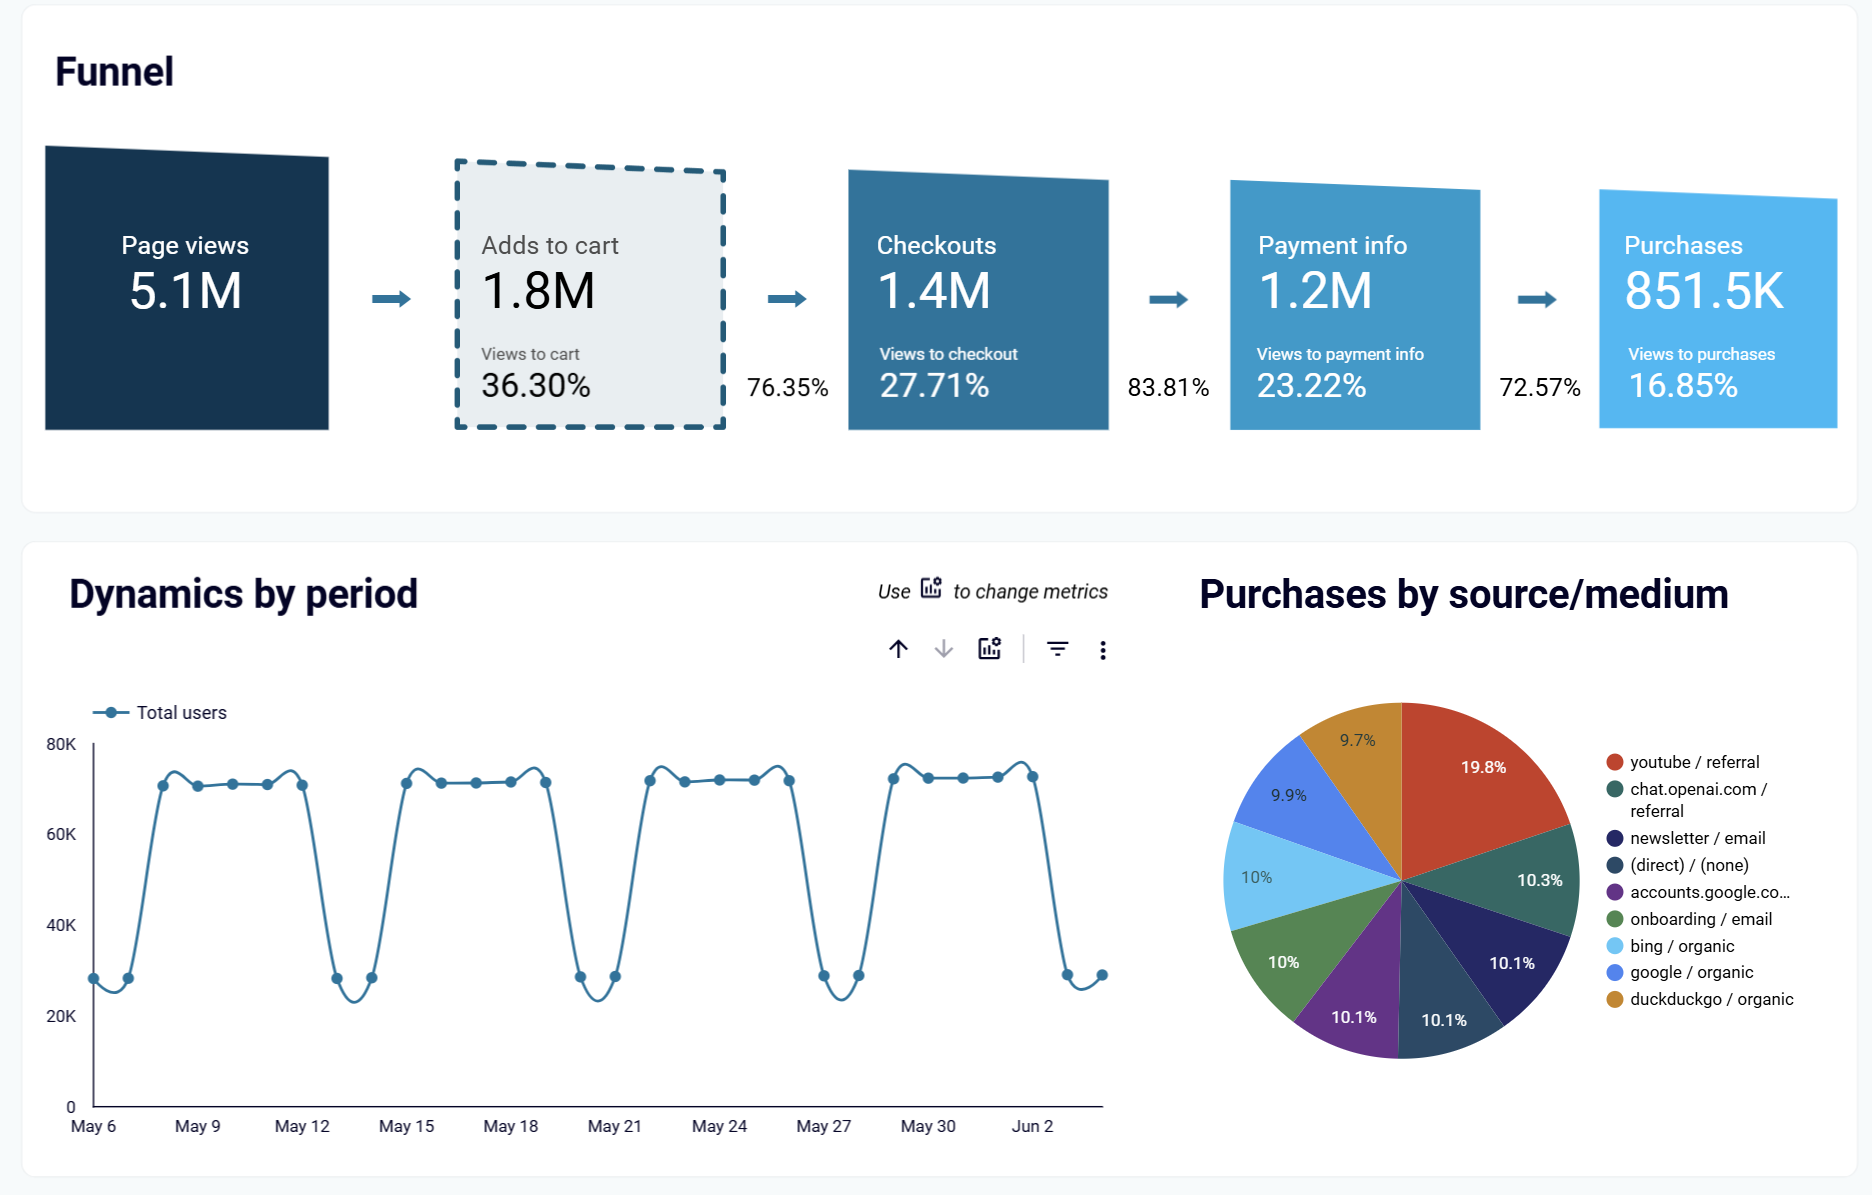
Track the complete customer acquisition journey across multiple advertising platforms and channels to understand which touchpoints drive actual revenue. The ecommerce KPI dashboard for Shopify reveals how ad impressions from Facebook, Google, and other platforms convert into website visitors and eventually paying customers. This comprehensive attribution analysis shows platform-specific ROI, identifies the most cost-effective channels, and enables strategic budget reallocation for maximum marketing impact.
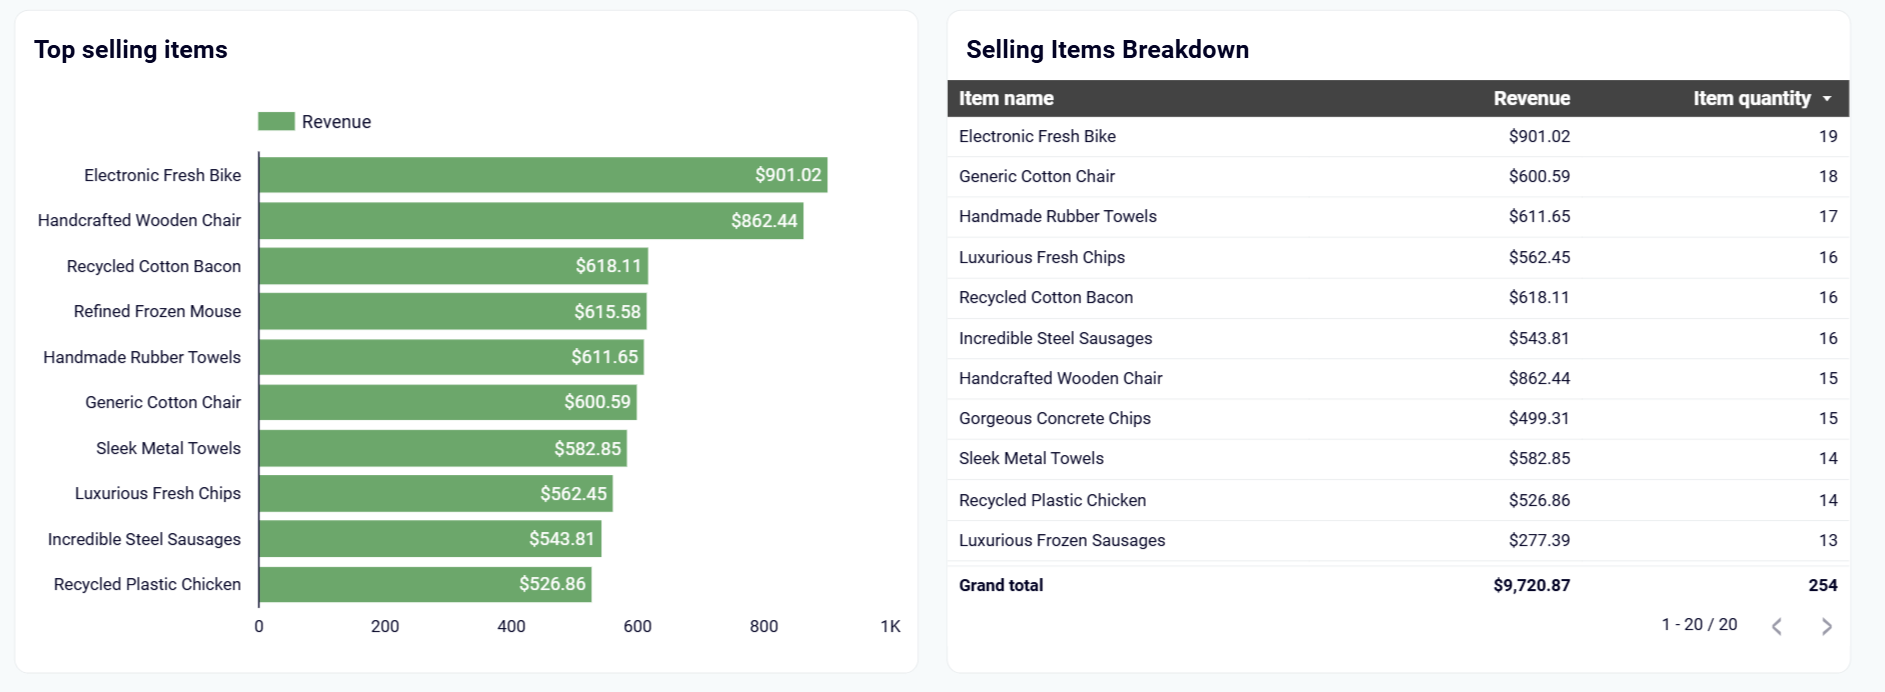
Identify your top-selling products by revenue and quantity while understanding which items generate the most profit from different marketing channels. The integrated analysis from our ecommerce analytics dashboard template shows which products perform best through email campaigns versus organic traffic. This detailed product breakdown helps optimize inventory management, prioritize marketing efforts for high-performing items, and identify opportunities to promote underperforming products through targeted campaigns.
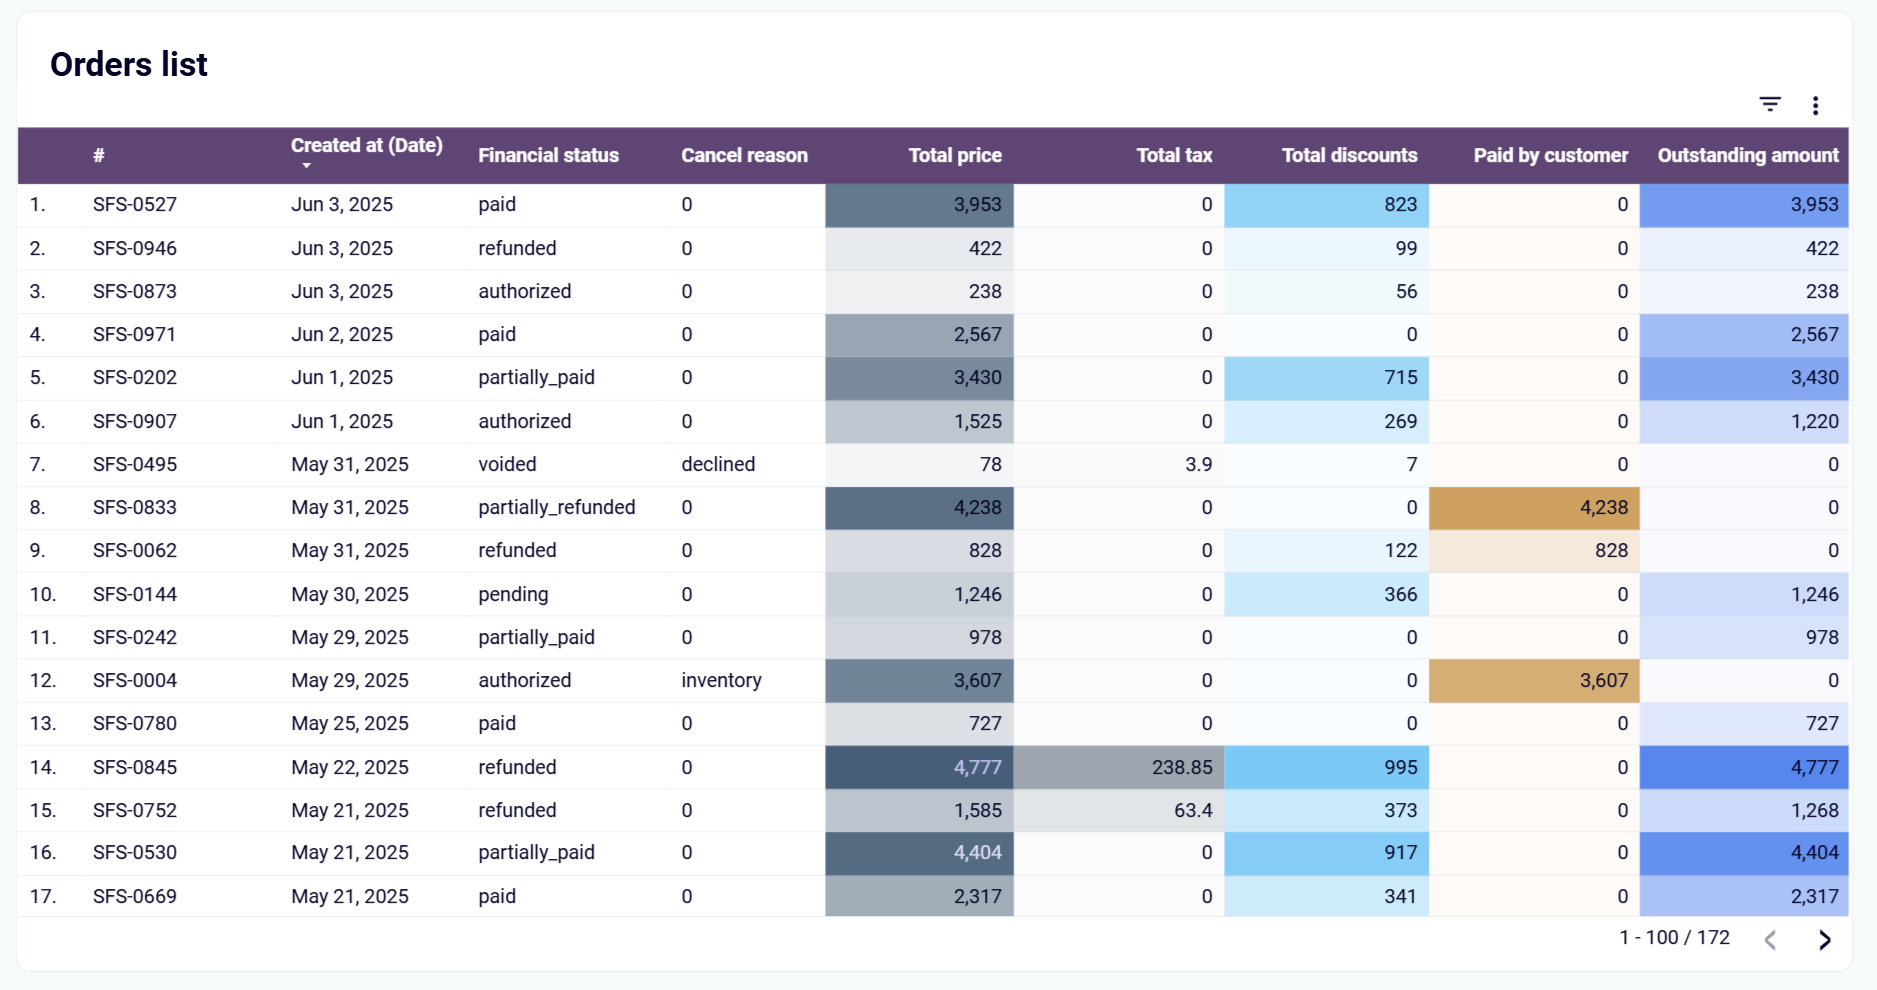
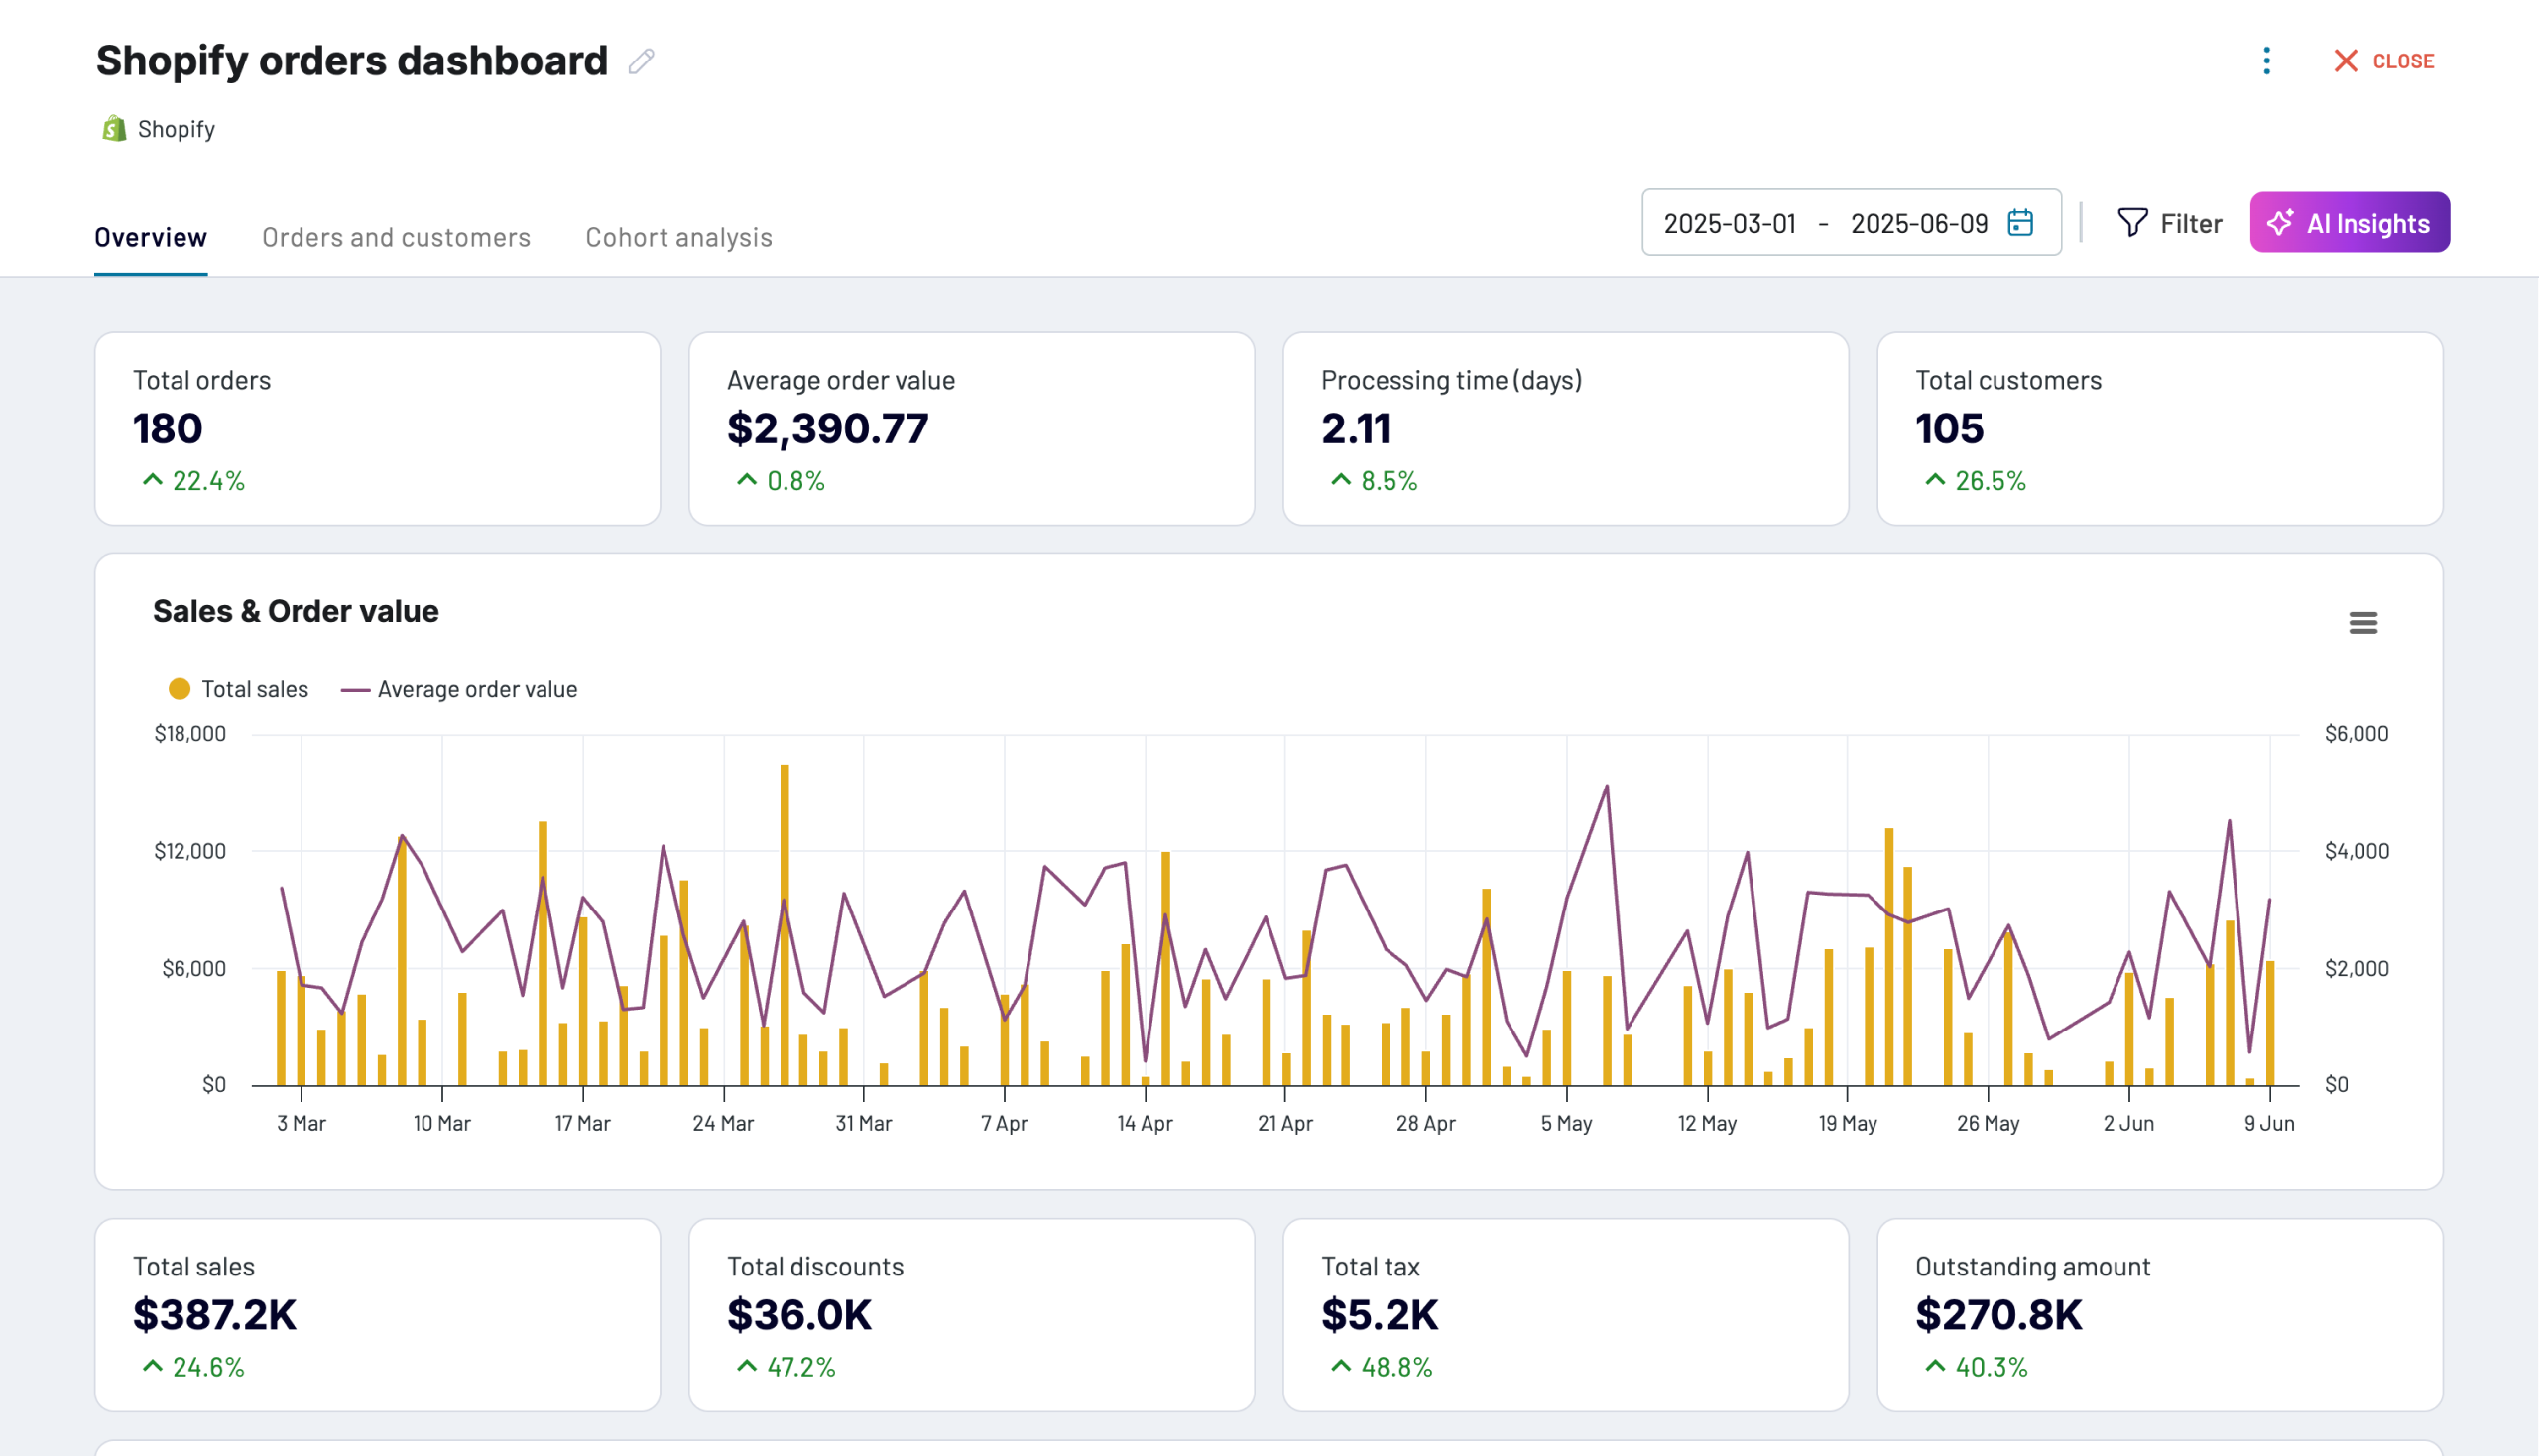
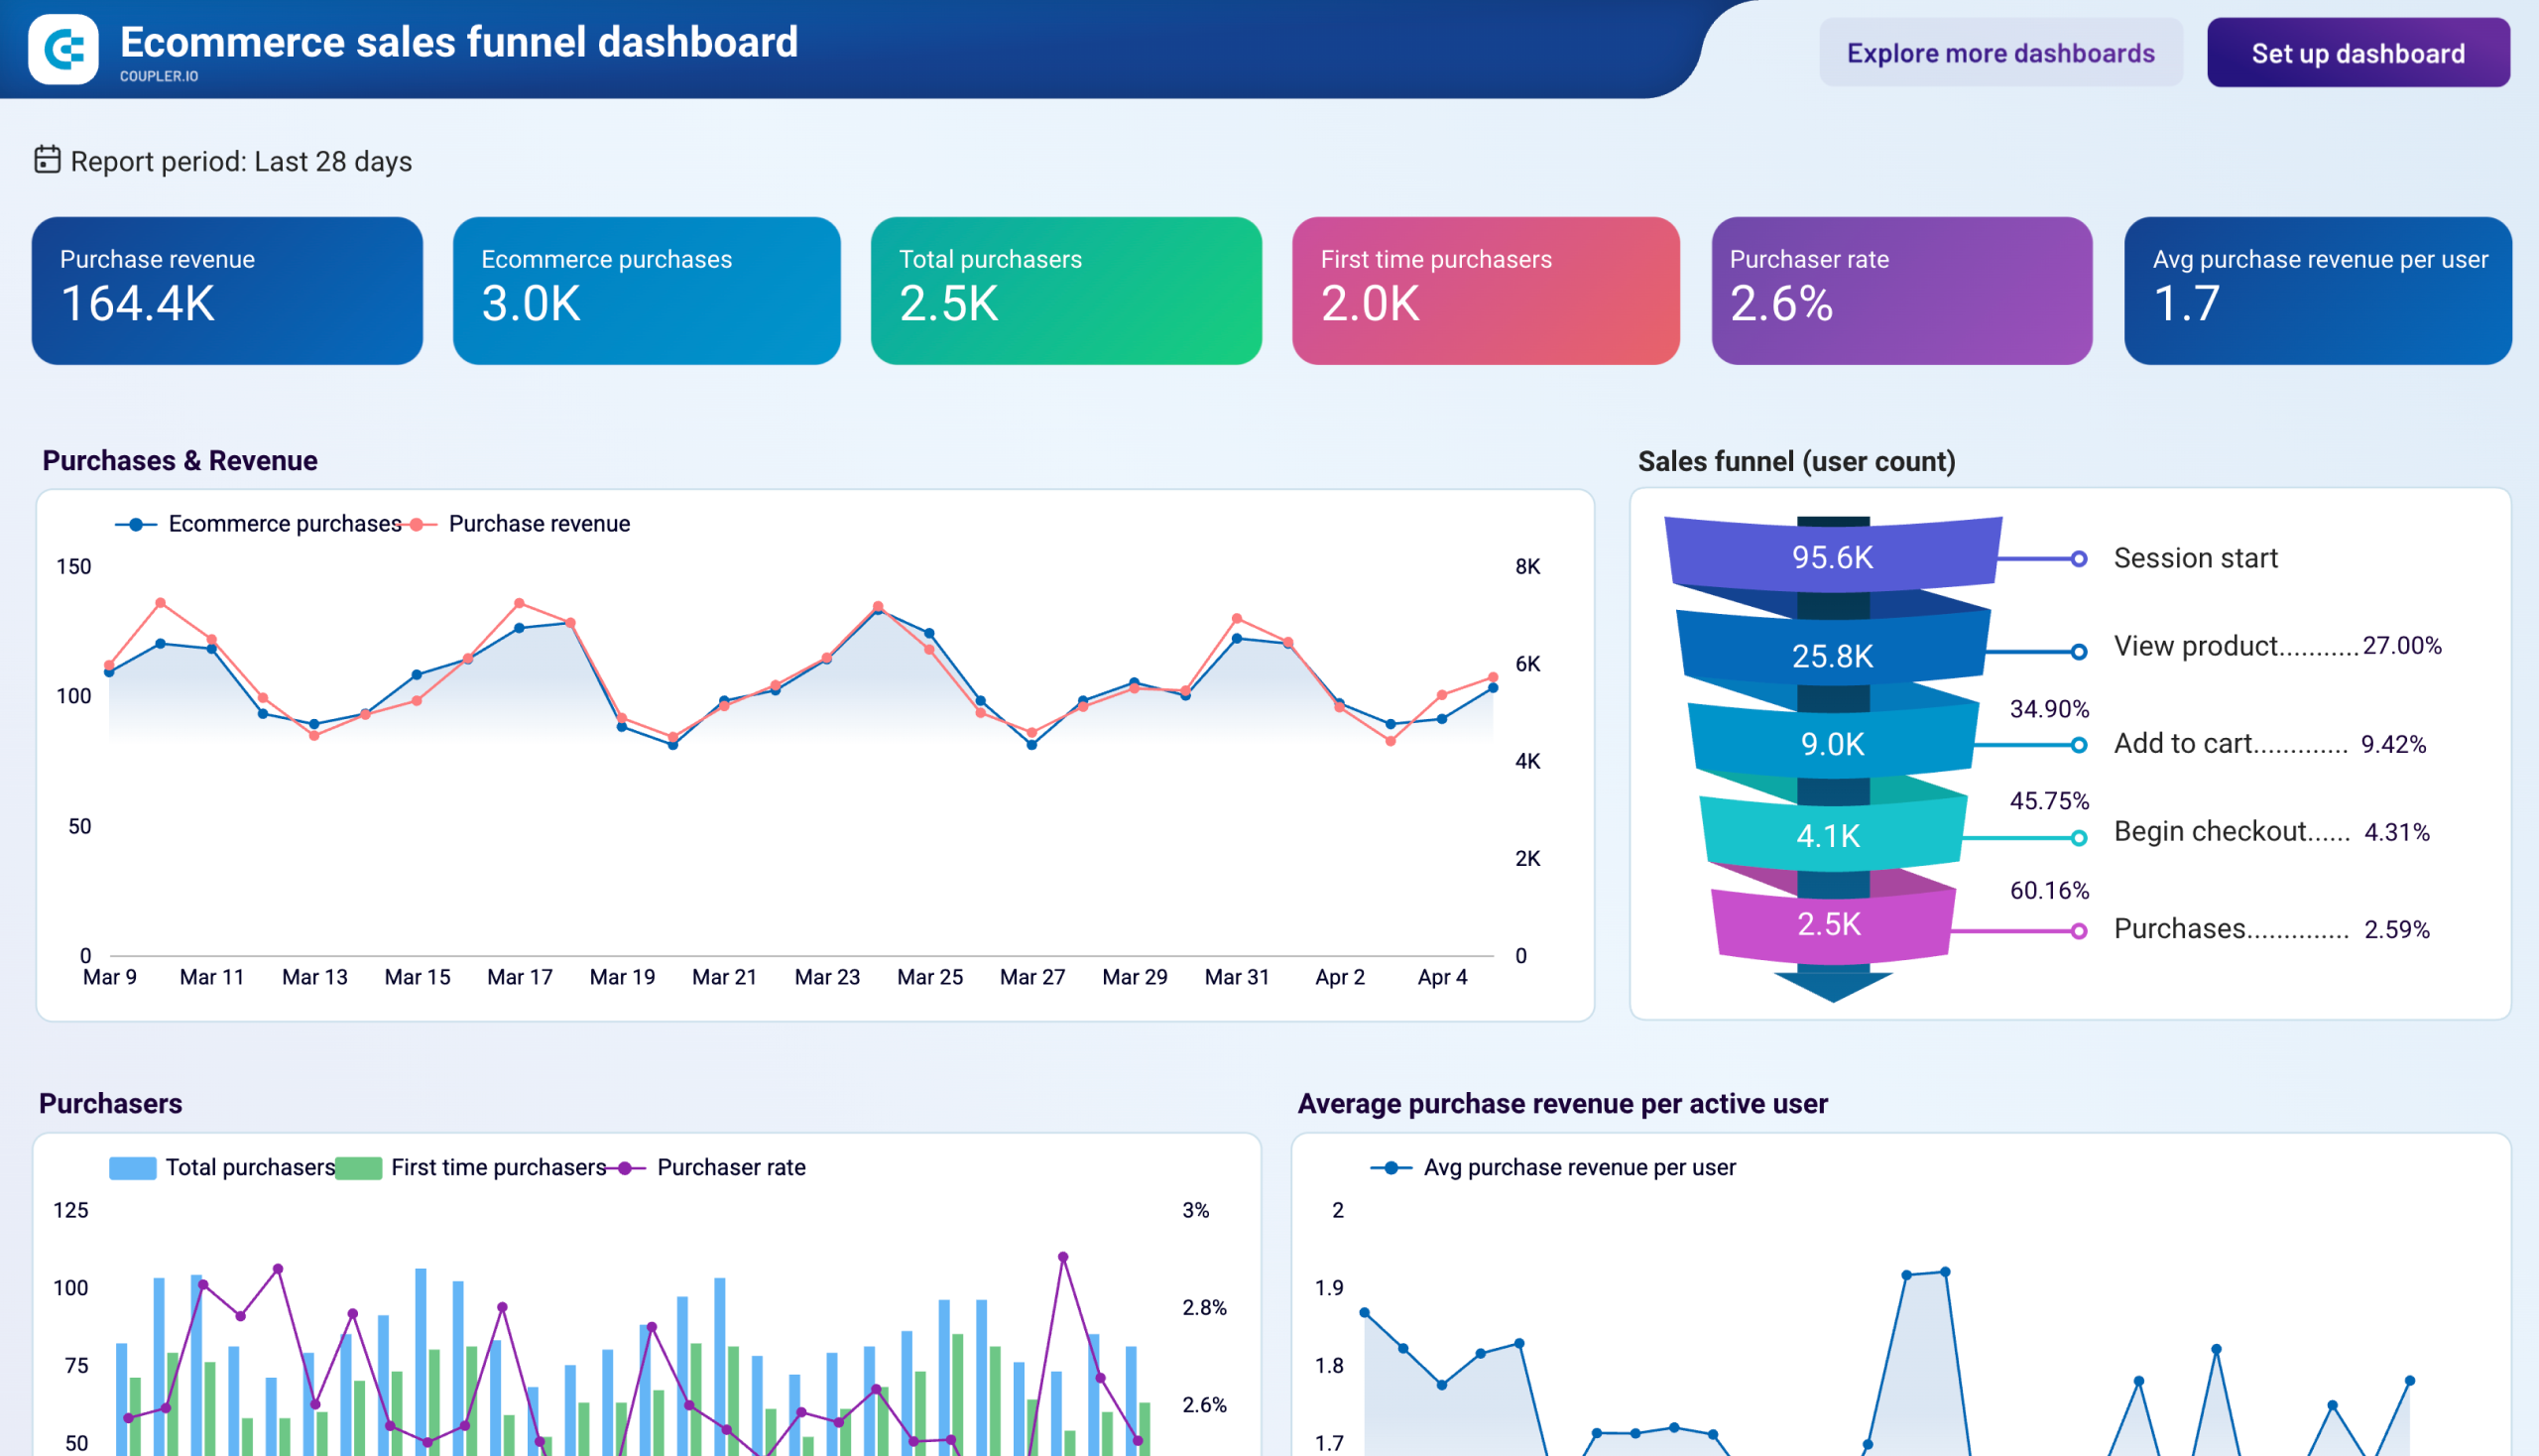
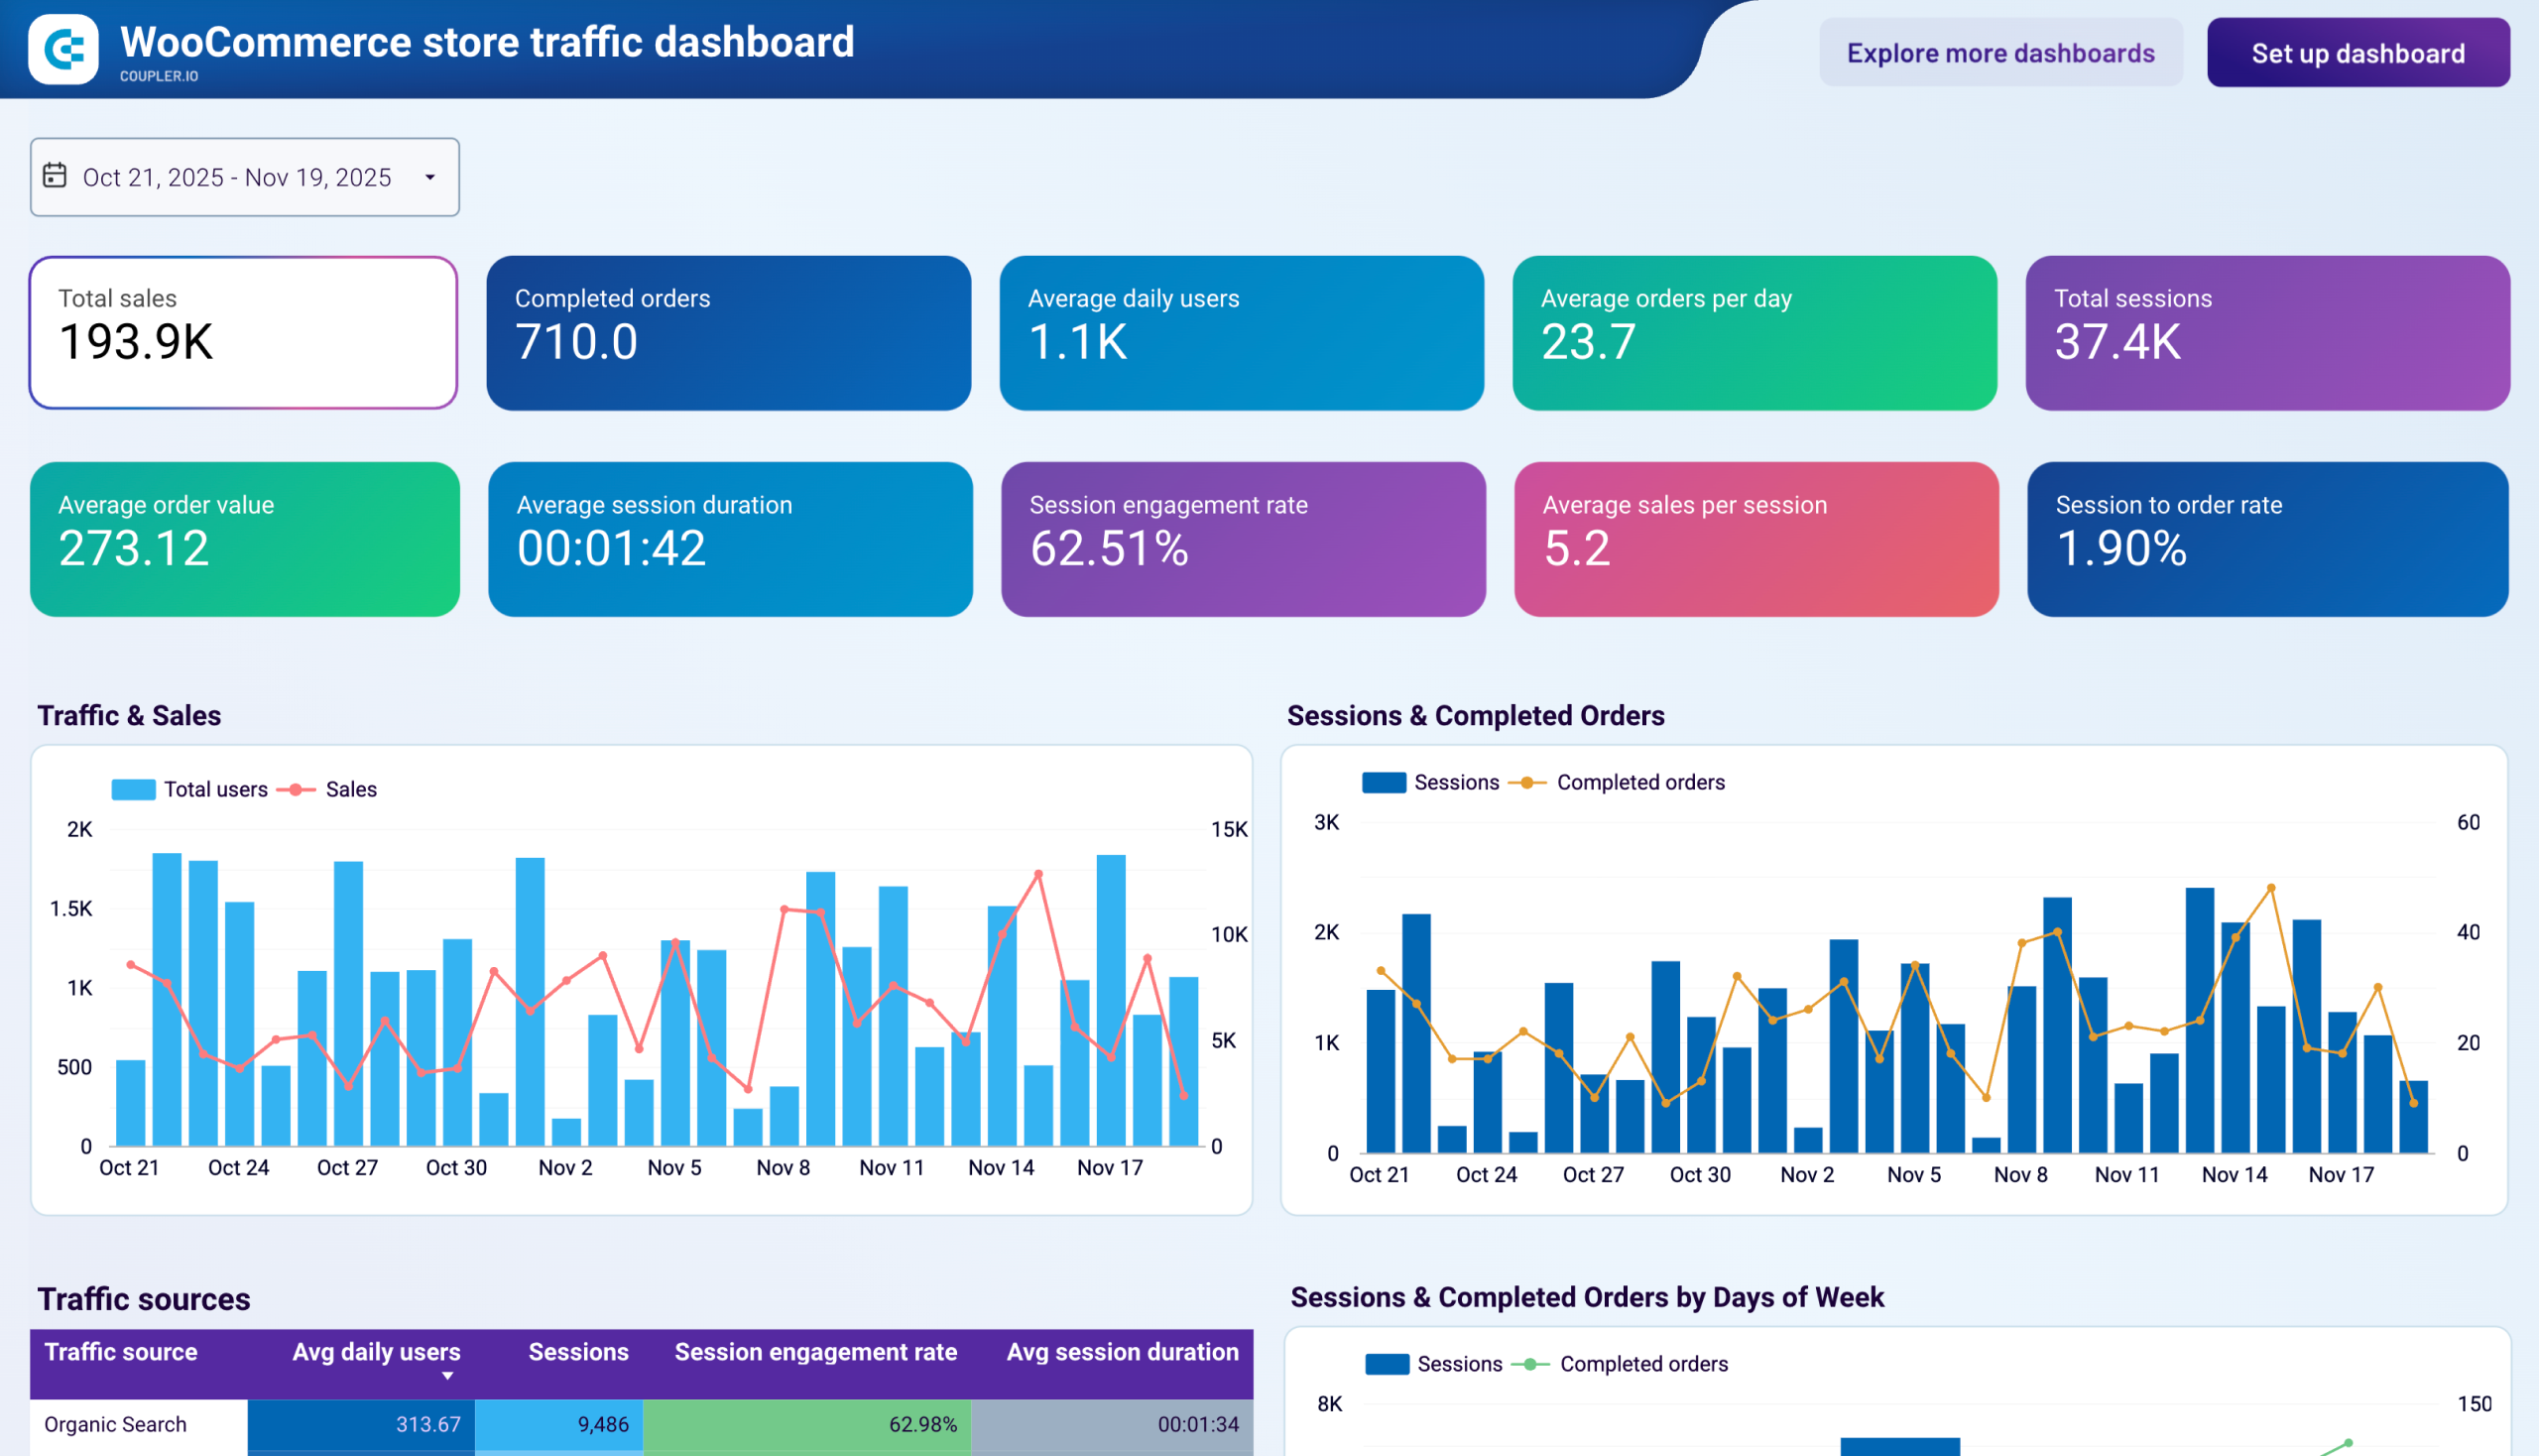
Monitor the complete order lifecycle from creation to fulfillment with detailed status breakdowns, including paid, pending, refunded, and partially paid transactions. Our ecommerce KPI dashboard template provides comprehensive visibility into order financial status, cancellation reasons, and payment processing issues that affect cash flow. This detailed order tracking helps identify patterns in payment problems, reduce refund rates, and optimize the checkout process to minimize abandoned or problematic orders.
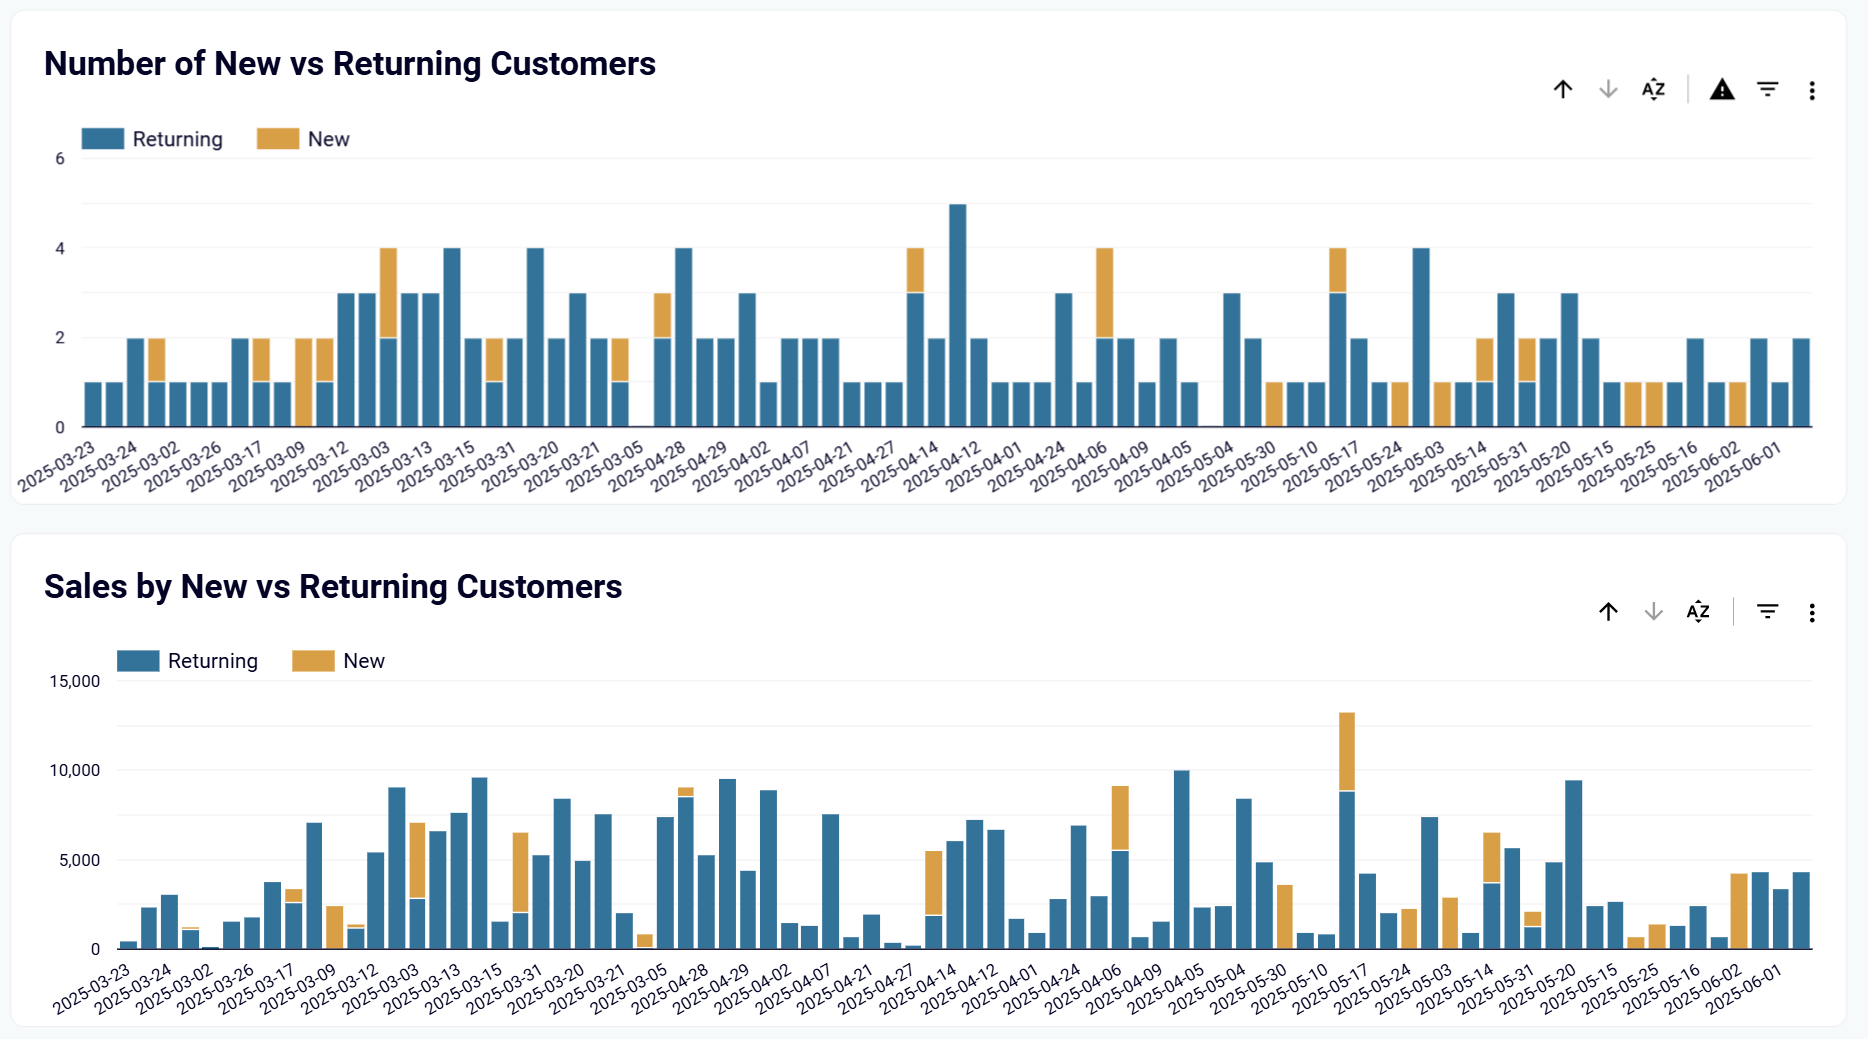
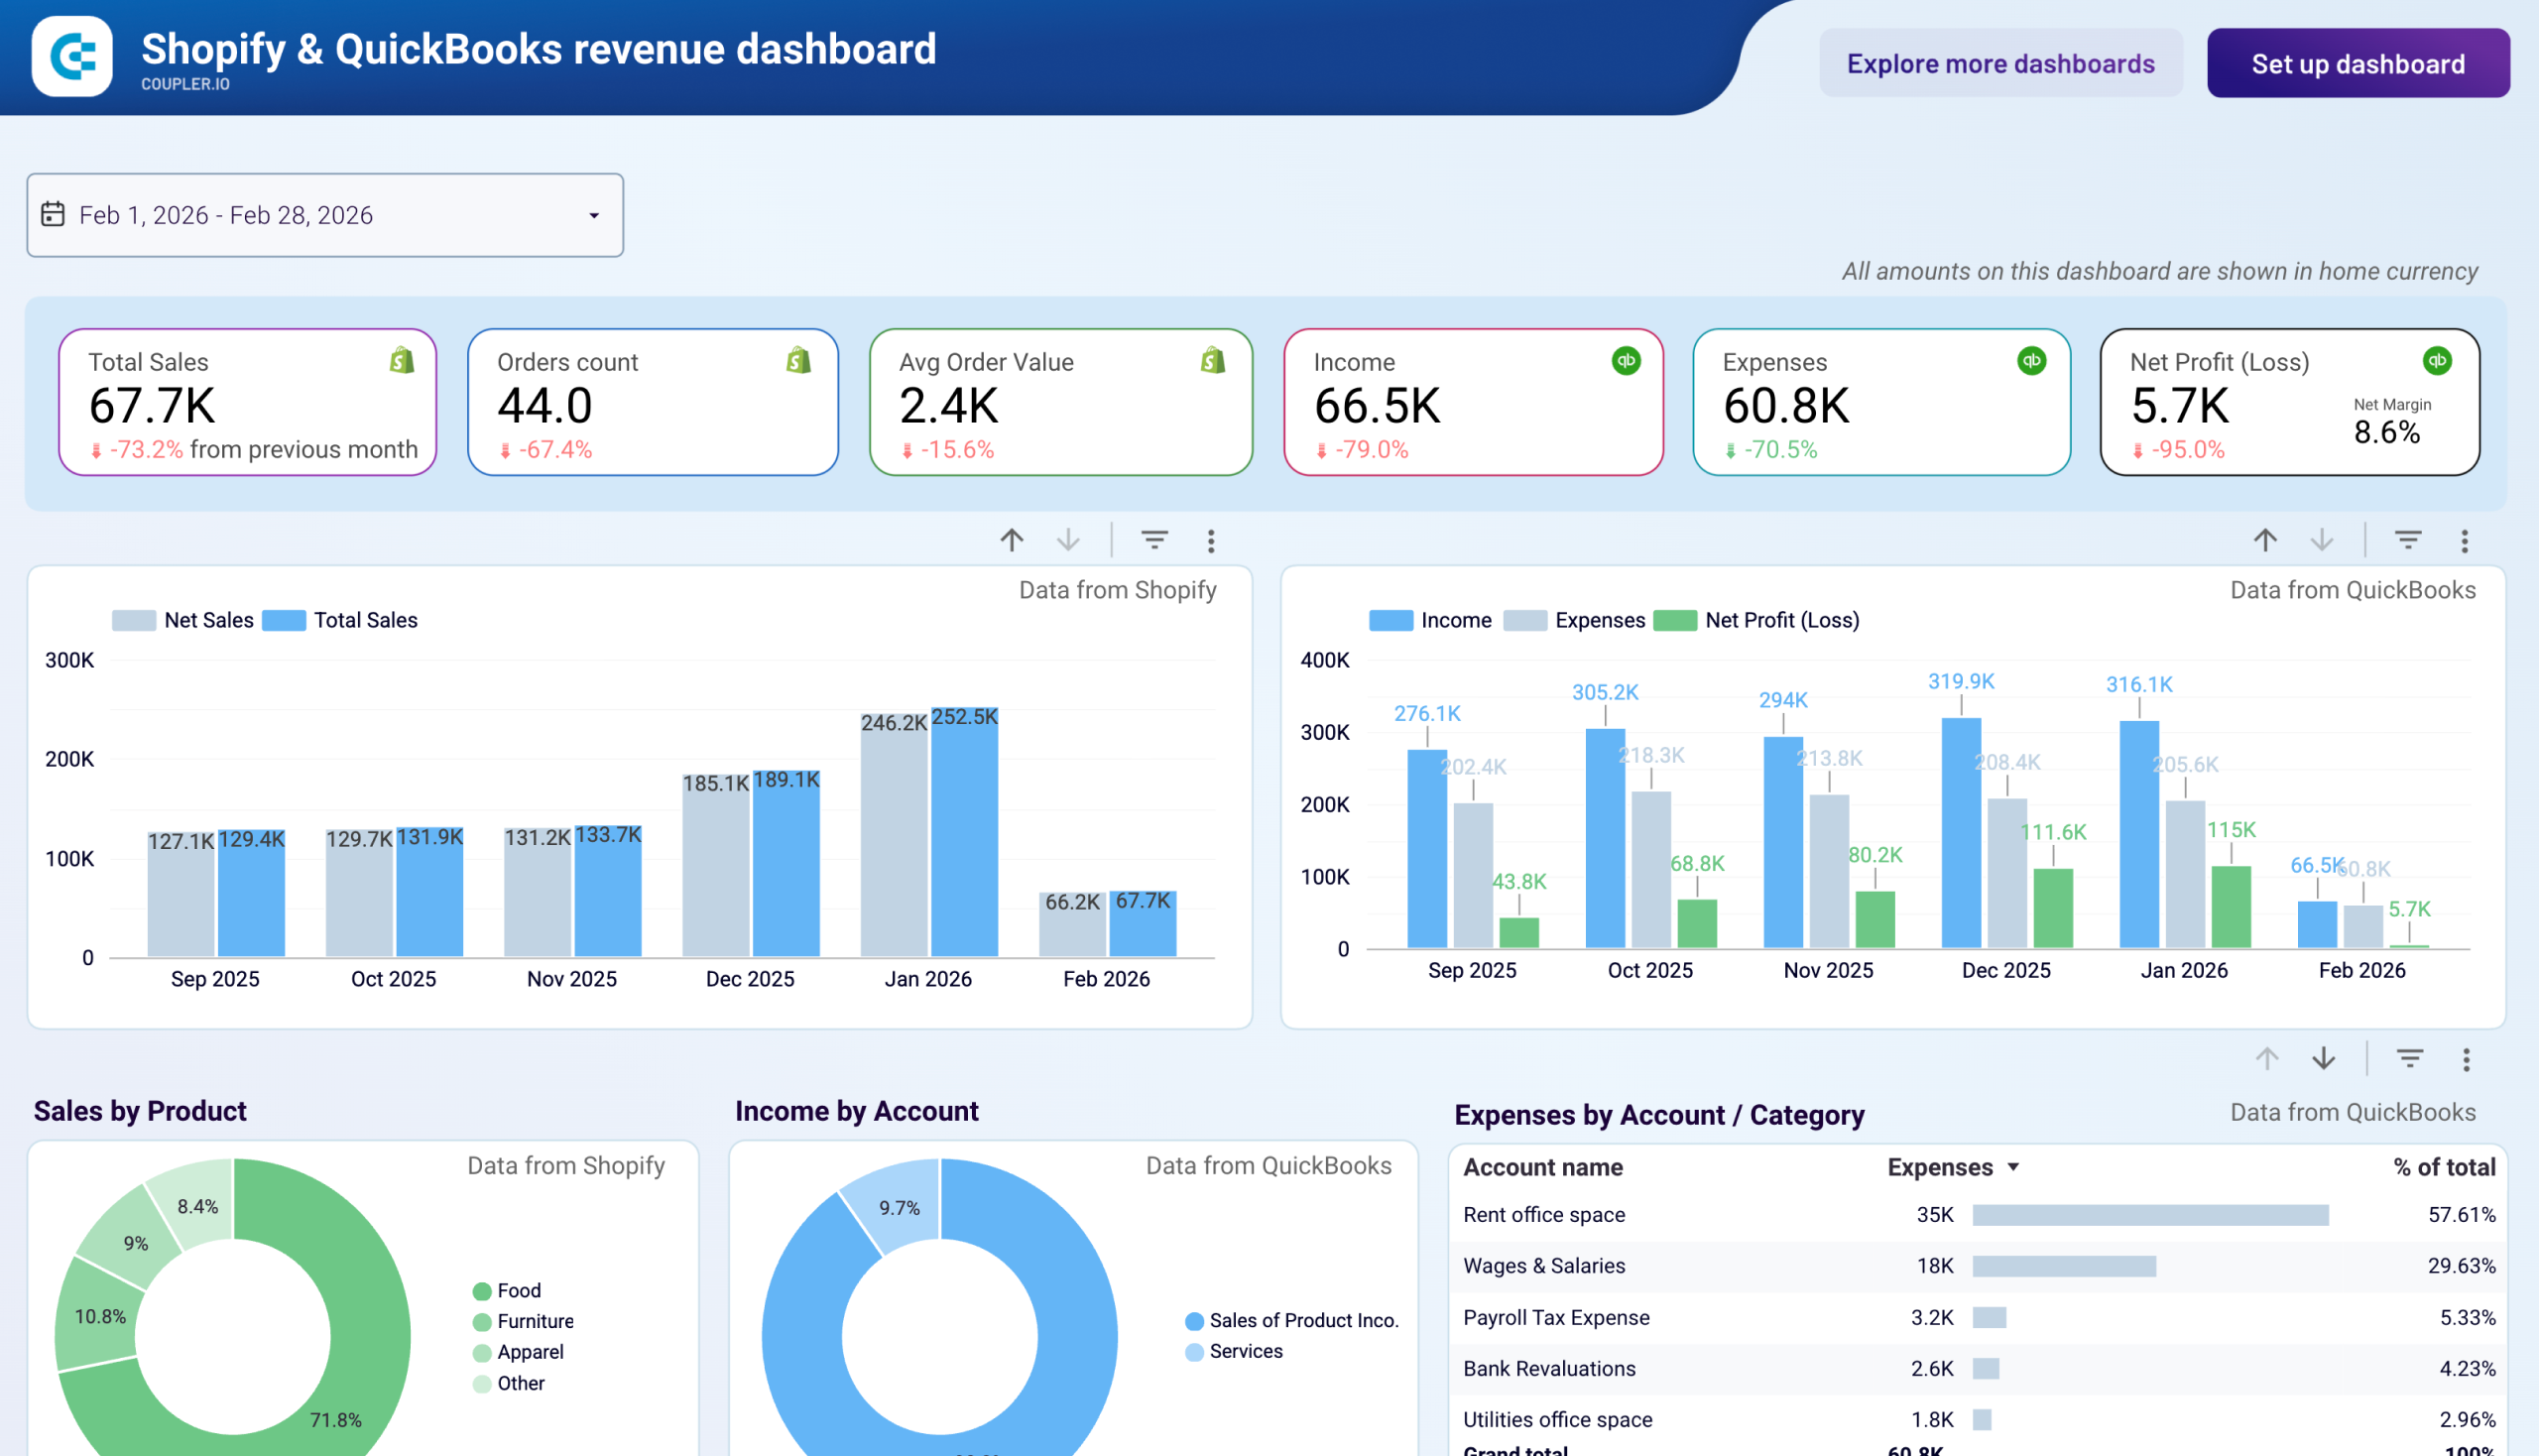
Analyze the balance between new customer acquisition and returning customer retention through detailed segmentation of purchase patterns and revenue contribution. The Shopify dashboard reveals customer behavior trends by comparing new versus returning customer metrics over time, showing both transaction volume and sales value for each segment. This segmentation analysis helps optimize marketing spend allocation between acquisition campaigns and retention strategies while identifying periods when customer loyalty programs or new customer incentives may be most effective.
How to create an ecommerce analytics & KPI dashboard?

Metrics you can track with an ecommerce analytics & KPI dashboard template
More Ecommerce analytics & KPI Dashboards
Request custom dashboard
From building custom dashboards to setting up data analytics from scratch, we're here to help you succeed. Contact us to discuss your case and possible solutions
Contact us