Store performance dashboard examples and reporting templates
Optimize your retail operations with automated store performance dashboard templates that integrate data from Shopify, Google Business Profile, and email marketing platforms. Track sales metrics, manage inventory across locations, analyze customer interactions, and measure marketing effectiveness with real-time insights that drive better business decisions.
Store performance dashboard examples for every need


about your case. It doesn't cost you a penny 😉
What is a store performance dashboard?
Store performance dashboards transform scattered retail data into actionable insights that help store owners track revenue trends, optimize inventory levels, understand customer behavior, and measure marketing campaign effectiveness. Through automated data integration via Coupler.io, store performance dashboard templates eliminate manual reporting while providing real-time visibility into all aspects of retail operations, from product sales and stock management to customer acquisition and retention strategies.

Choose your white label store performance dashboard template to kick off
What reports should be included in store performance dashboards?
A comprehensive store performance dashboard requires strategic integration of multiple reporting components that cover all critical aspects of retail operations. Based on our analysis of successful retail analytics implementations, we recommend incorporating these four essential report categories that provide complete visibility into your store's performance across sales, inventory, customer engagement, and marketing channels.
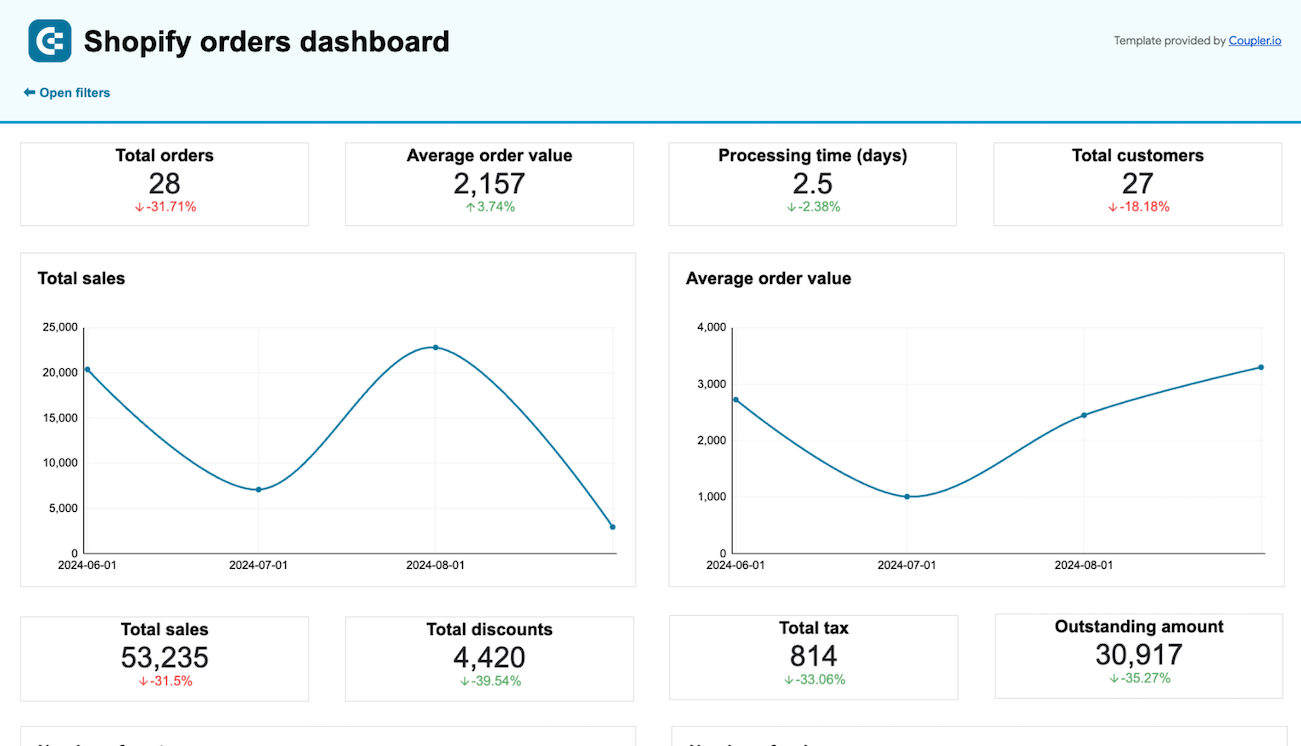
The sales report serves as the foundation of retail analytics, delivering geographic and product-based analysis that enables strategic decision-making. This report tracks revenue trends across multiple time periods while breaking down performance by individual products, customer segments, and geographic regions. It includes order volume analysis, average order value tracking, and customer acquisition patterns that help identify your most profitable markets and products. The report also monitors payment status and refund patterns, providing essential cash flow insights that inform inventory purchasing and operational planning decisions for sustained business growth.
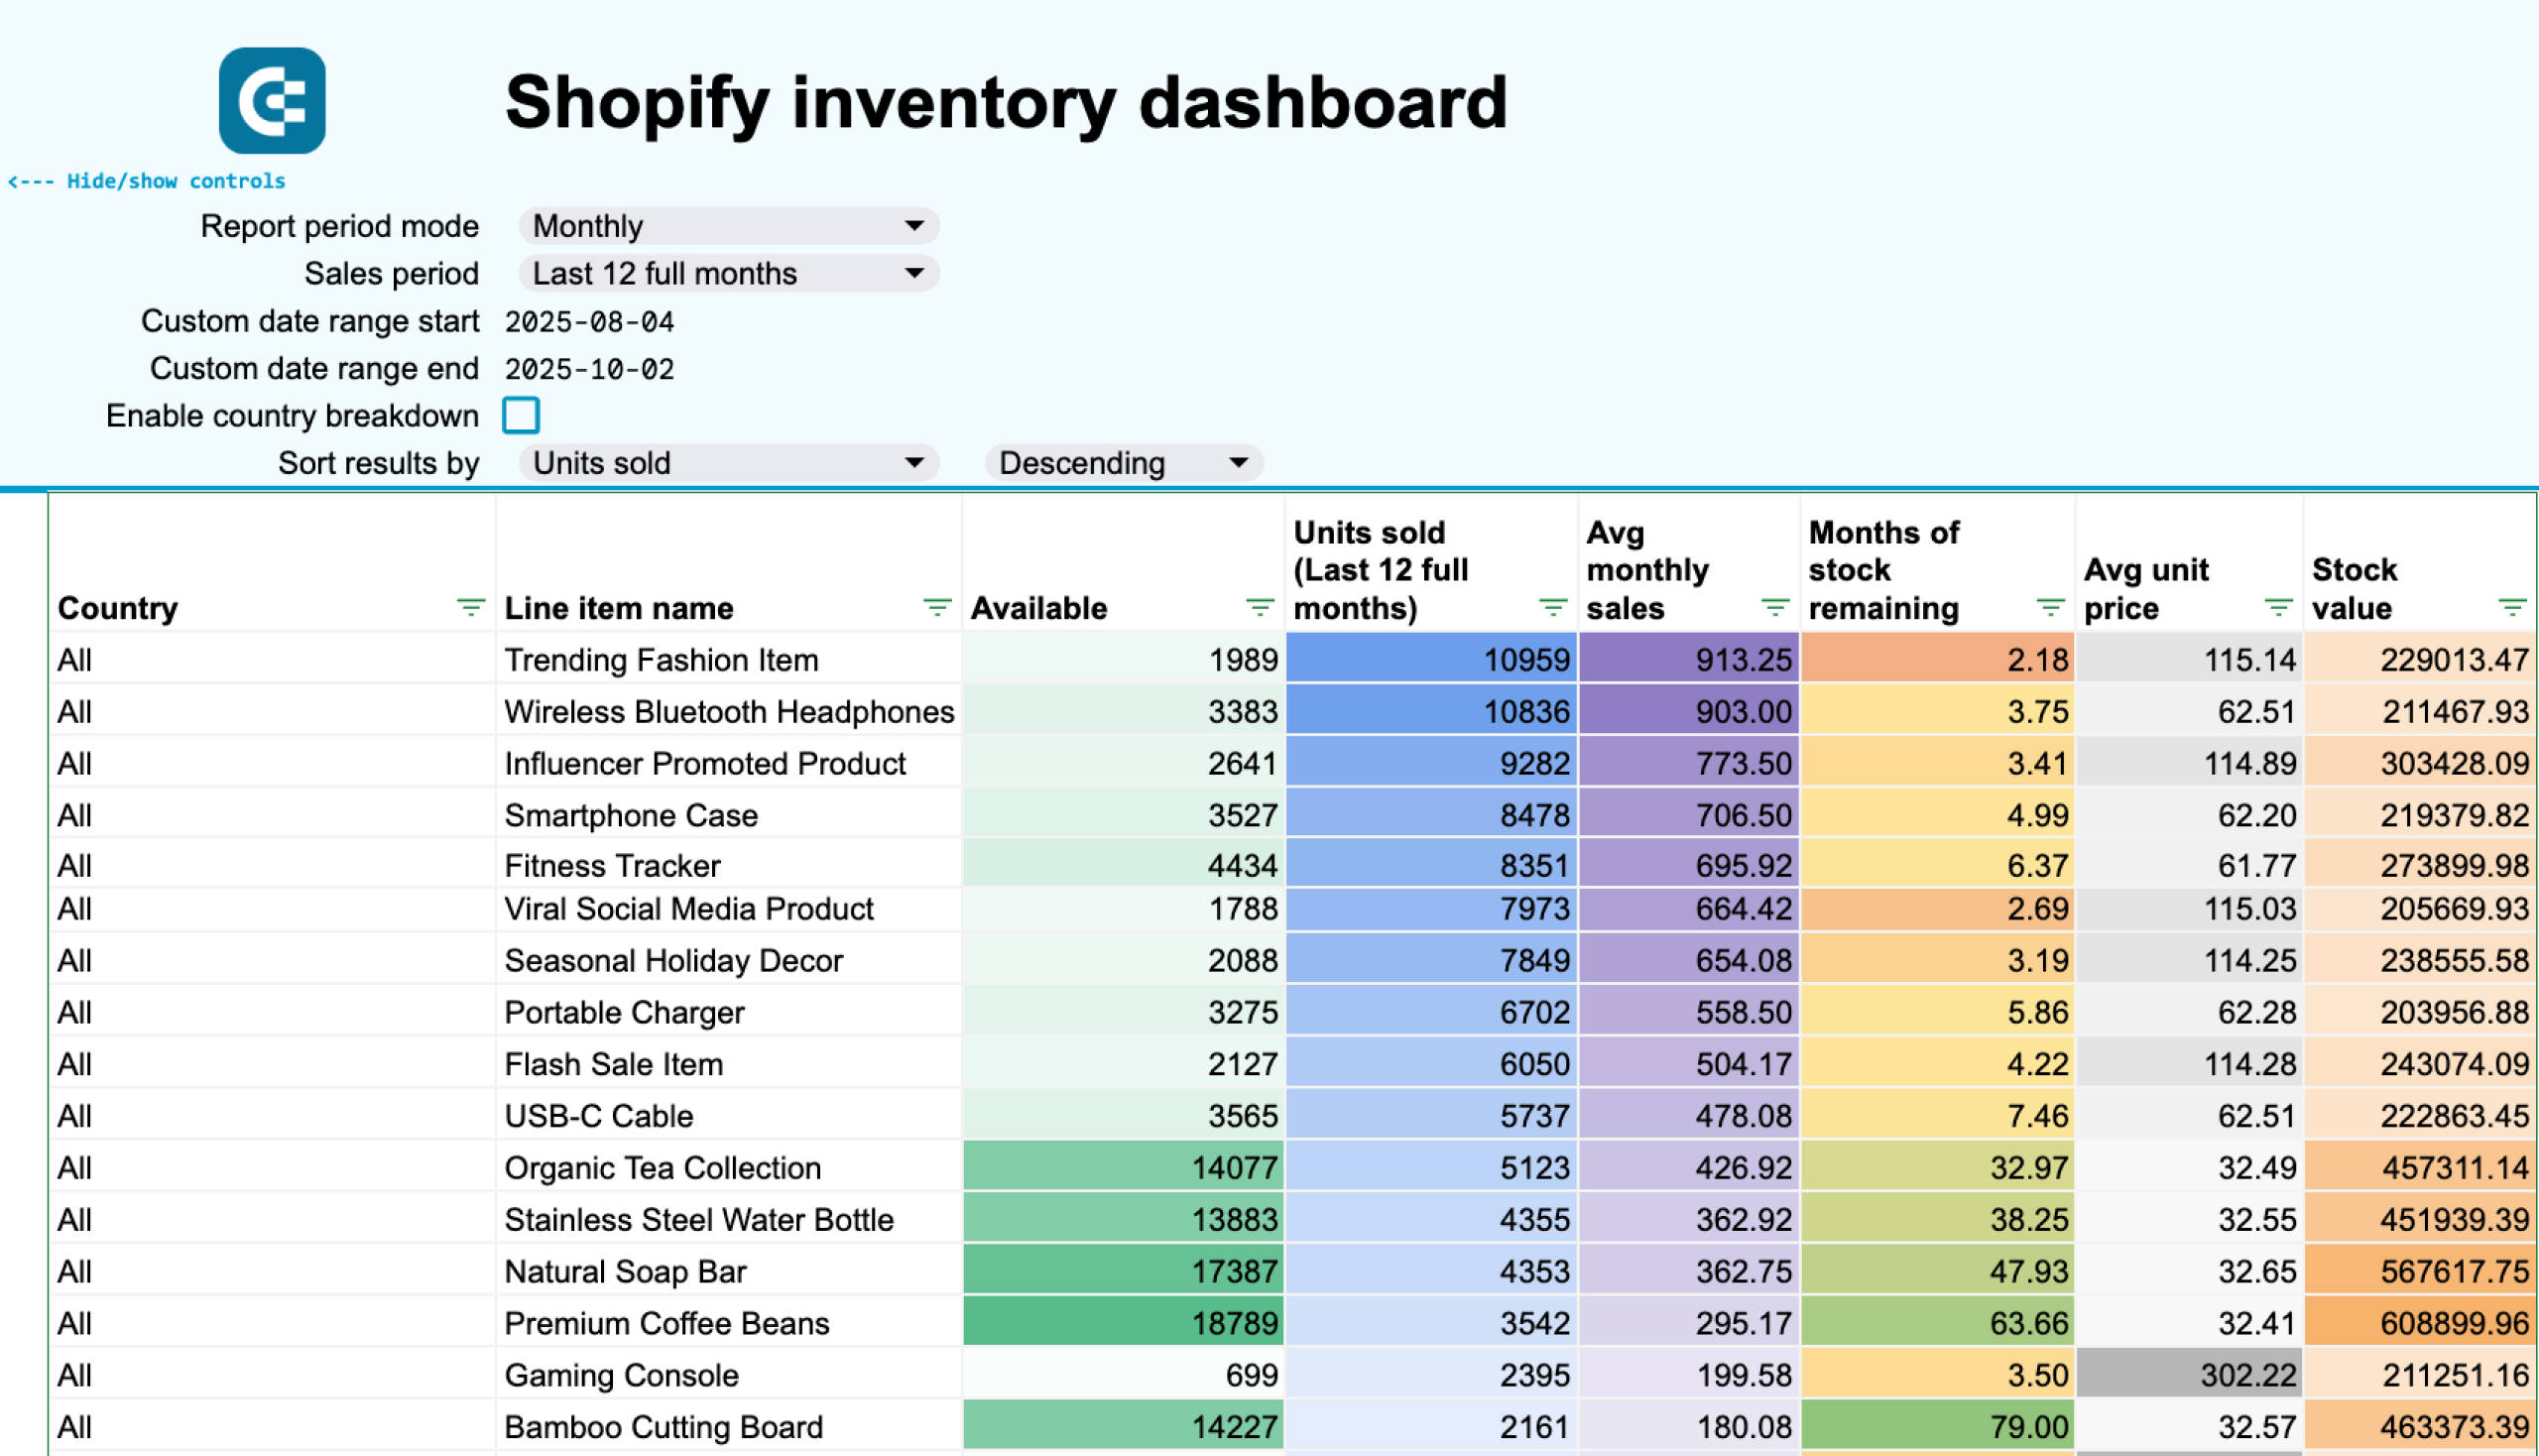
The inventory report provides critical stock optimization capabilities through multi-location warehouse analysis and demand forecasting. This report tracks stock levels across all storage locations while calculating days of inventory remaining for each product SKU. It identifies fast-moving versus slow-moving inventory, monitors reorder points, and analyzes return patterns by geographic location. The report includes procurement planning tools that prevent stockouts while minimizing excess inventory costs. This comprehensive view enables data-driven decisions about product ordering, warehouse distribution, and inventory allocation strategies that optimize working capital efficiency.
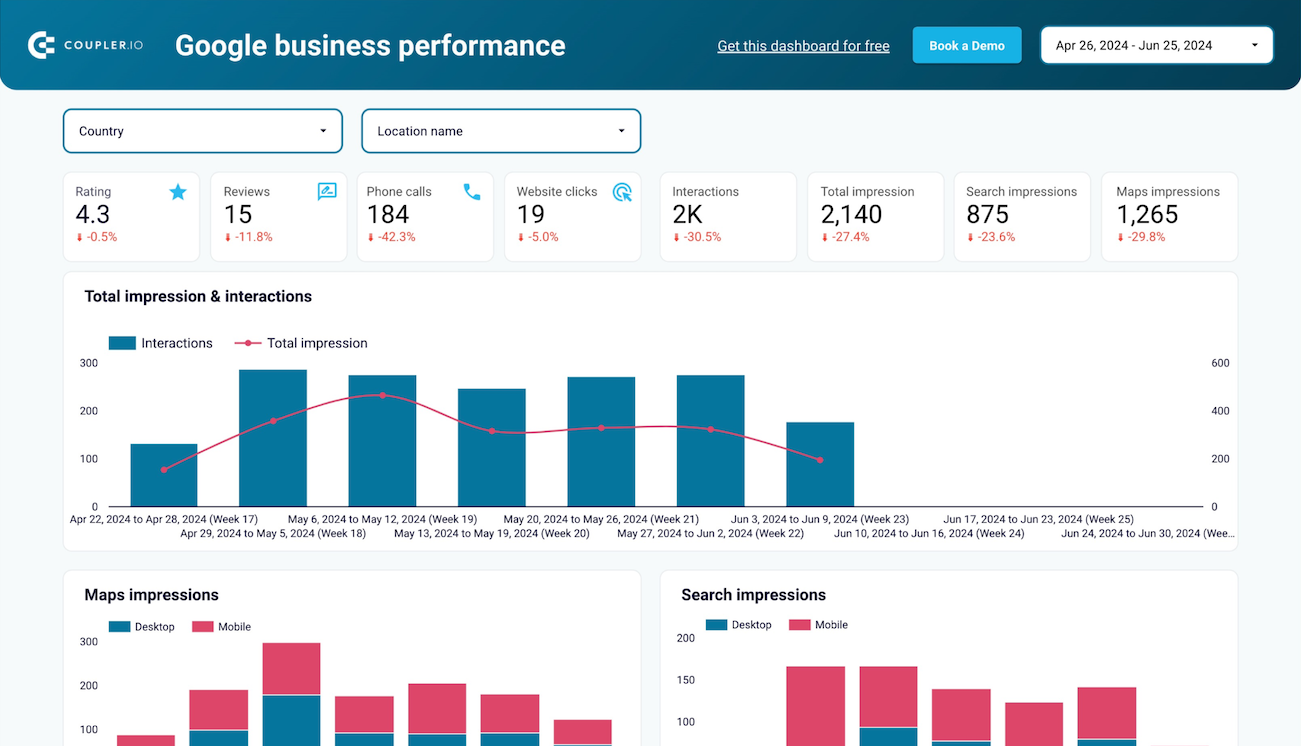
The customer engagement report captures local business interactions and online behavior patterns that drive retail success. This report analyzes customer touchpoints including phone calls, direction requests, website visits, and in-store interactions sourced from Google Business Profile data. It tracks customer review patterns, local search visibility, and geographic engagement variations that inform marketing strategies. The report includes device usage analysis and search term performance that help optimize local SEO efforts and improve customer acquisition through enhanced online presence and reputation management.
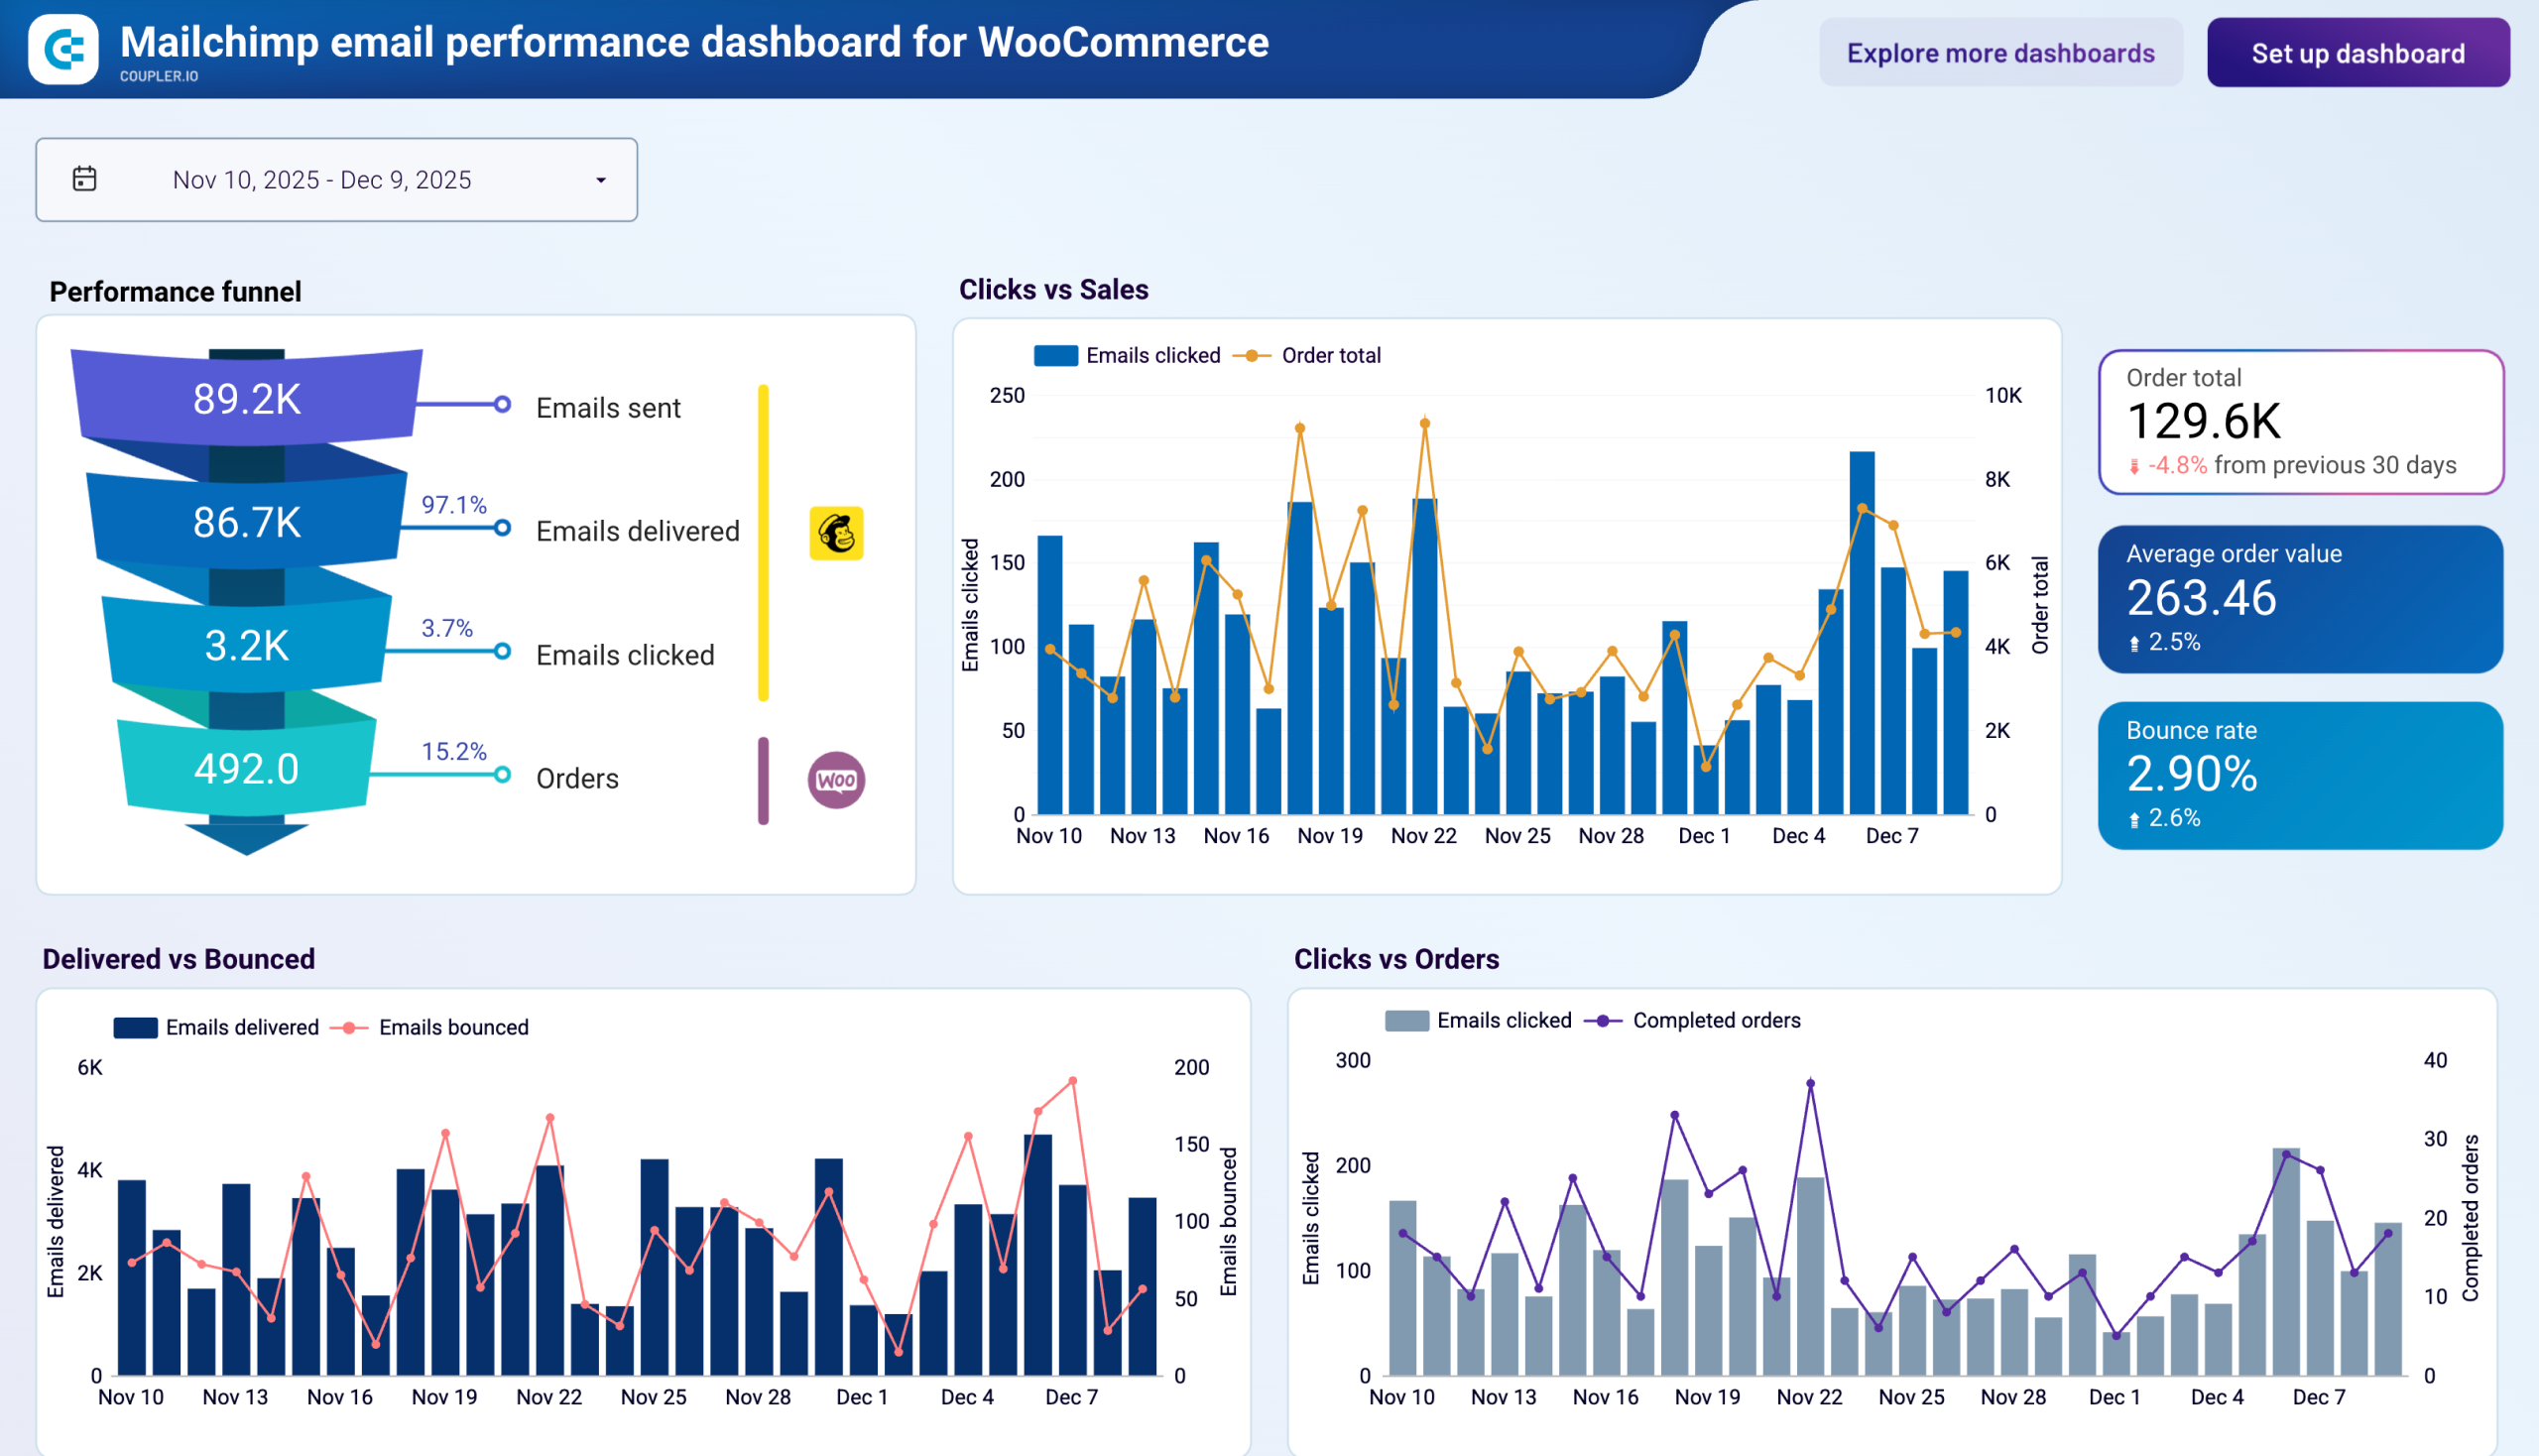
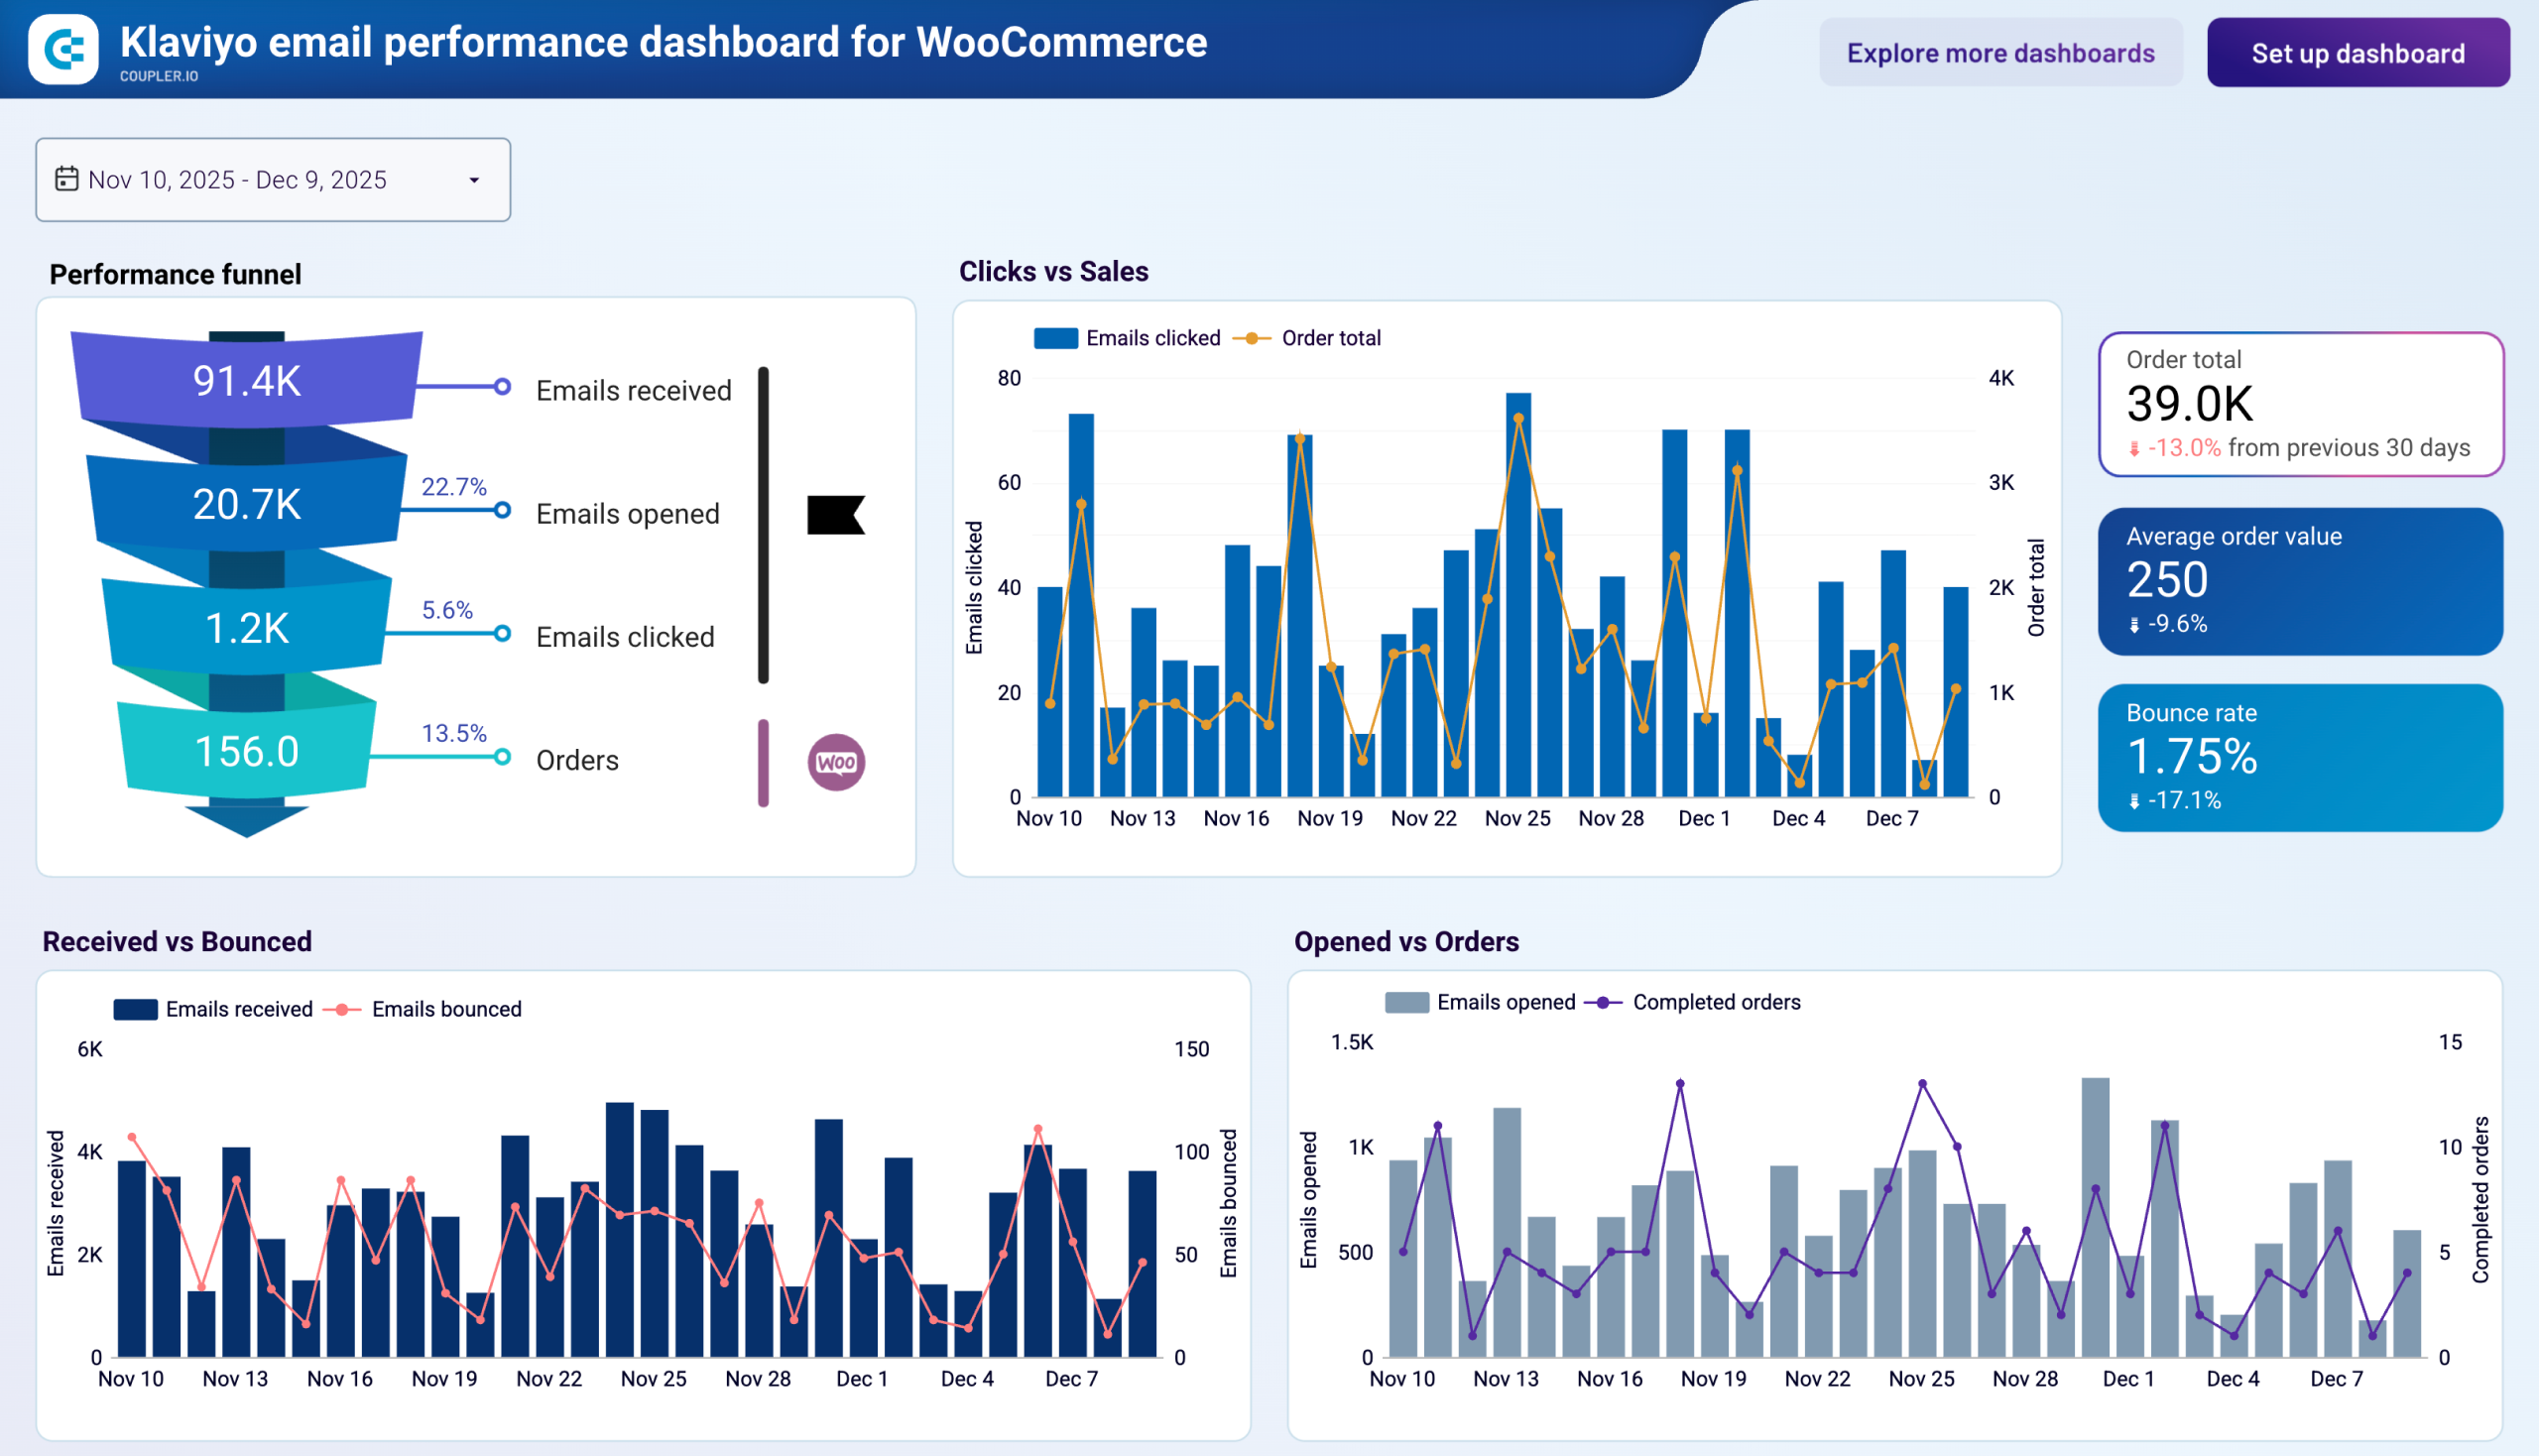
The email marketing report measures campaign effectiveness and revenue attribution across automated and manual email communications. This report tracks the complete email funnel from delivery rates and open percentages to click-through performance and conversion outcomes. It analyzes subscriber behavior patterns, campaign timing optimization, and revenue generated from email-driven traffic. The report includes segmentation analysis, unsubscribe tracking, and customer lifetime value attribution that enables personalized marketing strategies and improved customer retention through targeted email communications that drive measurable business results.
What insights you can get with the store performance dashboard
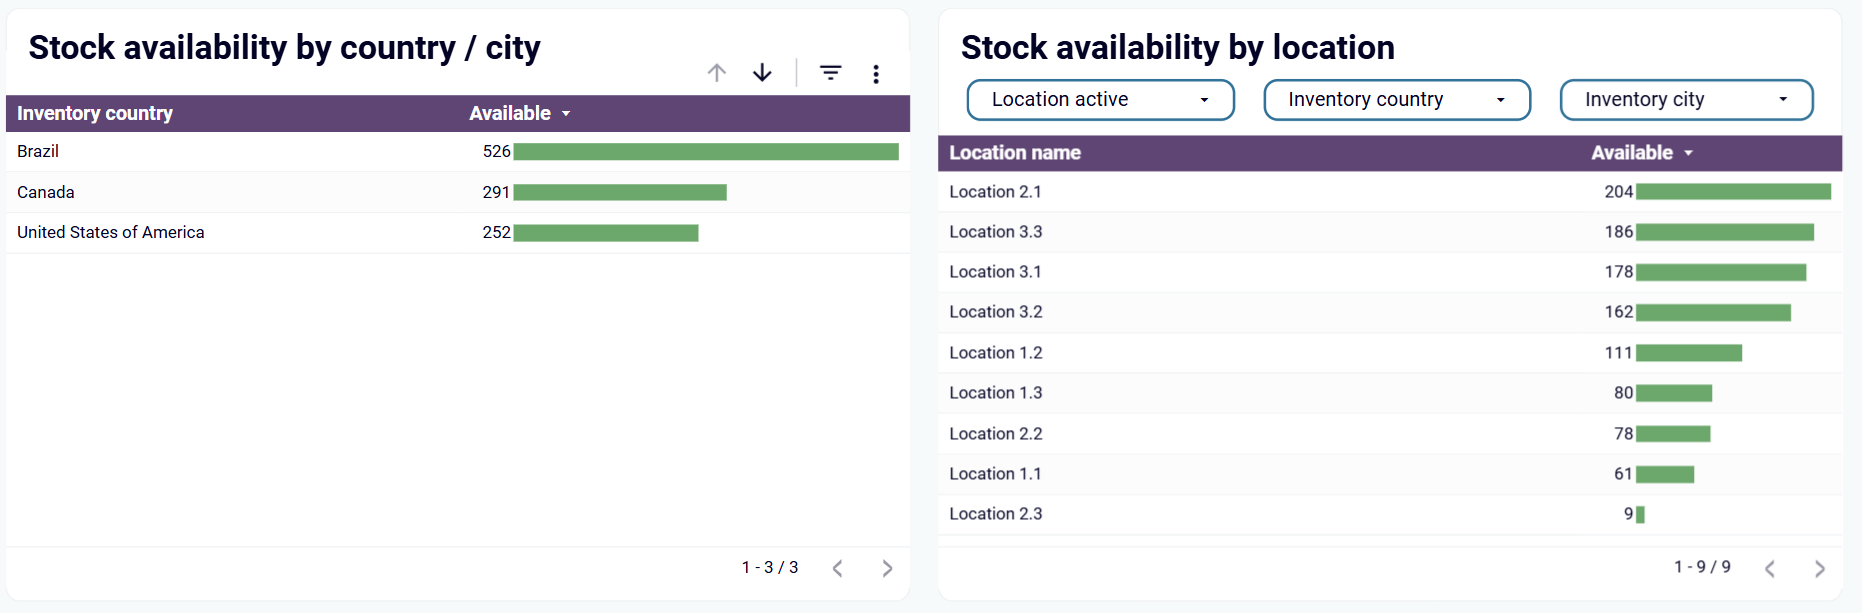
Compare stock levels across all warehouse locations to identify distribution imbalances and prevent costly stockouts. This analysis reveals which locations have excess inventory while others face shortages, enabling strategic stock transfers and optimized fulfillment strategies. The insight helps reduce shipping costs by routing orders from the nearest available inventory location while maintaining optimal stock levels across your entire distribution network.
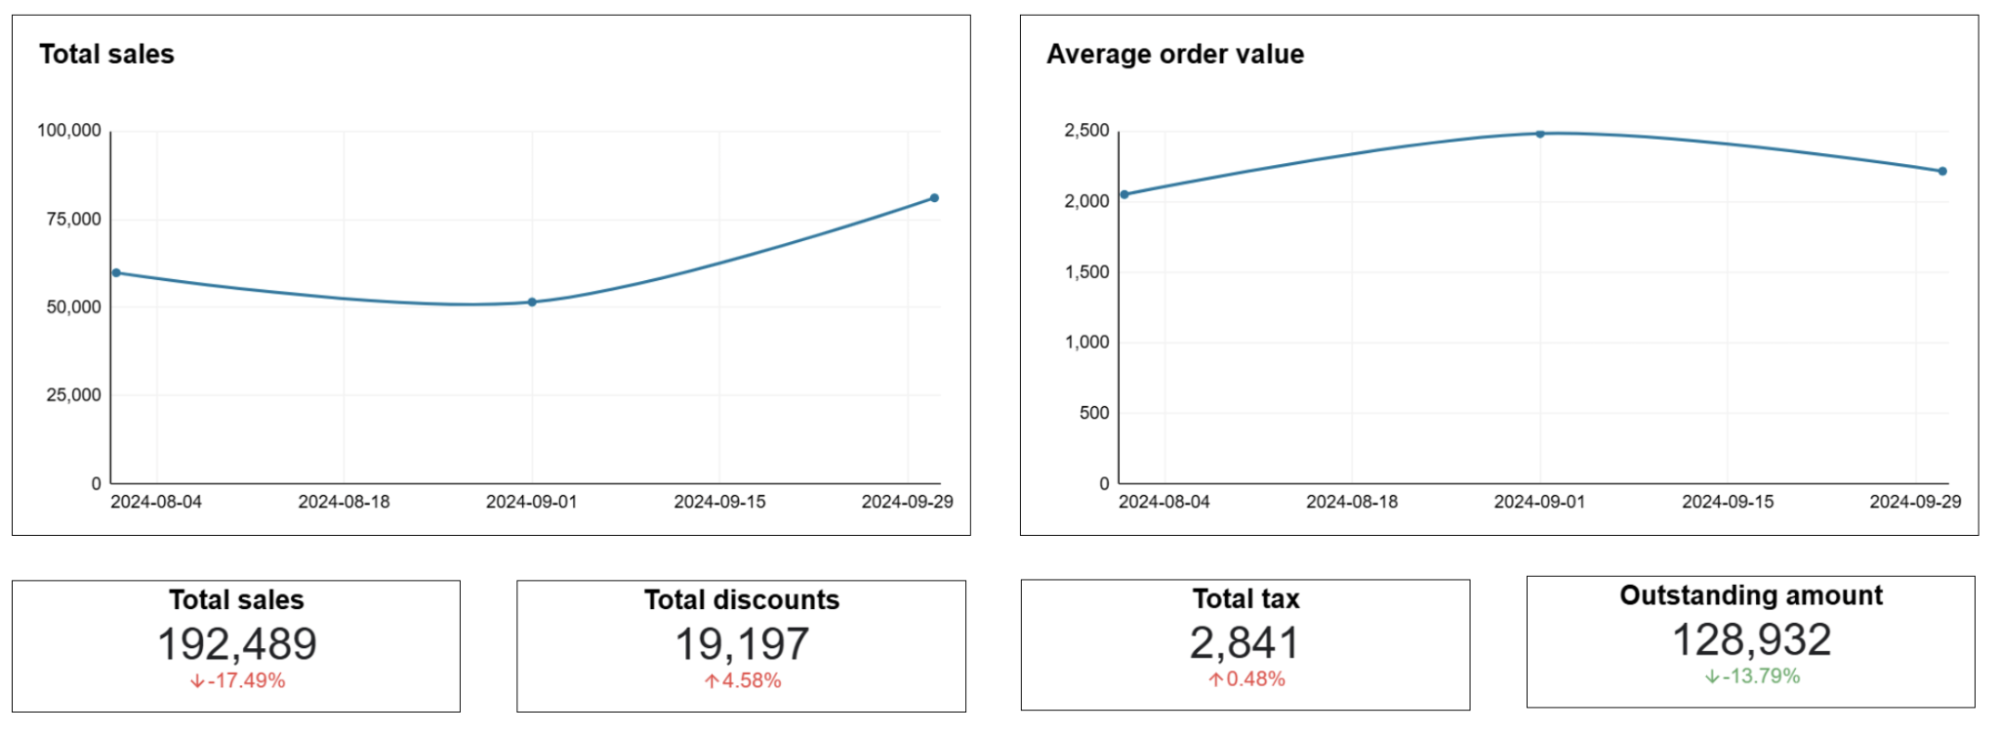
Monitor sales performance through comprehensive geographic and product-based analysis that reveals your most profitable markets and bestselling items. This insight combines order volume data with revenue trends to identify seasonal patterns, regional preferences, and product performance variations. Use this information to optimize marketing spend allocation, adjust inventory purchasing decisions, and develop targeted sales strategies for different markets and customer segments.
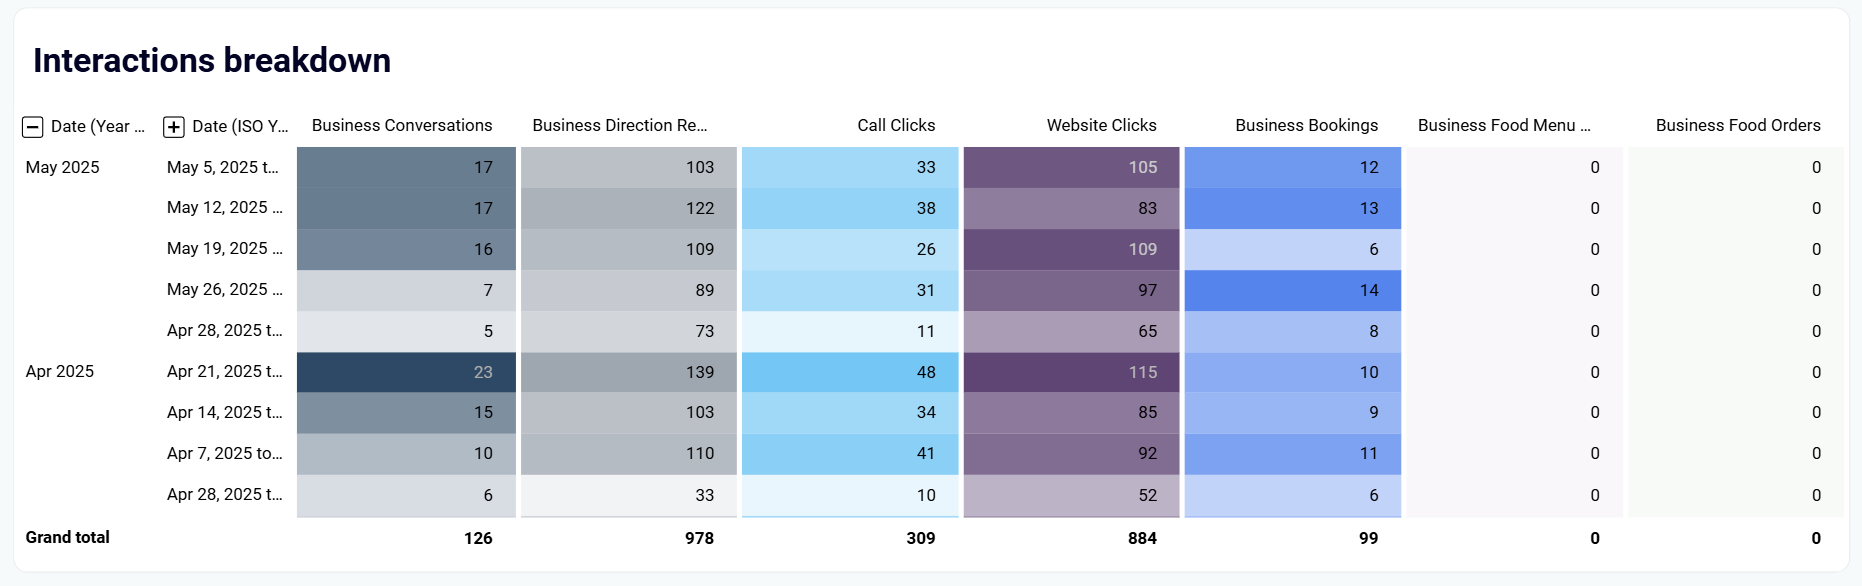
Track how potential customers engage with your business through phone calls, direction requests, and website clicks generated from local search results. This insight reveals customer intent patterns and helps optimize your local business presence for maximum engagement. Understanding which interactions lead to conversions enables better resource allocation for customer service and local marketing efforts that drive foot traffic and online sales.
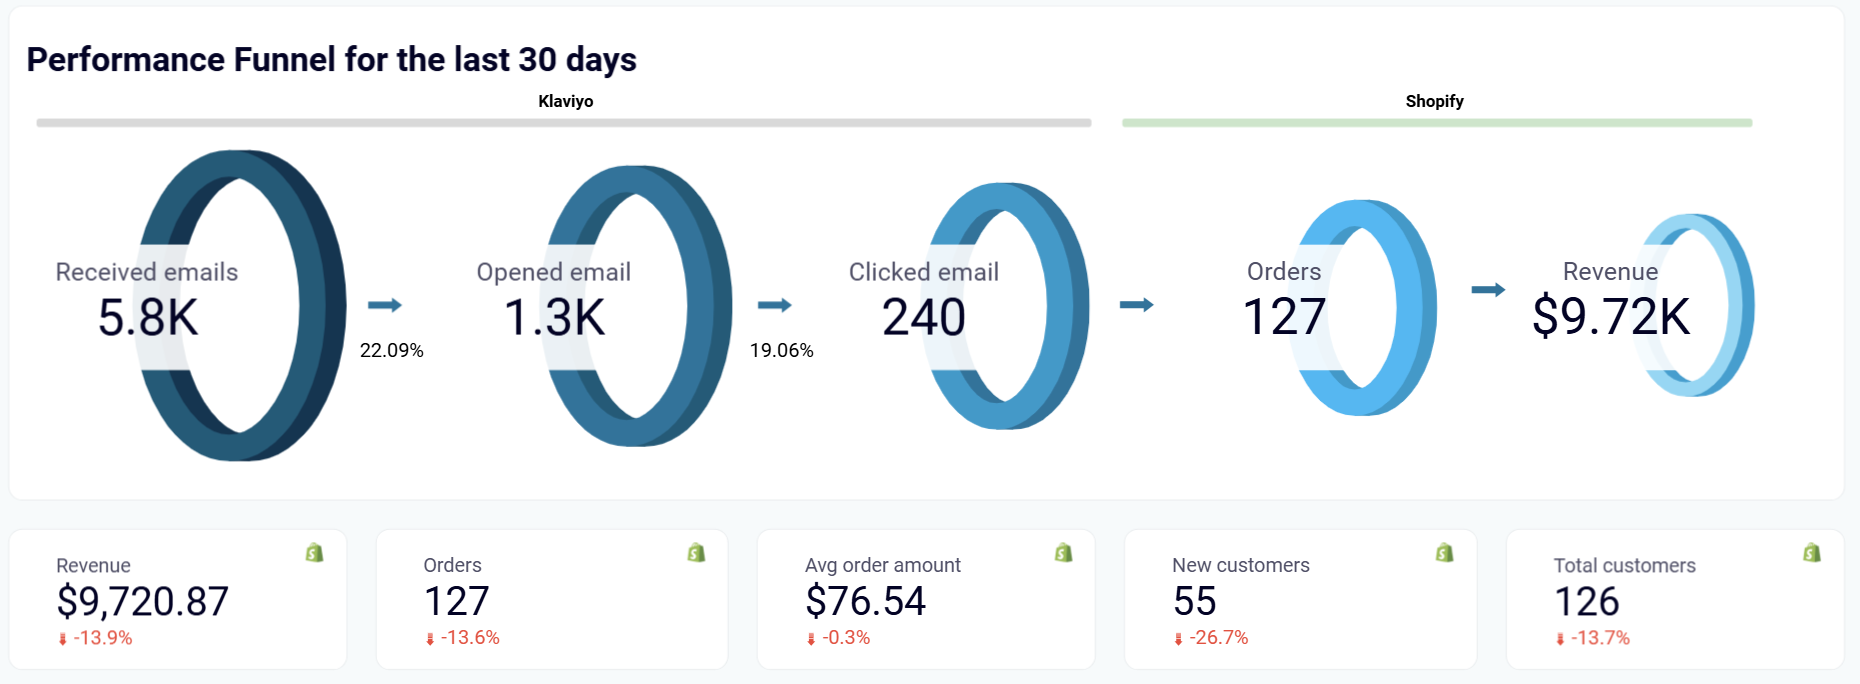
Analyze email campaign performance through deliverability rates, open percentages, and click-through metrics that directly impact revenue generation. This insight identifies bottlenecks in your email marketing process and reveals opportunities to improve subscriber engagement. Track which campaigns drive the highest conversion rates and revenue per recipient, enabling data-driven decisions about email frequency, content strategy, and audience segmentation for maximum marketing ROI.
How to create a store performance dashboard?

Metrics you can track with a store performance dashboard template
More Store performance Dashboards
Request custom dashboard
From building custom dashboards to setting up data analytics from scratch, we're here to help you succeed. Contact us to discuss your case and possible solutions
Contact us