Google Search Console dashboard examples and reporting templates
Transform your SEO strategy with automated Google Search Console dashboard templates that provide real-time visibility into your organic search performance. Monitor key metrics, identify your best and worst-performing pages, track keyword rankings, and analyze international search traffic—all within a customizable white label Search Console dashboard that refreshes automatically through Coupler.io.
Examples of Google Search Console dashboards for every need


 +6
+6


 +6
+6

about your case. It doesn't cost you a penny 😉
Choose your white label Google Search Console dashboard to kick off
What is a Google Search Console dashboard?
The Search Console dashboard template provides a unified view of organic search performance, keyword rankings, technical SEO issues, and landing page effectiveness across multiple dimensions. Through Coupler.io's automated data integration, these dashboards pull data directly from Google Search Console API and refresh on a schedule, eliminating the need for manual exports or complex data manipulation. This gives marketing teams and SEO specialists immediate access to fresh insights about how their content performs in search results, where optimization opportunities exist, and how organic visibility trends over time.

What reports should be included on a meaningful Search Console dashboard?
A comprehensive Google Search Console reporting dashboard should incorporate several essential reports that provide deep visibility into your organic search performance. Based on our analysis of industry-leading Looker Studio Google Search Console dashboards, we recommend including these four critical report types:
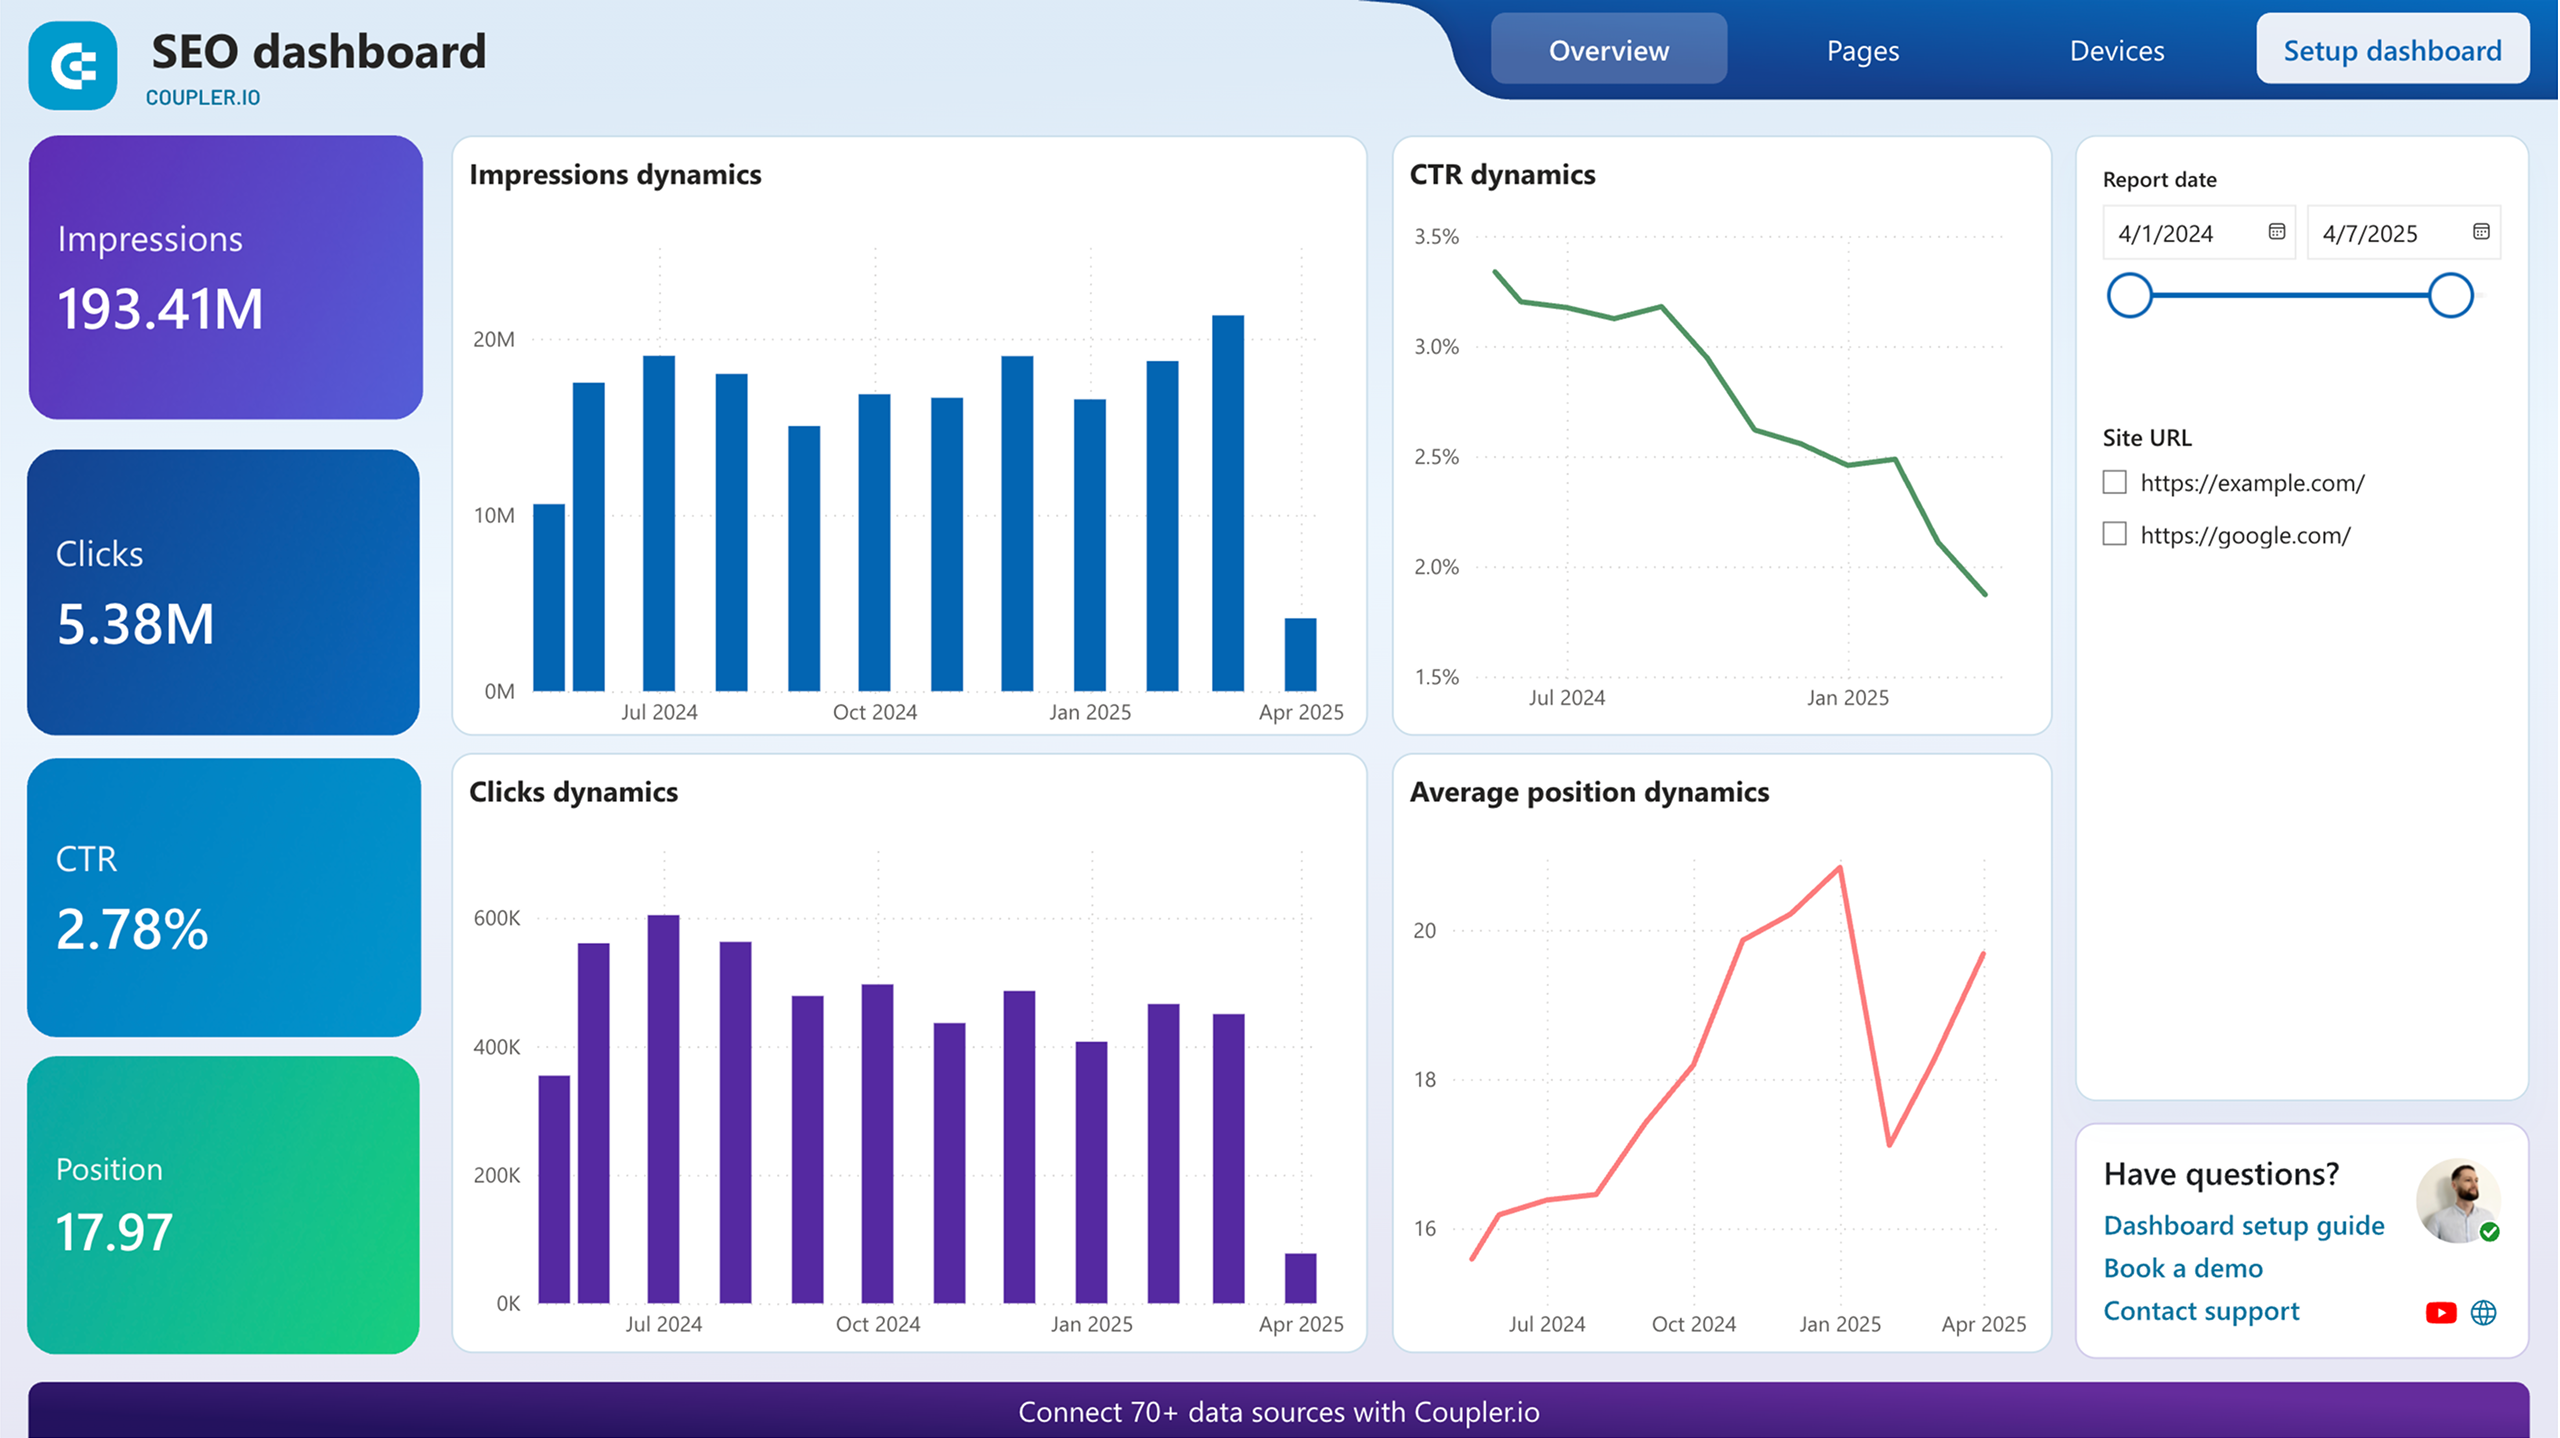
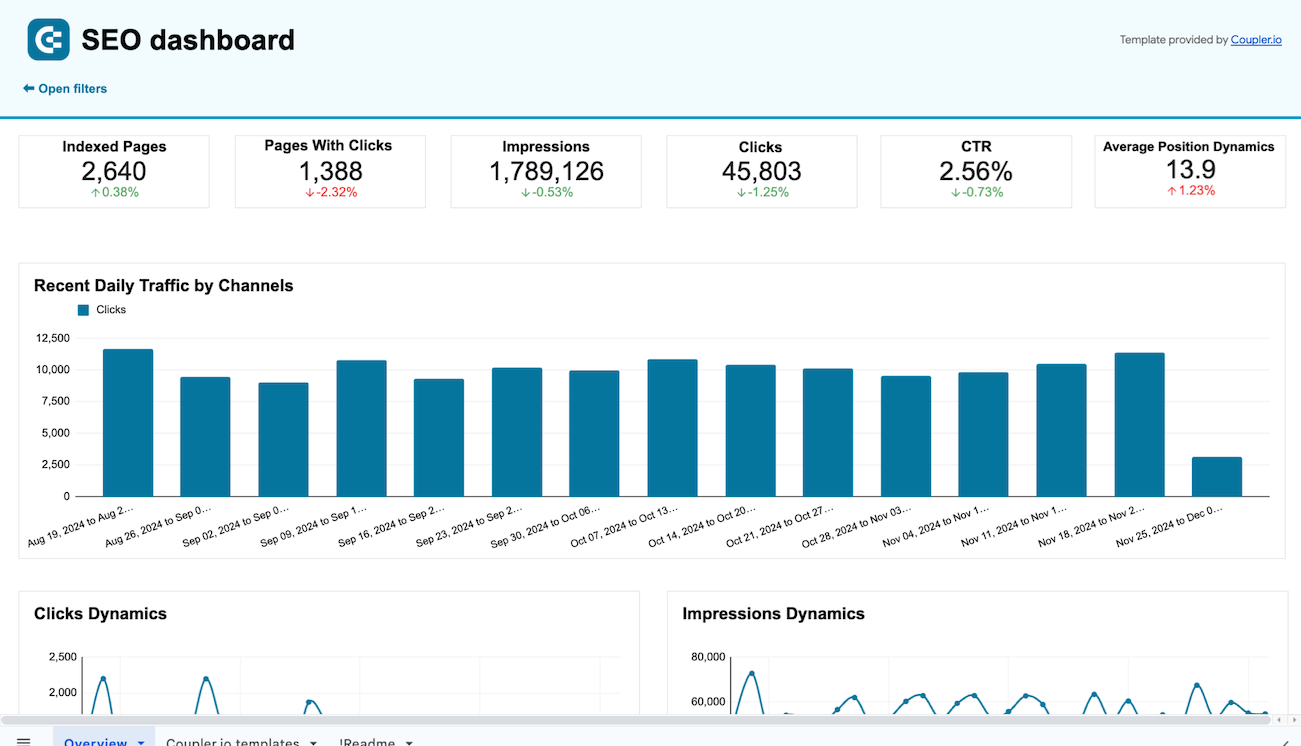
The organic traffic performance report provides a holistic view of your site's visibility in search results. It displays metrics like clicks, impressions, click-through rate (CTR), and average position over time, with comparisons to previous periods. The report allows you to identify traffic trends, seasonal patterns, and the impact of your SEO efforts. It also breaks down performance by device (mobile, desktop, tablet) with side-by-side comparisons, helping you prioritize optimization for platforms where engagement needs improvement.
The top queries and landing pages report organizes your website's pages by clicks and displays the top 10 queries (keywords) driving traffic to each page. This innovative approach, unavailable in the native Search Console interface, creates a structured view that helps you identify which keywords bring the most value to specific pages. The report enables you to check query relevance to landing pages, detect keyword cannibalization issues where the same queries appear across different pages, and spot opportunities to improve meta descriptions for queries with high impressions but low CTR.
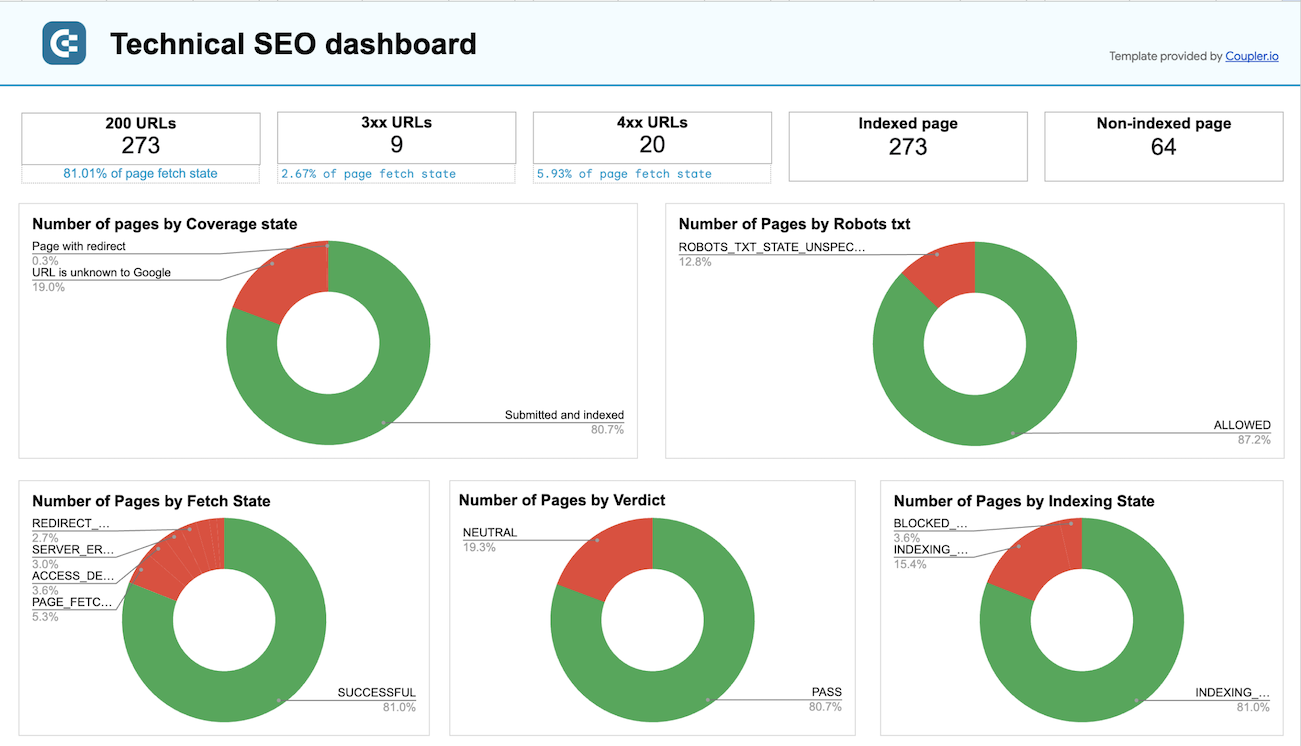
The technical SEO status report offers a comprehensive overview of your website's indexing health. It includes five intuitive pie charts showing the distribution of pages by crawl status, indexing state, mobile usability, structured data, and other technical factors. The report helps you quickly identify pages blocked by robots.txt, pages with meta robots restrictions, rendering issues, and pages submitted but not yet indexed. Having this technical overview alongside performance metrics provides context for why certain pages might underperform and highlights opportunities for technical optimization.
The geographic performance report breaks down search performance by country, providing crucial insights for international websites and businesses targeting global markets. It shows top countries by clicks, trends in traffic from key markets, and identifies the best and worst-performing regions with easy-to-read comparative tables. This report enables you to check if country-specific content is properly ranking in target regions, understand search behavior differences across markets, and identify emerging geographical opportunities that deserve additional content or optimization resources.
What insights you can get with a Google Search Console reporting dashboard
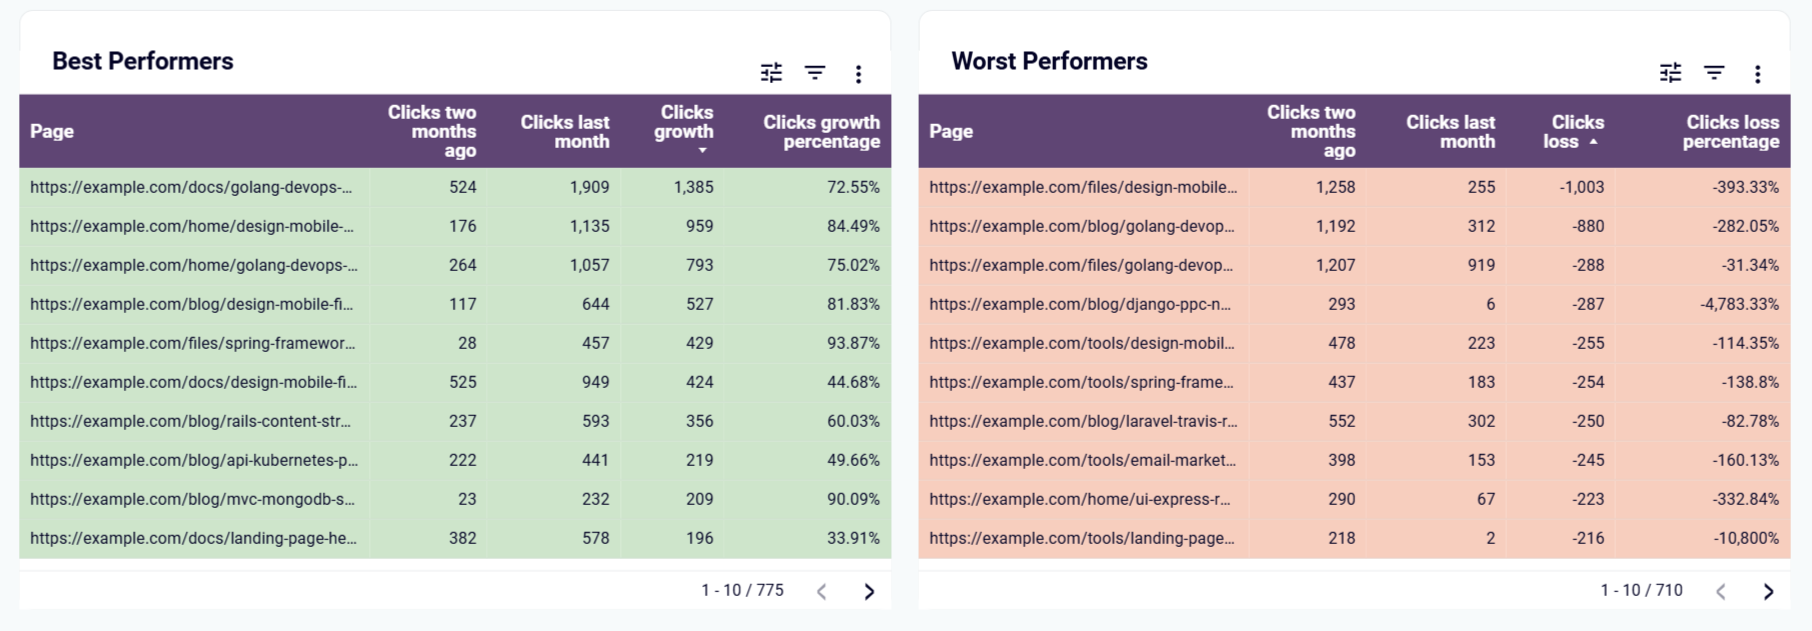
The SEO dashboard provides two powerful comparative tables showing your best and worst-performing pages by comparing the clicks of each page for the last full month with the previous one. This insight eliminates the need to manually track page performance and immediately highlights which content is gaining or losing traffic. For example, when you see a critical landing page has lost 40% of its traffic month-over-month, you can quickly prioritize investigation into potential ranking drops, technical issues, or increased competition before the situation worsens.
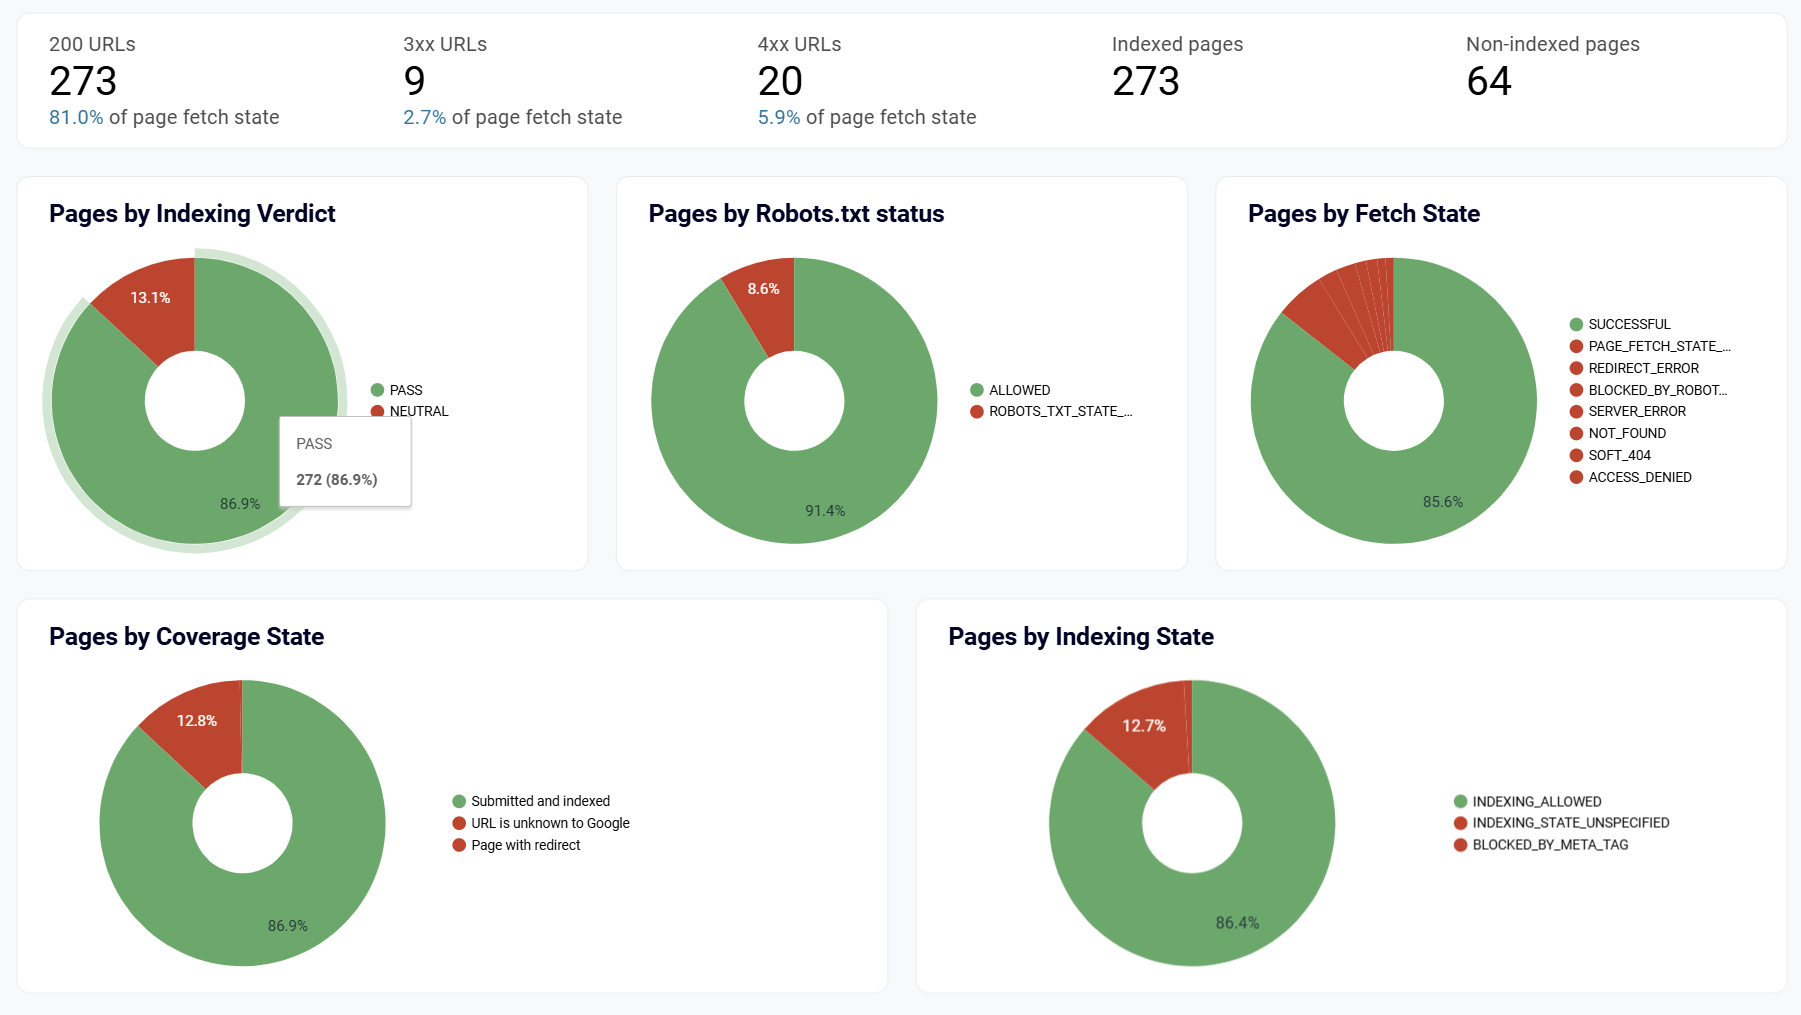
The Technical SEO dashboard features intuitive pie charts that provide instant visibility into your website's technical health. These visualizations show the distribution of pages by crawl status, indexing state, mobile usability, and more. This consolidated view helps you quickly identify what percentage of your site faces indexing challenges or technical limitations without digging through multiple reports. When you see that 15% of your pages have "noindex" tags or 20% are being blocked by robots.txt, you can immediately prioritize technical fixes that could significantly improve your search visibility.
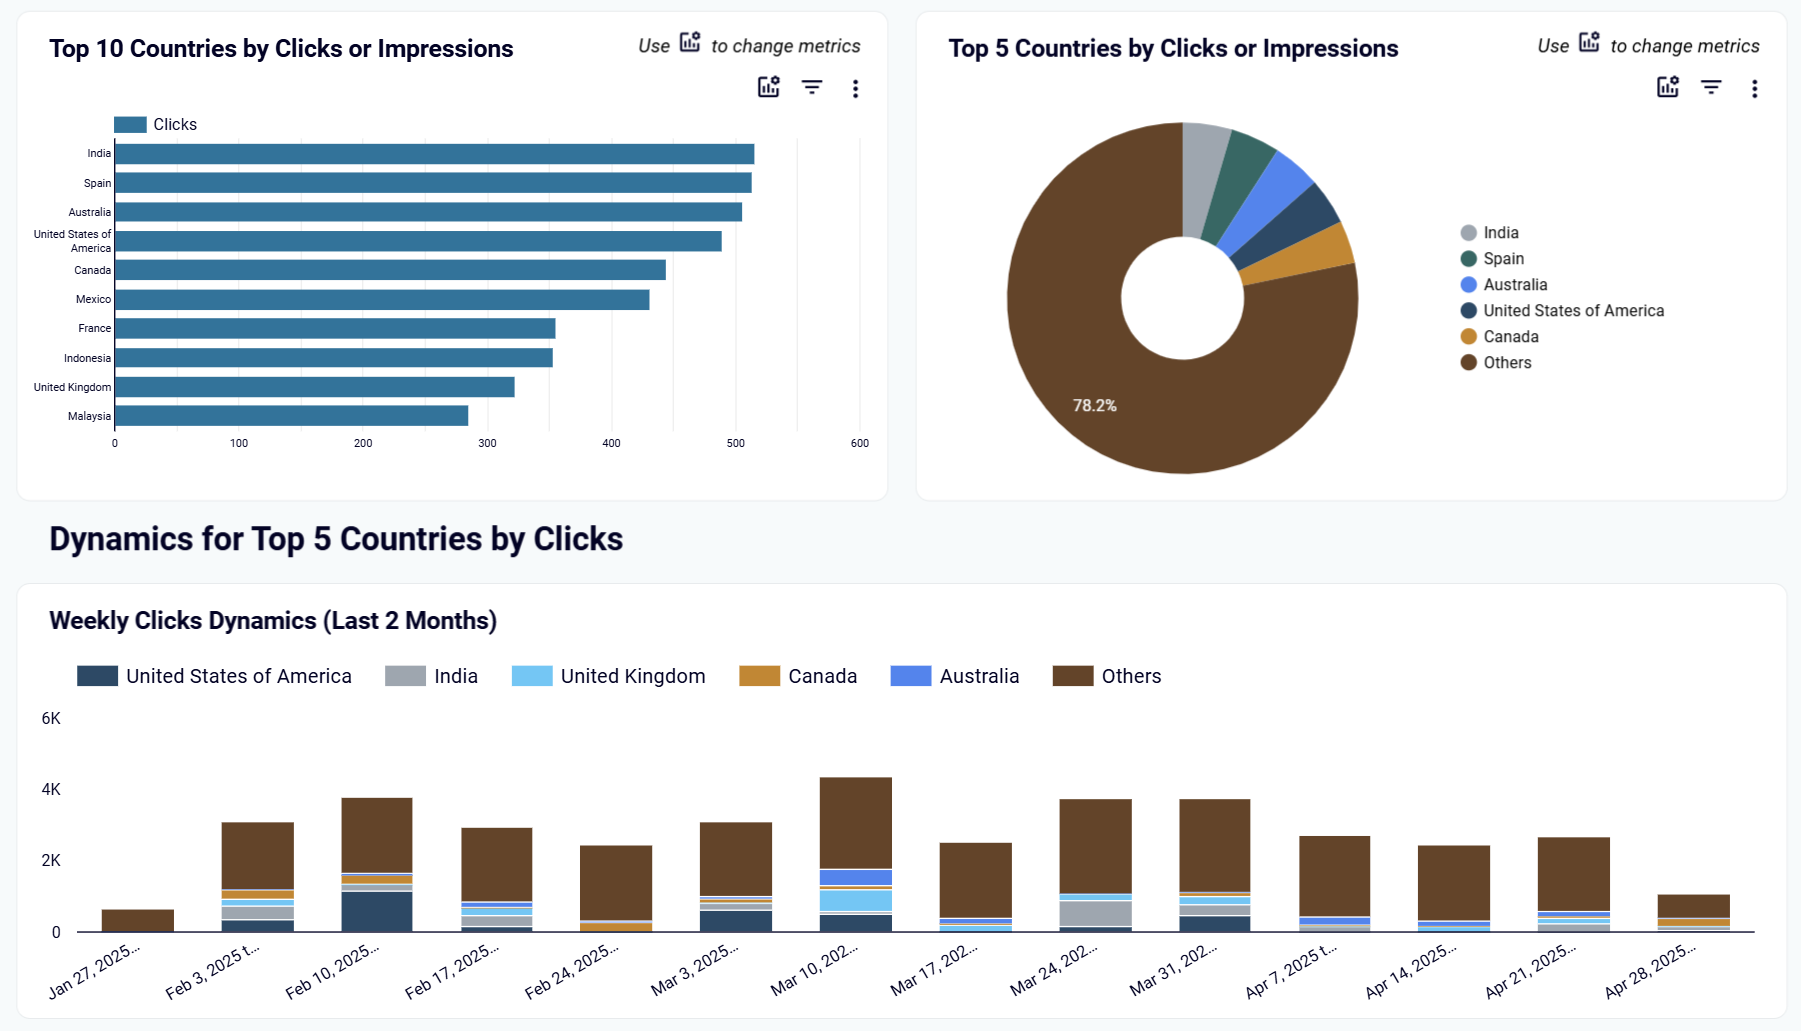
The International SEO performance dashboard instantly identifies your top-performing countries by clicks and shows performance trends for your top five markets over the past two months. This geographical analysis helps global businesses understand which regions drive the most search traffic and how regional performance evolves over time. When you notice emerging growth in a previously underperforming market, you can investigate what content is resonating there and potentially expand your strategy to capitalize on new opportunities before competitors do.
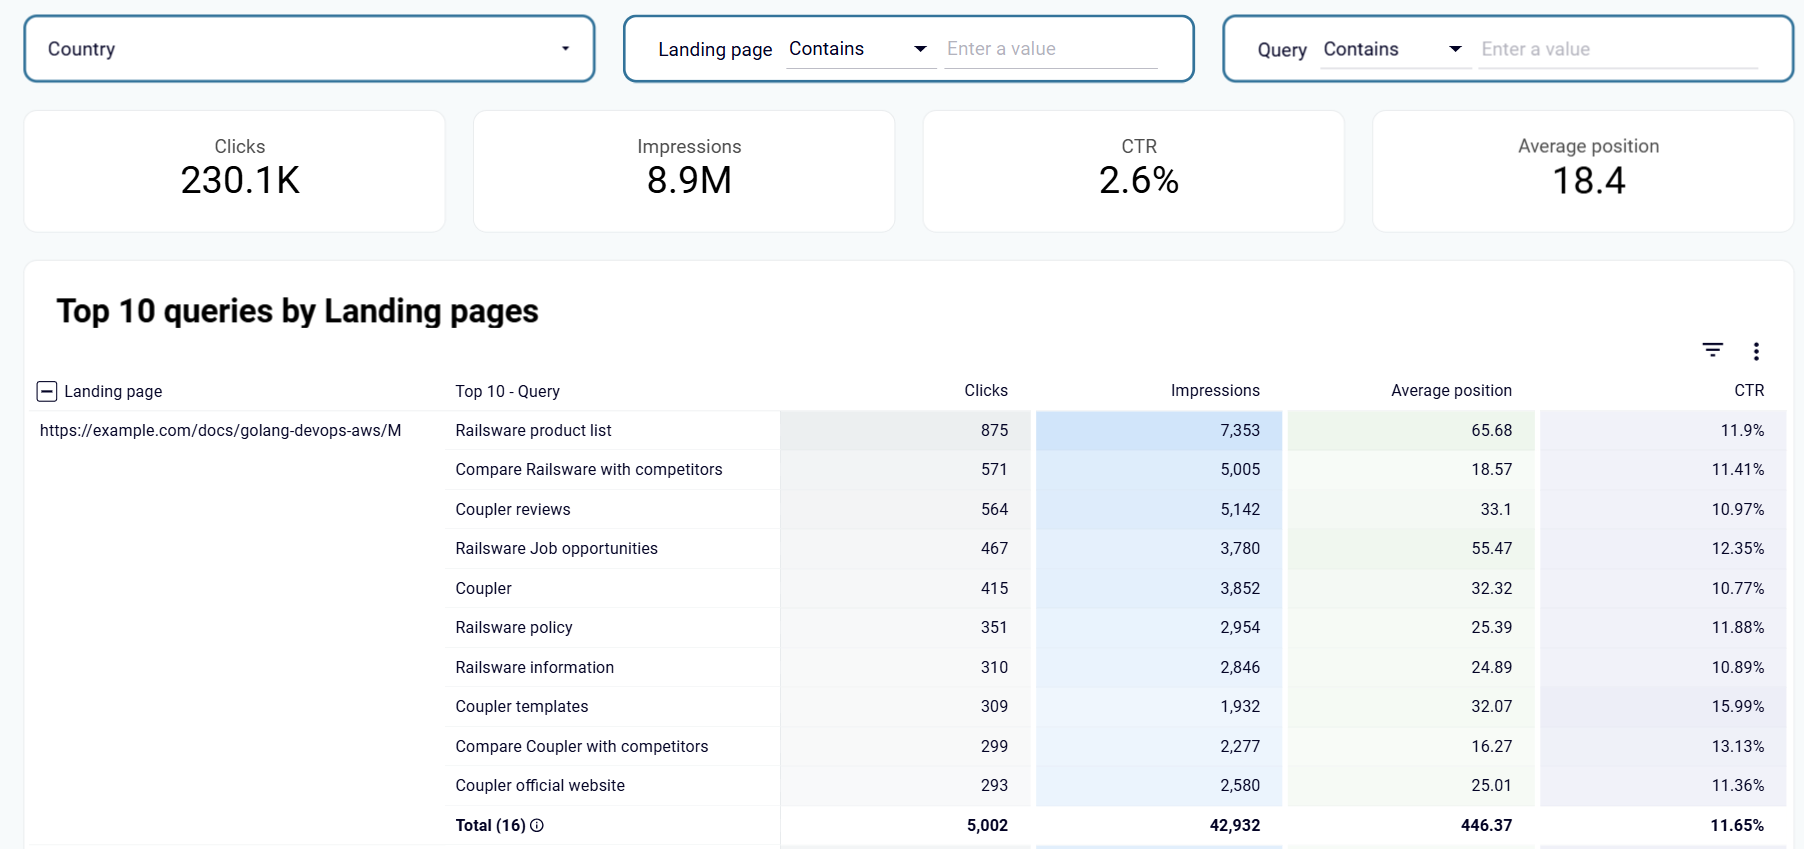
The Top search query performance dashboard creates a structured view of your top 10 queries (keywords) ranked by clicks for each landing page. This unique organization, unavailable in native Search Console, helps you understand exactly which search terms drive traffic to specific pages. You can quickly identify if the ranking keywords align with your content strategy or if pages are attracting traffic for unexpected terms. When you discover a product page ranking highly for informational keywords rather than commercial terms, you can adjust your content strategy to better match user intent and improve conversion opportunities.
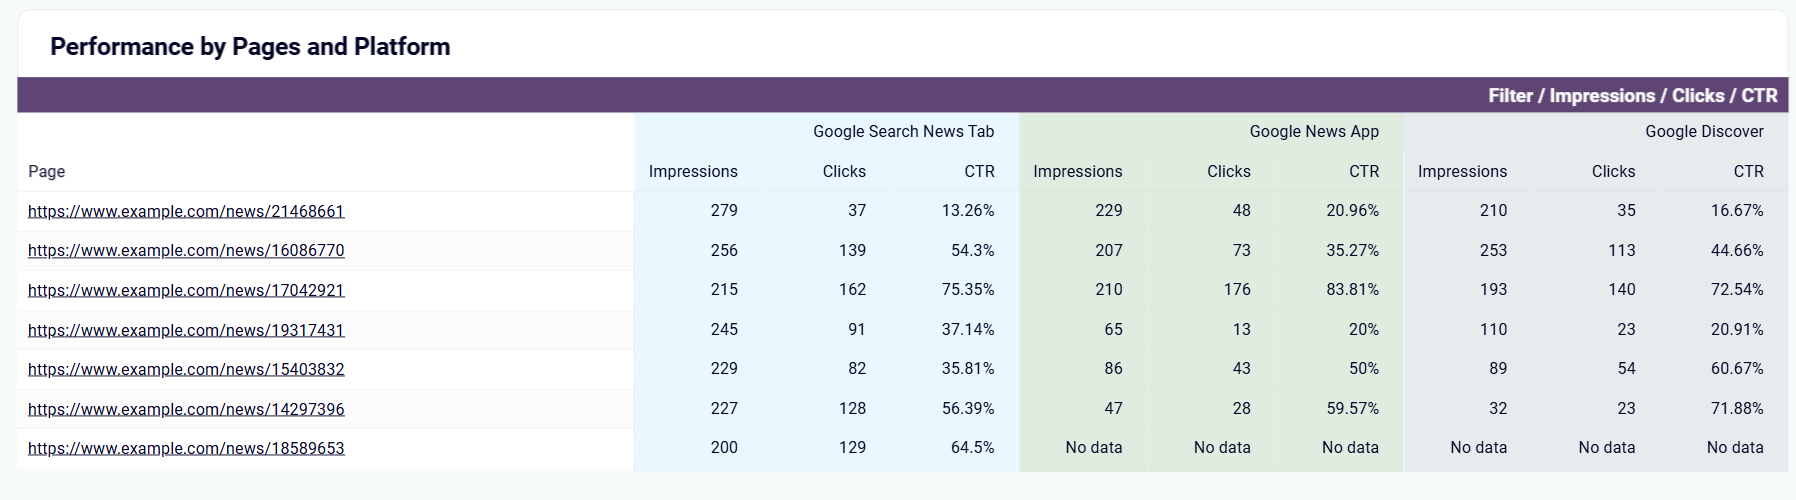
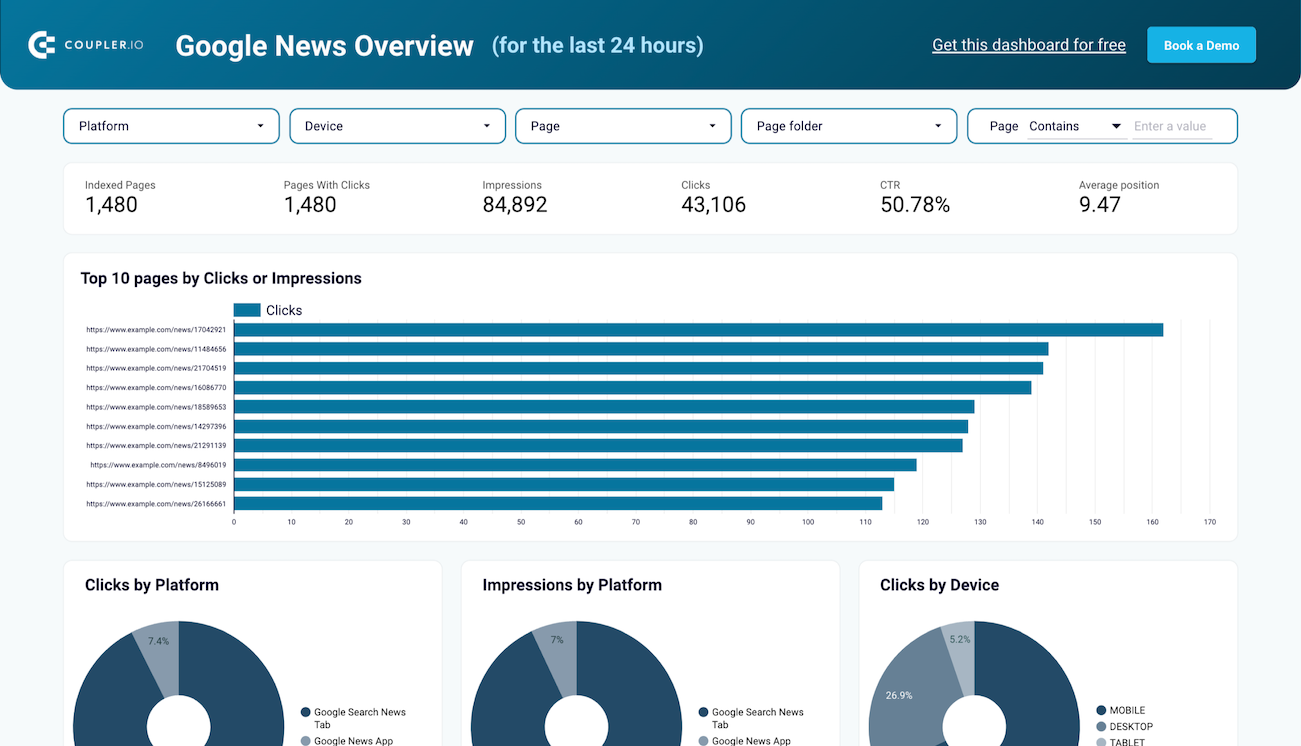
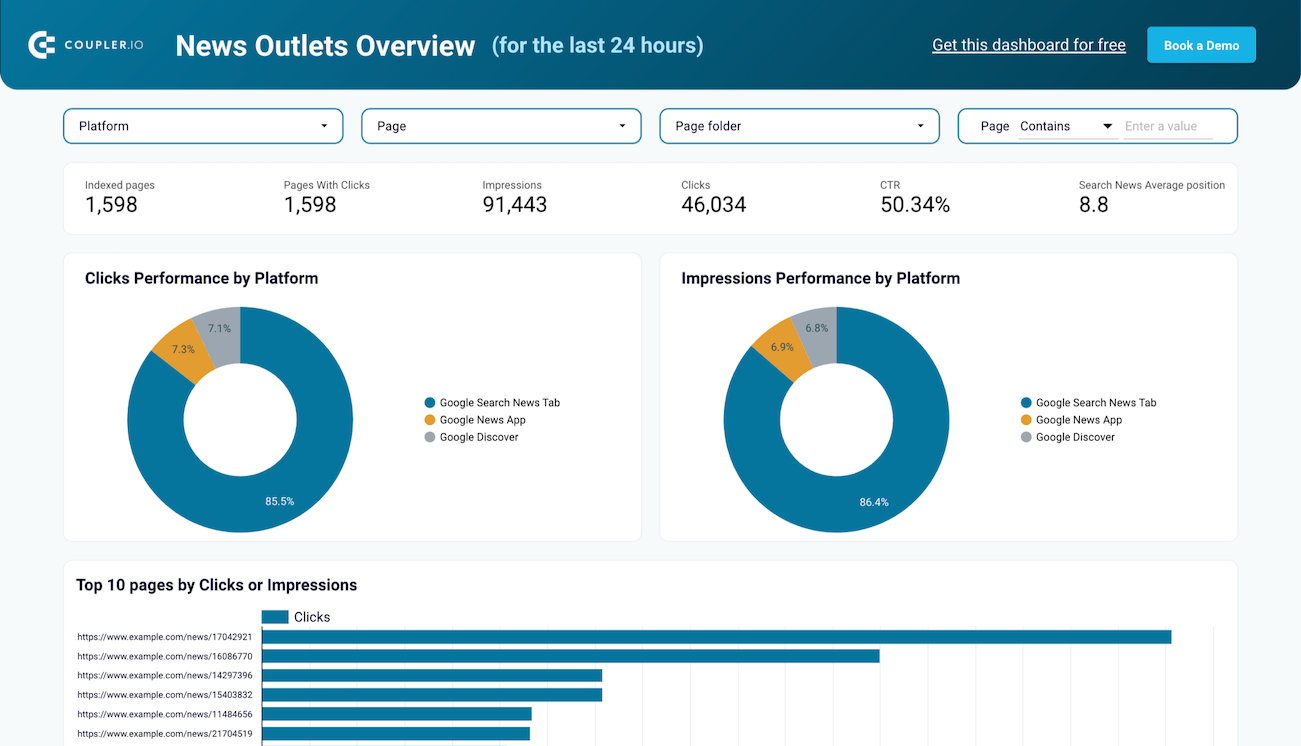
The News outlets dashboard provides comprehensive 24-hour performance tracking across Google News Search Tab, Google News App, and Google Discover—the three platforms that typically drive 90% of traffic to news websites. This real-time view helps editorial teams understand which stories are performing well across different distribution channels and how audience engagement varies by platform. When you see a breaking story performing exceptionally well in the Google News app but underperforming in Discover, you can optimize headlines or featured images to improve cross-platform visibility and maximize traffic potential.
How to create a Google Search Console dashboard?

Metrics you can track with a Search Console dashboard template
Track the number of times users click through to your site from search results, with trends over time and comparisons to previous periods. This foundational metric shows the actual traffic Google Search delivers to your website, helping you gauge the success of your SEO efforts and content strategy. When analyzed alongside impressions and position data, clicks provide insights into how well your search listings convert visibility into actual website visits.
Monitor how often your pages appear in search results, regardless of whether users scroll far enough to see them. This visibility metric helps you understand your content's reach in search and serves as an early indicator of SEO progress. Rising impressions often precede increases in clicks, making this a valuable forward-looking metric that helps you identify emerging opportunities before they impact your traffic numbers.
Measure the percentage of impressions that result in clicks, indicating how compelling your search listings are to users. This engagement metric reveals how well your titles and meta descriptions persuade users to visit your site. Low CTR with good rankings suggests optimization opportunities for your search snippets, while unusually high CTR may indicate particularly effective messaging that could be applied to other content.
Track where your pages typically rank in search results, with breakdowns by page, query, country, and device. This ranking metric provides context for your performance data and helps set realistic expectations for click potential. Position improvements often precede traffic growth, making this a valuable leading indicator of SEO success that helps prioritize optimization efforts toward content on the verge of significant visibility improvements.
Identify which search terms bring the most traffic to each specific page on your website. This relationship data reveals how Google interprets your content and which user needs it fulfills. When queries don't align with your page's intent, it signals either a content mismatch that needs addressing or an opportunity to better serve an unexpected audience that finds value in your content.
Monitor the percentage of your site's pages that are properly indexed, blocked, or experiencing indexing issues. This technical health metric highlights barriers preventing content from appearing in search results. Regular monitoring helps identify crawling issues, robots directives problems, or server errors that might silently impact your search visibility without affecting currently indexed content.
Compare how your search visibility, rankings, and engagement differ between device types. This user experience metric helps identify mobile optimization issues or opportunities to better serve different user contexts. Significant disparities between mobile and desktop performance often indicate technical problems, content formatting issues, or user experience barriers that require attention.
Analyze how your search presence varies across different countries and regions with data on clicks, impressions, and rankings by location. This international visibility metric is essential for global businesses and helps identify local optimization opportunities. Performance disparities between regions often reveal untapped markets, language optimization needs, or region-specific search behavior patterns that require targeted content strategies.
Identify pages with significant traffic changes compared to previous periods, highlighting both growth opportunities and potential problems. This comparative performance metric cuts through data noise to focus attention on the most impactful changes affecting your search traffic. Quick identification of declining pages allows for timely intervention before traffic losses become significant.
Track visibility and engagement across Google News Search Tab, Google News App, and Google Discover for content publishers. This channel distribution metric helps news and content organizations understand how their material performs across Google's various content discovery platforms. Performance differences between platforms often indicate optimization opportunities for specific content types or formats based on how each platform surfaces content to users.