Gabriel Solberg is a B2B Growth Performance Marketer at Right Percent, an advertising agency where he brings 14 years of experience across Meta, LinkedIn, and Google Ads. He specializes in scaling campaigns for B2B SaaS clients and currently manages over $1 million in monthly ad spend for a single Meta advertiser. His track record includes achieving triple-digit MQL growth with a 60% CPA reduction and helping grow enterprise annual revenue from $23.2M to $56.5M.
How Gabe, a B2B Growth Performance Marketer, reduced PPC reporting time by 60% with AI and Coupler.io at Right Percent
Industry
Marketing Consulting
What we did
Connected Meta Ads and Looker data to Claude AI for conversational AI analytics
Outcomes
• 60% time saved on PPC data analysis and reporting
• Daily campaign reviews require less than 10 minutes
• Faster & more confident decisions on campaigns managing $1M+ monthly spend
• Daily campaign reviews require less than 10 minutes
• Faster & more confident decisions on campaigns managing $1M+ monthly spend
Background / Overview
Challenge
Gabe needed faster, smarter ways to analyze performance and make decisions while performance shifts were happening daily. His existing workflow with Supermetrics was slowing him down, making it difficult to keep pace with rapidly changing performance data across key activities:
• daily CPL monitoring
• creative fatigue analysis
• weekly stakeholder reporting
• forecasting
• test analysis
With high spend and many live ads, delays meant missed opportunities and wasted budget.
Solution
Using Coupler.io AI Integrations, Gabe connected Meta Ads (Facebook Ads and Instagram Ads) and Looker data directly to Claude for conversational analytics without pushing raw datasets into the LLM.
Coupler.io’s Analytical Engine provides Claude with the data structure (column names, data types, and sample rows) so the model understands what’s available. When Gabe asks a question in plain English, Claude generates a query and sends it to Coupler.io. The Analytical Engine then:
• executes the query
• runs calculations and aggregations
• validates outputs
• returns only the verified results back to Claude

Gabriel Solberg
B2B Paid Growth Performance Marketer
“I’m not getting AI’s best guess. Coupler.io does the actual math. Claude just helps me ask the right questions and understand the results conversationally.
Use cases
Together, these workflows let Gabe move from manual spreadsheet work to repeatable, on-demand dynamic analysis while keeping accuracy and business context front and center.
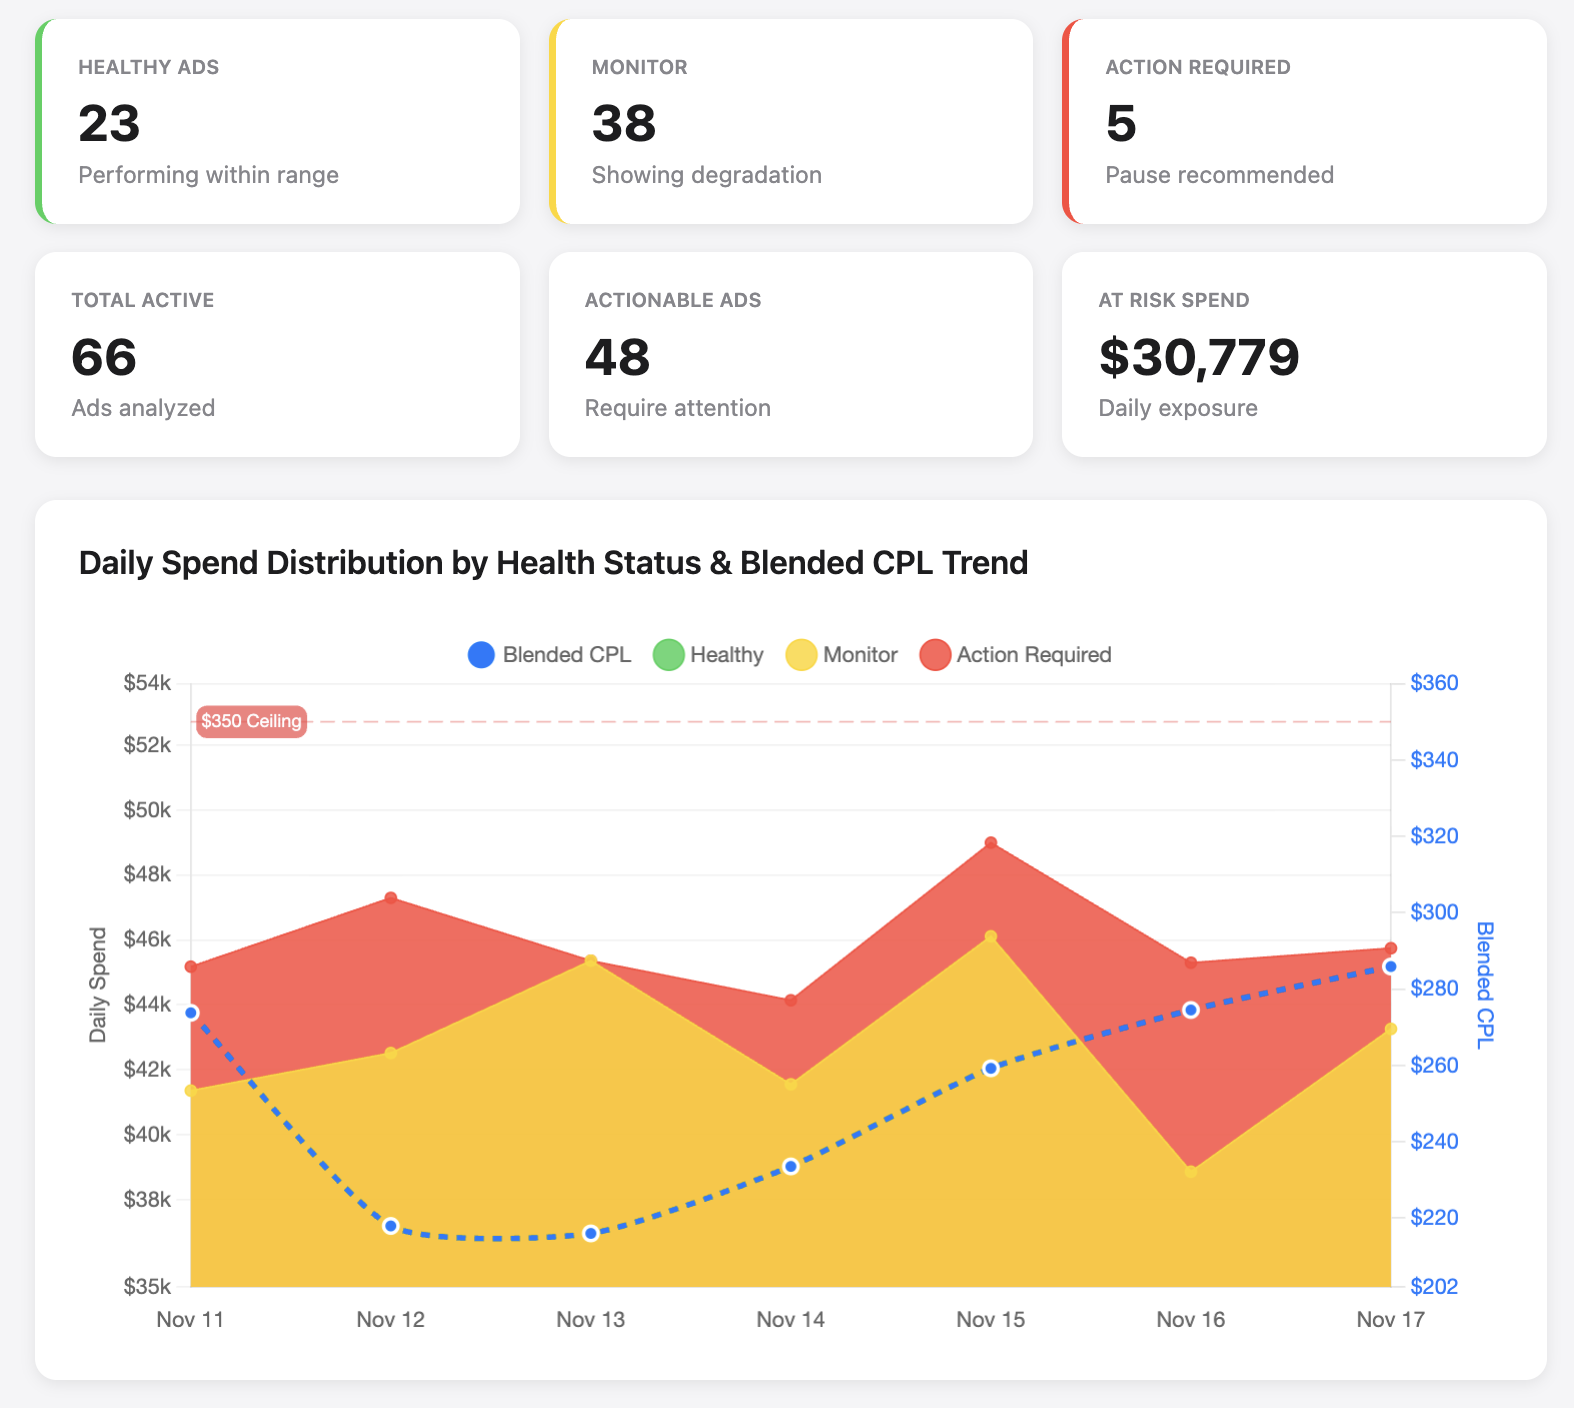
1) Daily Performance Health Checks
Challenge: With $40,000+ in daily spend across 50+ live ads, Gabe needs to spot issues before they burn the budget.
Solution: He runs a daily CPL “account health” report in Claude and gets an immediate read on trends and direction.
Impact: What used to take manual stitching across sources now takes under 10 minutes.
2) Weekly Performance Reporting
Challenge: Stakeholder check-ins require clear performance narratives backed by reliable numbers.
Solution: Gabe uses templated reports saved as Claude artifacts that are easily updated, then refined with his strategic context.
Impact: “Rather than madly hacking data together, I can actually spend time strategically thinking about what’s going on.”
See example artifact here.
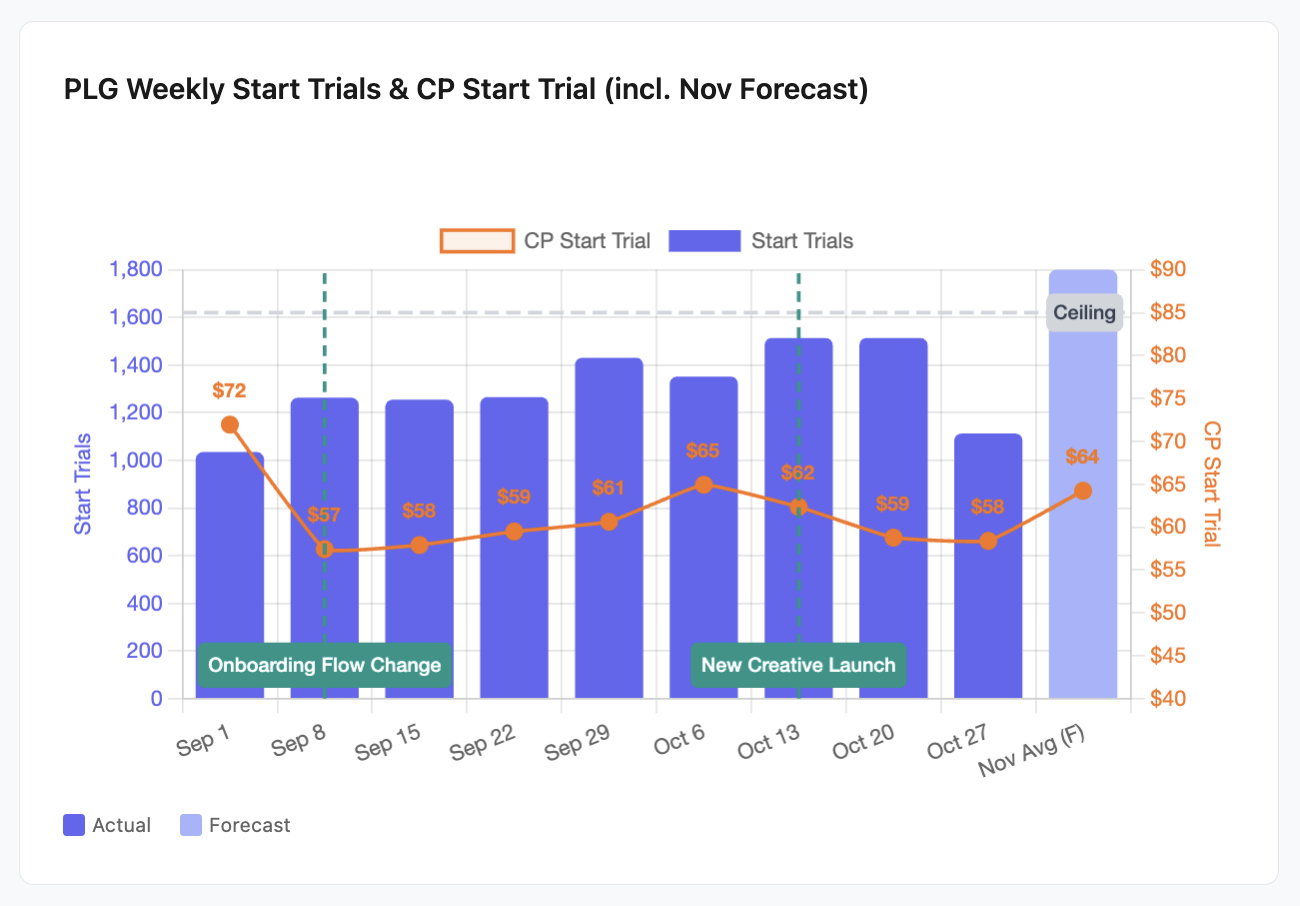
3) Ad Creative Fatigue Detection
Challenge: Performance degrades over time, but Meta can continue spending on yesterday’s winners. With high daily spend, one slipping ad can waste $5,000+ before it’s caught.
Solution: Gabe runs a 7 and 3 day rolling fatigue analysis to detect early downward trends—faster than static 7-day lookbacks.
Impact: He pauses declining ads sooner, preventing wasted spend and catching issues the platform doesn’t surface quickly.
See example artifact here.
4) Analysis & Optimization
Challenge: Controlled tests require careful interpretation of nuances, anomalies, edge cases, and parameters.
Solution: Gae writes the test context in a short Google Doc paragraph and feeds it into Claude which then provides an educated analysis and next-step recommendations.
Impact: He spot-checks totals against source data and updates his project instructions when data structure issues appear.
5) Reusable Analysis Library
Workflow: Gabe maintains a library of saved artifacts inside his Claude project, each one includes outputs and the logic behind them.
How it works:
• He saves high-value analyses as artifacts using a naming convention
• In new chats, he asks Claude to list project artifacts
• He reruns the analysis with fresh data instantly
Impact: Repeatable, scalable reporting without rebuilding queries from scratch.
See example artifact here.
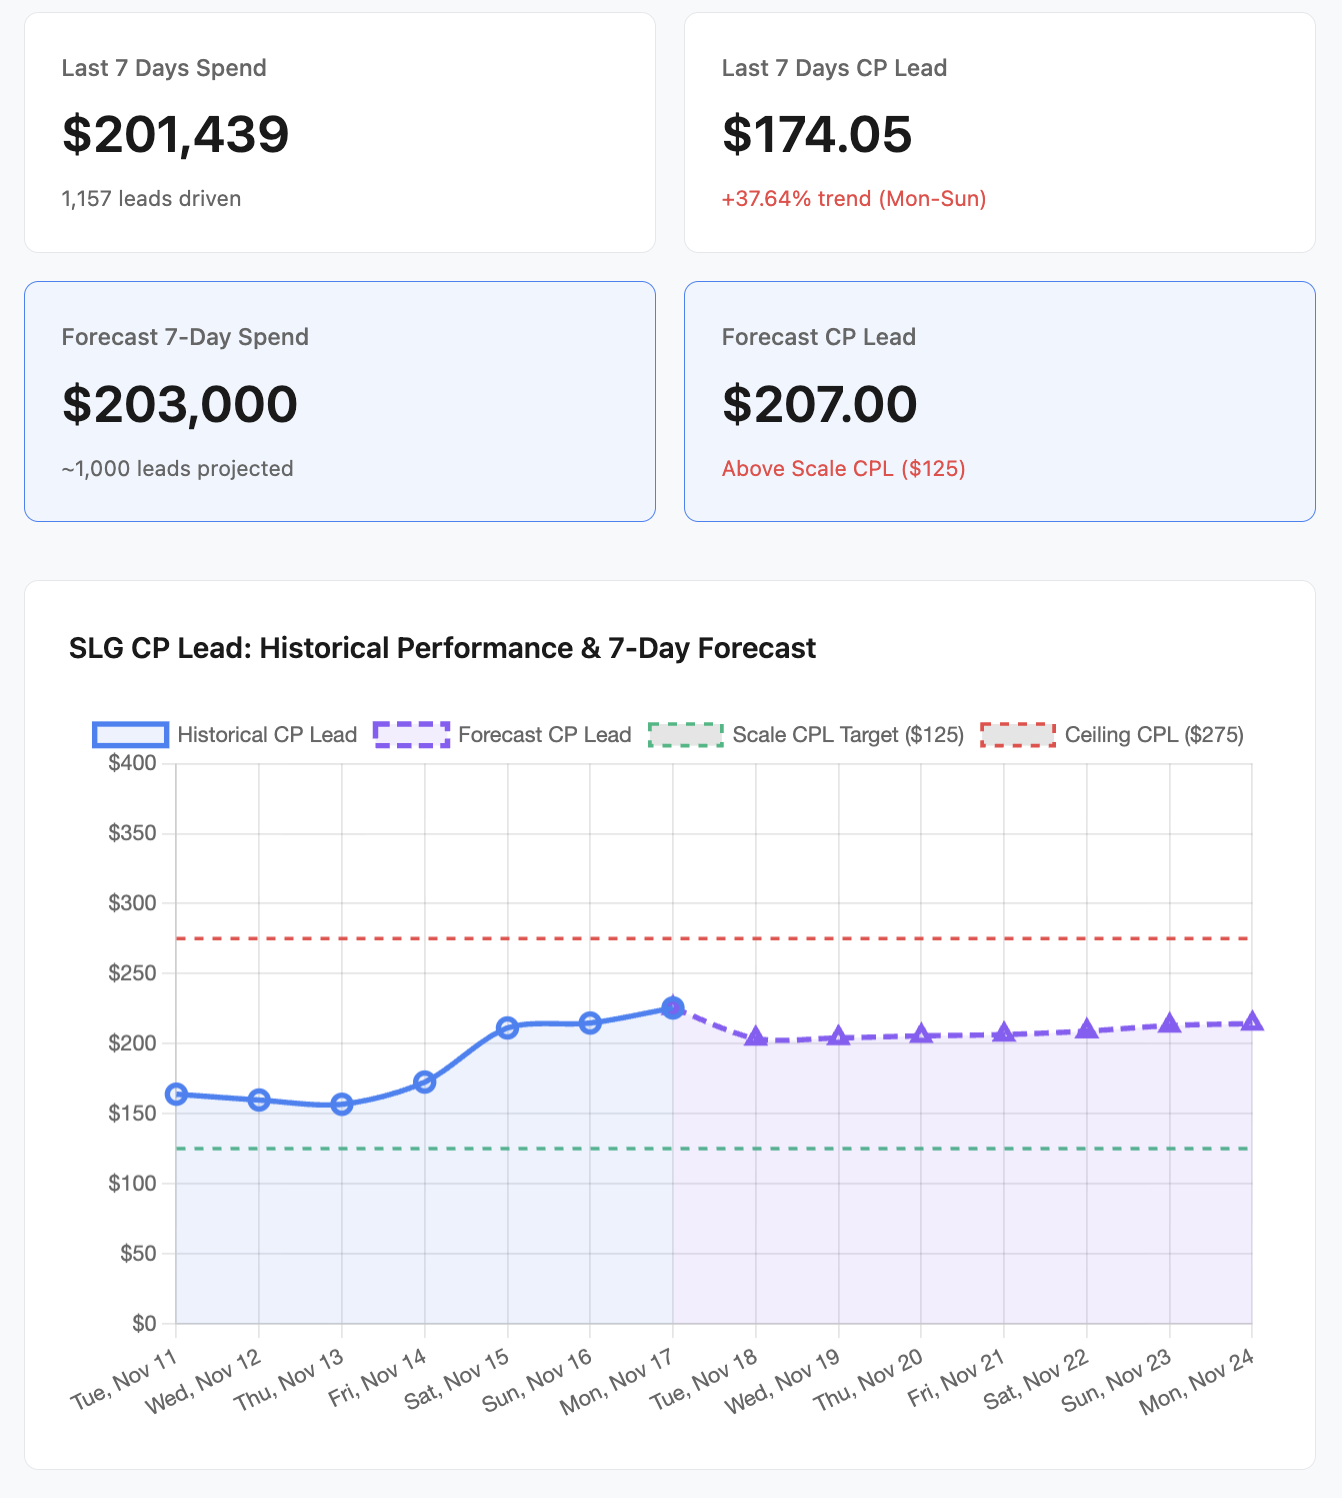
6) Financial Forecasting for Stakeholders
Challenge: Executives need reliable “where will we land?” forecasting, usually dependent on complex spreadsheet models and constant manual refreshes.
Solution: Gabe created forecasting templates that project end-of-month and end-of-quarter performance from current spend and trends, runnable on demand.
Impact: Forecasting that used to take hours now happens in minutes and can be refreshed as conditions change.
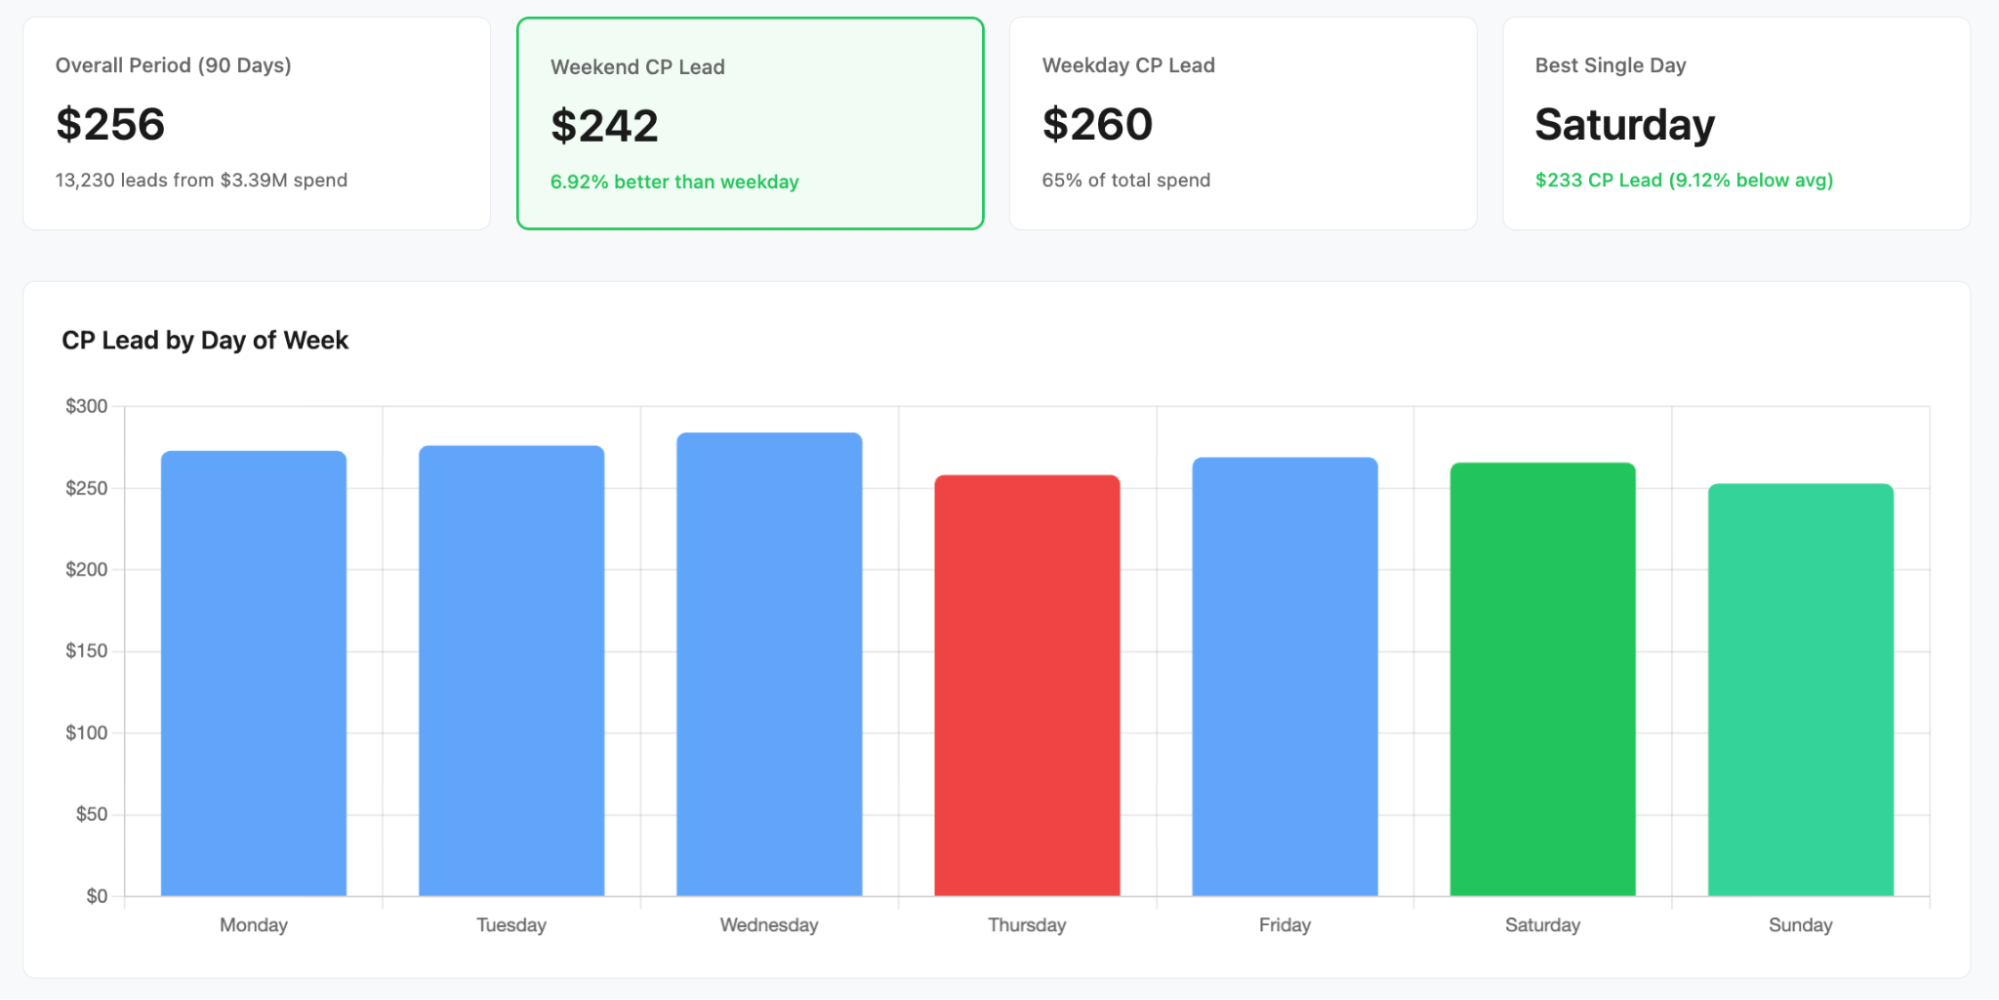
7) Ad Hoc Lookback Analysis
Challenge: Meetings trigger questions like “What happened here?” Previously, this required spreadsheet wrangling and time-consuming manual data pulls.
Solution: Gabe writes the business context and hypotheses in plain language, then uses Claude to generate the analysis grounded in Coupler.io-queried data.
Impact: Structured performance data + unstructured business context produces analysis that’s both fast and decision-ready.
See example analysis here.
Results
Because analyses that once took hours now take minutes, Gabe runs them far more frequently, often daily. He’s built a repeatable system spanning health checks, reporting, fatigue detection, test analysis, forecasting, and deep-dive lookbacks. He validates accuracy with domain expertise and spot-checking, using Claude Opus 4.5 with extended thinking enabled for more rigorous analysis.
Want to build this yourself? Gabe turned his workflow into a free course. Vibe Reporting walks you through the exact five-step setup he uses to manage $1M+ in monthly spend with AI.
Gabriel Solberg
B2B Paid Growth Performance Marketer
“Performance marketing is not and never was a static workflow. Being able to connect my performance data across sources to an LLM with Coupler.io creates a truly dynamic AI workflow across reporting, analysis, and forecasting that not only makes me faster but exponentially better at what I do…I like to call this vibe reporting.
Outcomes:
• ⏱ 60% time savings on data analysis and reporting
• 📊 Daily insights in minutes instead of hours
• 💰 Faster decisions on campaigns with $1M+ monthly spend
• 🔄 Scalable analysis that maintains quality as accounts grow
• 📈 Reliable forecasting for C-suite stakeholders
Ready to save hours of work?
Request data service