Microsoft (Bing) Ads dashboard examples and reporting templates
Gain clear visibility into your Microsoft Ads performance with automated Bing Ads dashboards that consolidate data across campaigns, ad groups, and timeframes. Track key metrics like clicks, impressions, spend and conversions, compare performance trends, and manage your ad budget effectively with visualizations that update automatically from your Microsoft (Bing) Ads account.
Bing Ads dashboard examples for every need


 +3
+3


 +6
+6


 +5
+5

 +6
+6

 +3
+3
 +4
+4
 +4
+4
 +2
+2

 +2
+2

 +5
+5
 +4
+4
 +5
+5
 +5
+5
 +3
+3

 +1
+1
 +3
+3

 +1
+1
 +3
+3
 +3
+3
 +2
+2

 +1
+1

 +1
+1


 +2
+2
 +3
+3

 +4
+4


about your case. It doesn't cost you a penny 😉
Choose your white label Bing Ads dashboard to kick off
What is a Bing Ads dashboard?
Modern Microsoft (Bing) Ads dashboards go beyond static reports by automatically refreshing data through Coupler.io's connectors, ensuring you're always working with the most current information. They enable you to filter performance by campaign, ad group, country, network, and device type, while tracking crucial metrics like impressions, clicks, spend, conversions, CTR, CPC, and CPM. This consolidated view helps identify trends, optimize campaigns, and make informed budget decisions without manually exporting and analyzing data.

What reports should be included on a meaningful Microsoft Ads dashboard?
A well-structured Microsoft Ads dashboard should incorporate several essential reports that deliver actionable insights for campaign optimization. Based on our analysis of high-performing Bing Ads dashboards, we recommend including these four critical report types:
The campaign performance report provides a detailed analysis of individual campaign effectiveness through key metrics like clicks, conversions, CPC, and total spend. This structured view enables straightforward comparison between campaigns, highlighting top performers and identifying underperforming ads that need optimization. The report typically includes trend data over time, allowing you to spot anomalies and measure the impact of recent changes to improve results and ROI.
This report visualizes how your key performance indicators fluctuate over time through a series of line charts. It shows the dynamics of impressions and CPM, clicks and CPC, conversions and cost per conversion, and ad spend patterns. These visualizations help you identify cost-effective campaigns, detect inefficiencies in your advertising approach, and optimize budget allocation. By tracking these metrics over time, you can correlate performance changes with campaign adjustments and external factors.
The budget management report tracks the monthly dynamics of spending on advertising compared to your allocated budget across all ad platforms, including Microsoft Ads. It provides detailed breakdowns by platform, showing exactly where your money goes and helping identify potential overspending. The report includes visualizations of daily costs, monthly spend patterns, and predictions for current month expenditure, enabling you to maintain financial control while maximizing advertising effectiveness.
This report enables a side-by-side analysis of performance across multiple advertising platforms, including Bing Ads, Google Ads, and social media channels. It displays unified metrics for impressions, clicks, CTR, CPC, and conversions across all connected ad accounts, making it easy to identify which platforms deliver the best results for your budget. By comparing campaign performance across platforms, you can optimize your overall digital advertising strategy and allocate resources to the most effective channels.
What insights you can get with the Microsoft (Bing) Ads reporting dashboard
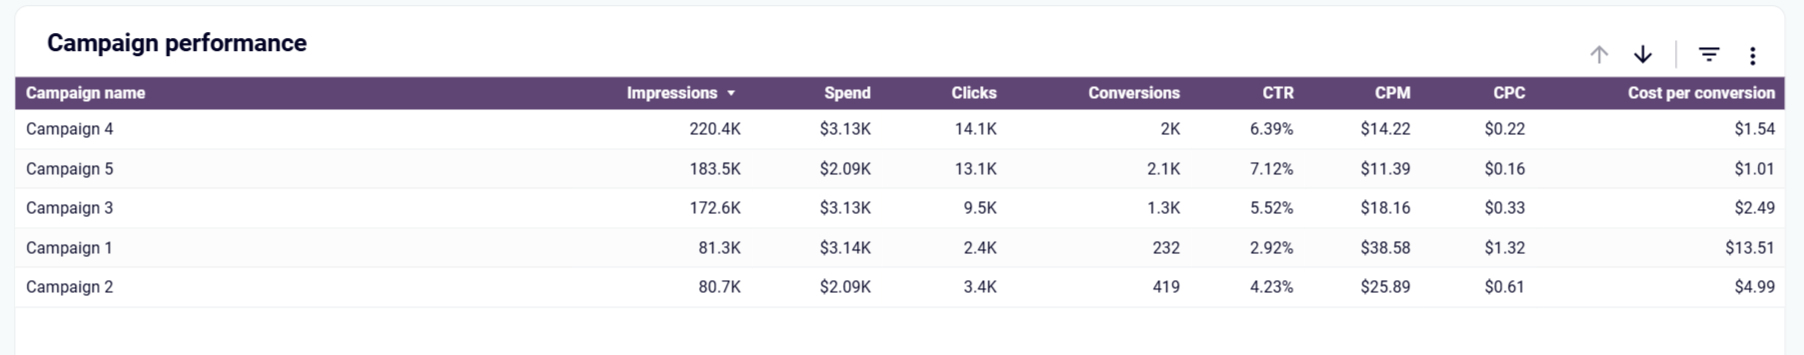
The Microsoft Ads dashboard provides a comprehensive breakdown of each campaign's performance through key metrics like clicks, conversions, CPC, and more. This structured view allows you to quickly assess which campaigns deliver the best results and identify those needing optimization. With the ability to filter by ad group, country, and device type, you can drill down into specific segments to understand performance nuances across different audience segments.
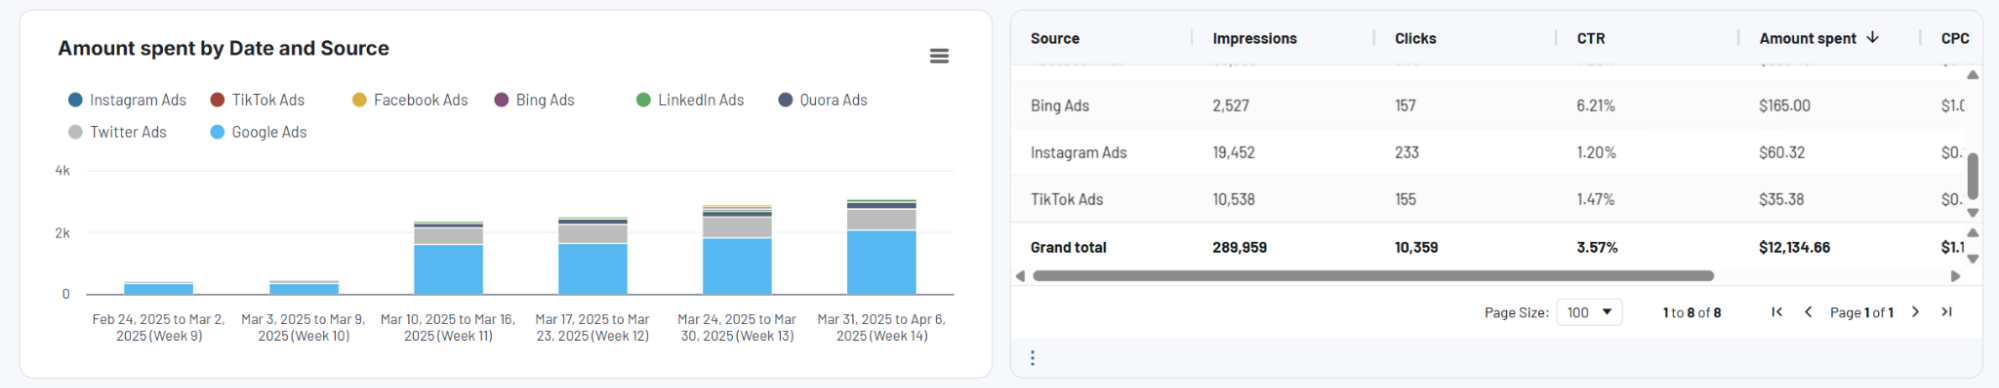
The PPC multichannel dashboard visualizes spending by date, source, and campaign type, helping you track how your budget is being utilized across different platforms, including Microsoft Ads. You can identify which campaigns or ad groups consume the largest portions of your budget and whether that spending correlates with strong performance. This insight is essential for maintaining cost efficiency and ensuring your advertising budget is allocated to high-performing initiatives.
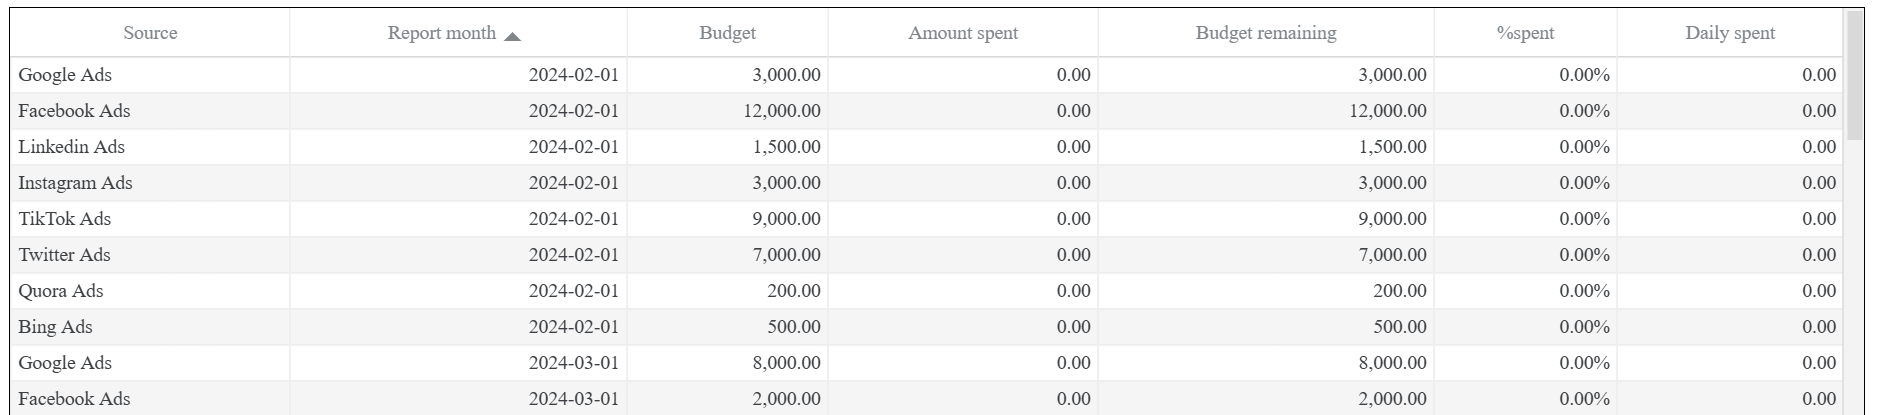
With a detailed budget and cost breakdown by ad platform, you can see exactly how your advertising budget is distributed between Microsoft Ads and other channels. The dashboard highlights where you might be over or under budget, tracks average daily costs, and provides monthly comparisons. This comprehensive view helps prevent budget overruns while ensuring sufficient investment in the platforms that deliver the best results for your business.
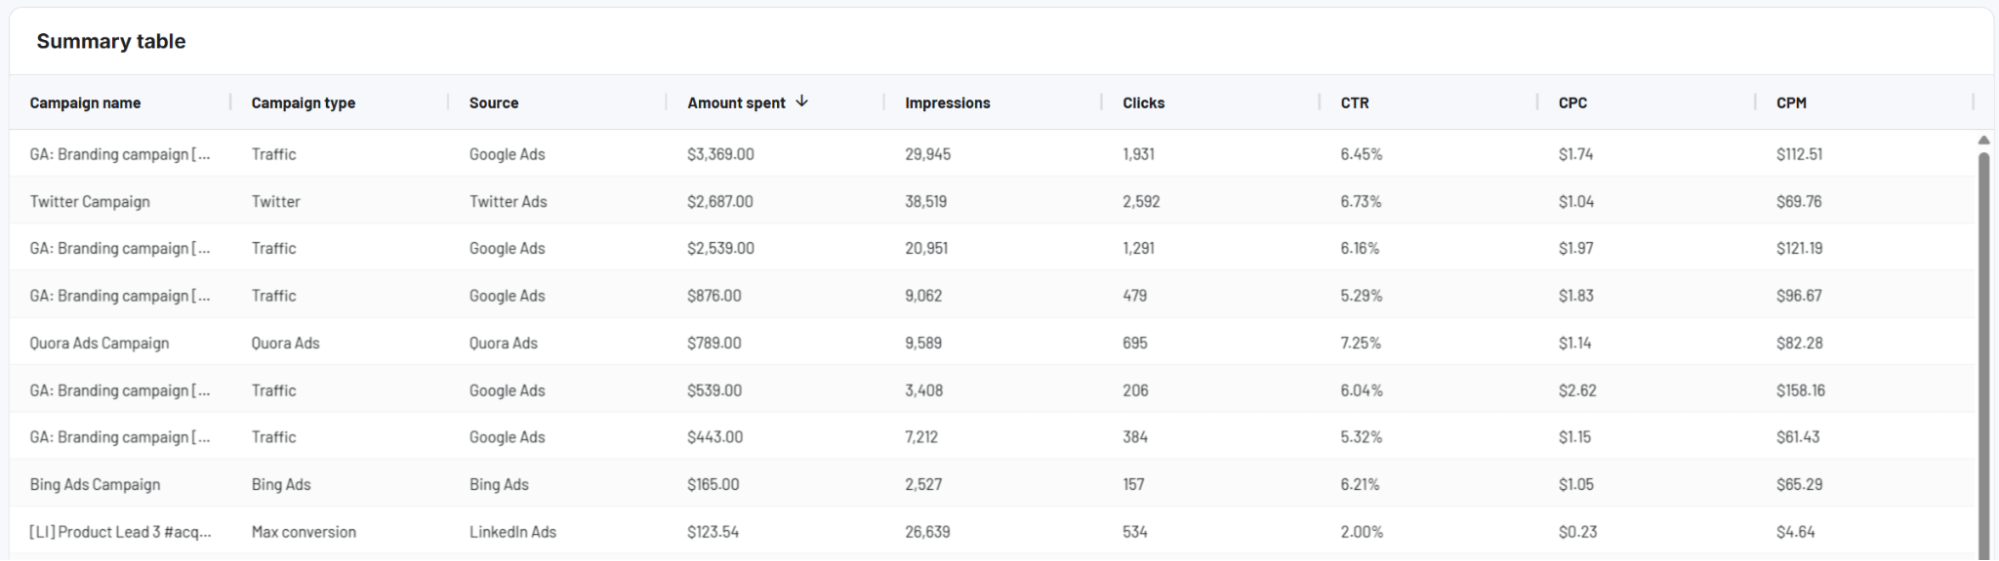
The dashboard enables side-by-side comparison of campaign performance across different platforms, including Bing Ads, Google Ads, and social media channels. By analyzing metrics like impressions, clicks, CTR, and conversions in a unified view, you can quickly identify which platforms deliver the best results for similar campaigns. This cross-platform insight helps optimize your overall digital advertising strategy and informs decisions about budget allocation.
How to create a Bing Ads dashboard?

Metrics you can track with a Microsoft (Bing) Ads dashboard template
Track how many times your ads were shown to potential customers across different campaigns, ad groups, and timeframes. The dashboard visualizes impression data through trend charts, allowing you to identify seasonal patterns, campaign performance shifts, and the impact of optimization efforts. This fundamental visibility metric forms the baseline for evaluating your Microsoft Ads reach and campaign effectiveness.
Monitor the number of times users interact with your ads by clicking on them. The dashboard presents click data alongside other metrics, helping you understand engagement levels across campaigns and time periods. By analyzing click patterns, you can identify which ad content, messaging, and targeting approaches resonate most with your audience, informing future creative and strategic decisions.
Track your total advertising expenditure across campaigns, ad groups, and date ranges. The dashboard visualizes spending patterns over time, highlighting how your budget is distributed and where adjustments might be needed. This metric is essential for budget management, helping ensure your Microsoft Ads investments align with performance goals and business priorities.
Measure how efficiently your budget generates ad visibility by tracking the cost for every thousand impressions. The dashboard displays CPM alongside impression volume, helping identify which campaigns deliver the most cost-effective brand exposure. This metric is particularly valuable for awareness-focused campaigns where visibility is a primary objective before conversion.
Analyze how much you're paying for each click across different campaigns and ad groups. The dashboard shows CPC trends over time, enabling you to identify cost-efficient approaches and potential areas of overspending. By optimizing this metric, you can ensure maximum value from your Microsoft Ads budget while maintaining competitive positioning in the auction marketplace.
Monitor the percentage of impressions that result in clicks to gauge ad relevance and appeal. The dashboard tracks CTR fluctuations over time and across campaigns, helping you identify which messaging and targeting strategies generate the strongest audience interest. This engagement metric serves as a key indicator of ad quality and effectiveness in reaching your intended audience.
Track the number of valuable actions users take after clicking your ads, whether purchases, sign-ups, downloads, or other desired outcomes. The dashboard visualizes conversion data across campaigns and timeframes, helping you identify which approaches drive meaningful business results. By focusing optimization efforts on high-converting campaigns, you can maximize the return on your Microsoft Ads investment.
Measure how much you're spending to acquire each conversion, providing insight into advertising efficiency and ROI. The dashboard displays this metric alongside conversion volume, helping identify campaigns that deliver the best value. By optimizing toward lower cost per conversion while maintaining quality, you can stretch your budget further and improve overall campaign profitability.
Track what percentage of available impressions your ads are capturing in the Microsoft Advertising ecosystem. The dashboard shows impression share changes over time, helping you understand market opportunity and competitive positioning. This metric reveals whether budget constraints or quality issues might be limiting your visibility, guiding decisions about bid adjustments and campaign improvements.
Monitor where your ads appear in search results and how position correlates with performance. The dashboard visualizes position data alongside other metrics, helping you determine the optimal balance between visibility and cost efficiency. This insight allows you to make strategic bidding decisions that achieve the best placement for your specific campaign objectives without unnecessary spending.
Analyze the typical placement of your ads in search results across campaigns and time periods. The dashboard tracks how average position fluctuates in response to bid changes, quality improvements, and competitive factors. By monitoring this trend alongside performance metrics, you can develop bidding strategies that maintain effective positioning while optimizing budget allocation across your Microsoft Ads campaigns.