X (Twitter) Ads dashboard examples and reporting templates
Get complete visibility into your campaigns with automated Twitter Ads dashboards that track performance metrics, compare results across platforms, analyze audience engagement, and forecast advertising budgets. Make data-driven decisions to optimize your X ads spending and maximize your social media advertising ROI.
X (Twitter) Ads dashboard examples for every need


 +3
+3


 +3
+3
 +1
+1
 +4
+4
 +4
+4

 +2
+2

 +2
+2

 +5
+5

 +4
+4
 +5
+5
 +5
+5
 +3
+3
 +1
+1
 +3
+3
 +3
+3
 +3
+3
 +2
+2

 +1
+1

 +1
+1

 +2
+2
 +3
+3


about your case. It doesn't cost you a penny 😉
Choose your white label Twitter Ads dashboard to kick off
What is a Twitter Ads dashboard?
The Twitter Ads dashboard (also known as an X Ads dashboard) displays key performance indicators like impressions, clicks, conversions, spending trends, audience demographics, and platform comparisons. By automating data collection through Coupler.io, these dashboards eliminate manual reporting and provide real-time visibility into campaign effectiveness. This enables marketers to quickly identify high-performing content, optimize underperforming campaigns, and make data-backed decisions about budget allocation across both Twitter's main platform and its Publisher Network.

What reports should be included on a Twitter Ads KPI dashboard?
A well-designed Twitter Ads dashboard should include several key reports that provide a complete picture of your advertising performance. These reports work together to reveal not just basic metrics, but actionable insights that drive campaign optimization and better ROI.
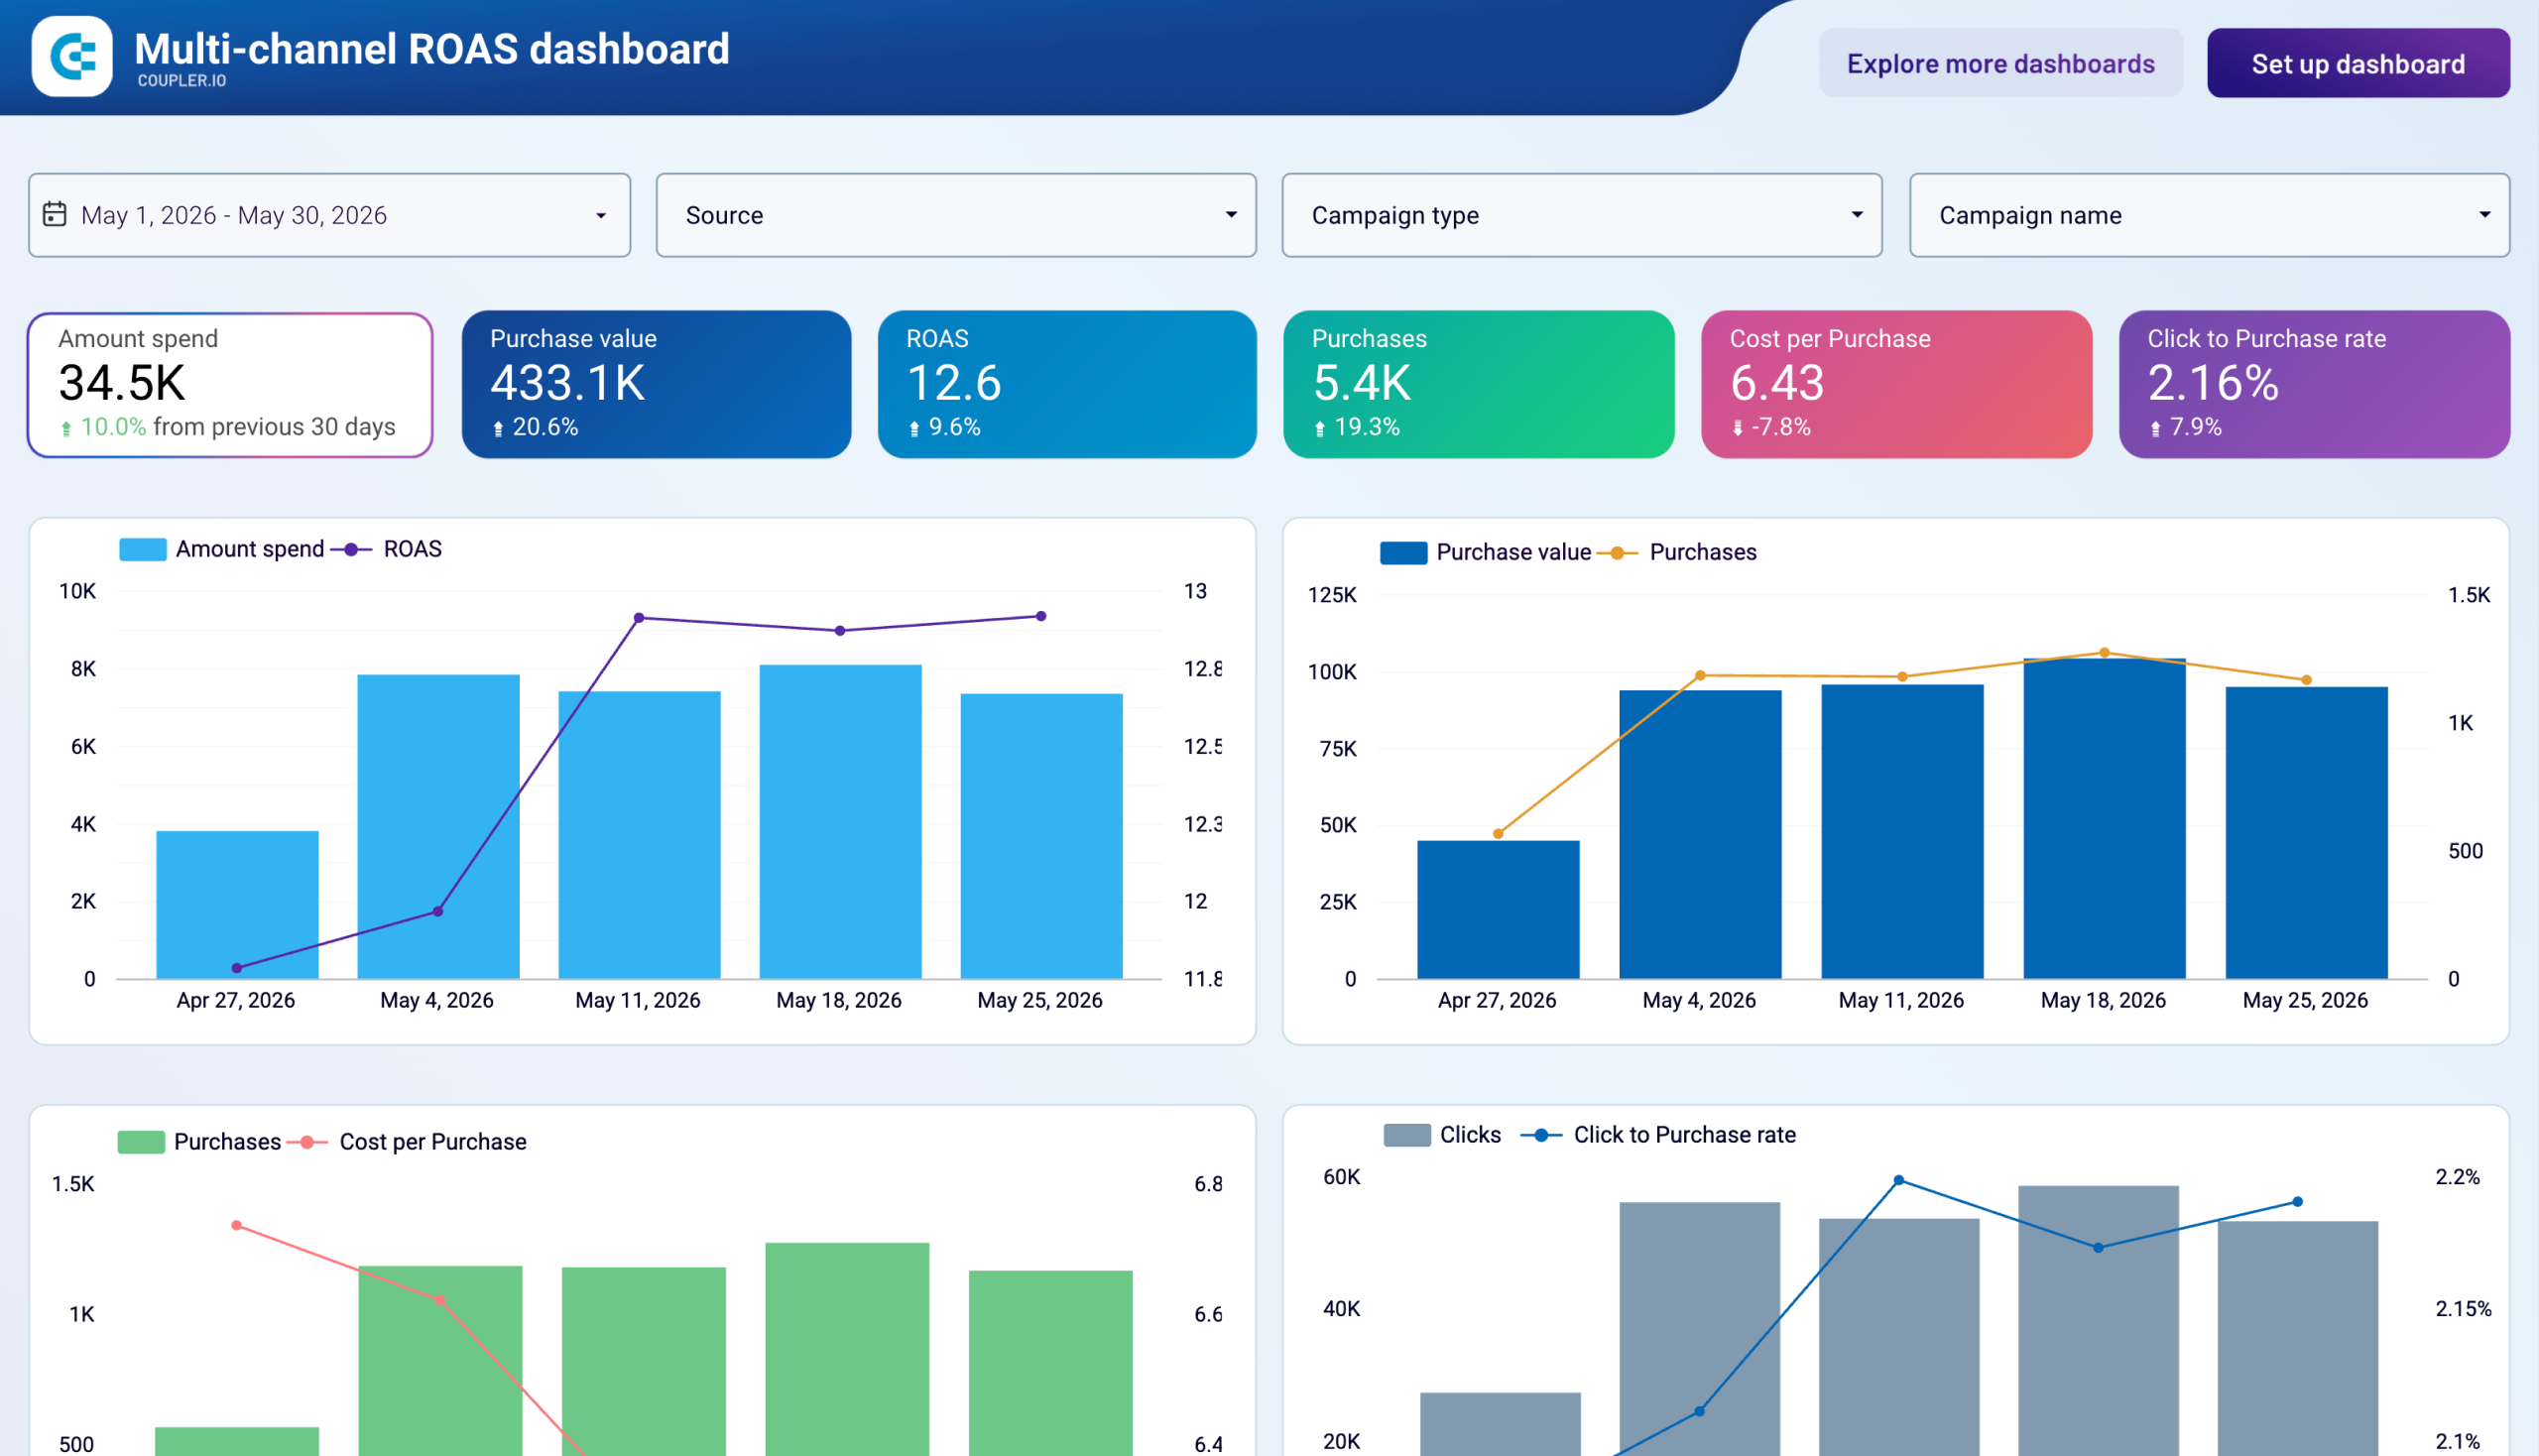
The performance metrics report forms the foundation of any effective Twitter Ads dashboard. It visualizes your complete marketing funnel from impressions to conversions, showing exactly how users progress through each stage of engagement. The report includes scorecards displaying essential campaign metrics like total spend, clicks, CTR, and conversion rates, with percentage changes compared to previous periods clearly indicated. This gives you immediate insight into campaign effectiveness and helps identify potential bottlenecks in your conversion path. The funnel visualization makes it easy to spot where potential customers drop off, enabling you to focus optimization efforts on specific stages of the customer journey.
The platform performance report provides critical insights into how your ads perform across different environments within the Twitter ecosystem. It allows you to filter data by campaign and placement to directly compare results between Twitter's main platform and its Publishers Network. The report displays metrics like impressions, clicks, and conversions for each platform side-by-side, helping you determine whether investing in Publishers Network provides sufficient return on investment. Additionally, the report includes a breakdown by device type (desktop, mobile, iOS, Android), showing which platforms convert best for your specific campaigns. This information is invaluable for balancing ad placement between high and low-performing platforms to maximize overall campaign effectiveness.
The cross-channel advertising report puts your Twitter Ads performance in context by comparing it with other advertising platforms like Facebook Ads, Google Ads, and LinkedIn Ads. This multi-platform view displays unified metrics like impressions, clicks, CTR, CPC, and total spend across all connected channels. With this holistic perspective, you can easily identify which platforms deliver the best performance for specific campaign objectives and adjust your budget allocation accordingly. The report includes trend charts showing performance over time, making it easy to spot correlations between campaigns across different platforms and understand how Twitter Ads contribute to your overall digital marketing strategy.
The budget and forecasting report provides financial oversight and predictive insights for your Twitter advertising campaigns. It tracks daily and monthly spending patterns, comparing actual expenditure against allocated budgets to prevent overspending. The report includes projection models that forecast future performance based on historical data, helping you set realistic campaign goals and determine the budget needed to achieve specific targets. Color-coded alerts signal when campaigns risk exceeding their budgets, allowing for timely adjustments. This financial intelligence enables more strategic resource allocation, ensuring your Twitter Ads spending delivers maximum value while staying within planned parameters.
What insights you can get with the X (Twitter) Ads reporting dashboard
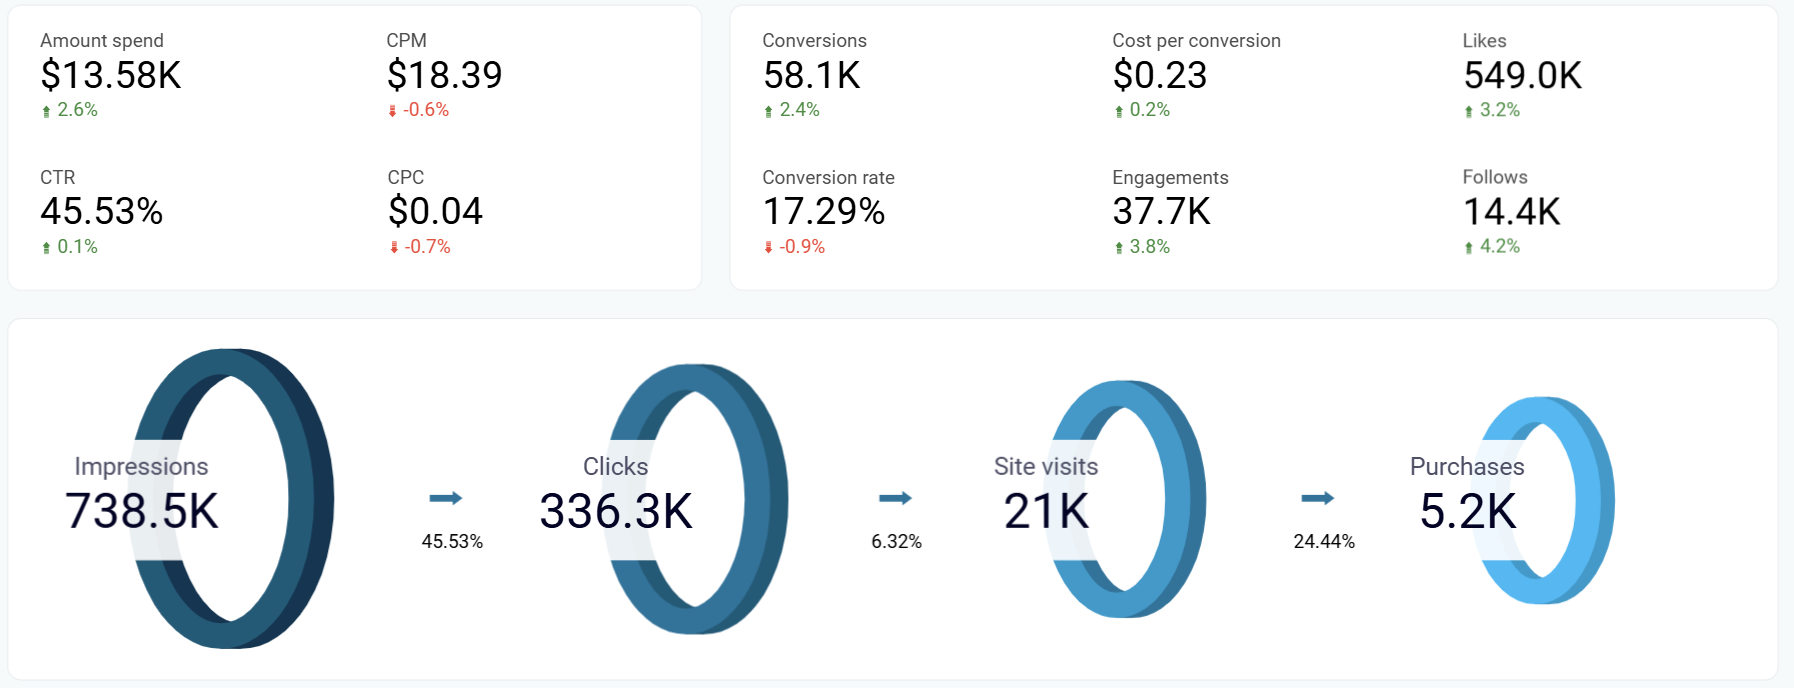
The X Ads dashboard provides a complete visualization of your marketing funnel, showing how impressions convert to clicks and ultimately to conversions. This gives you immediate understanding of where potential customers drop off in the journey, allowing you to identify bottlenecks in your campaign structure. With this insight, you can make targeted improvements to underperforming stages, whether it's enhancing ad creative for better click-through rates or optimizing landing pages to increase final conversions.
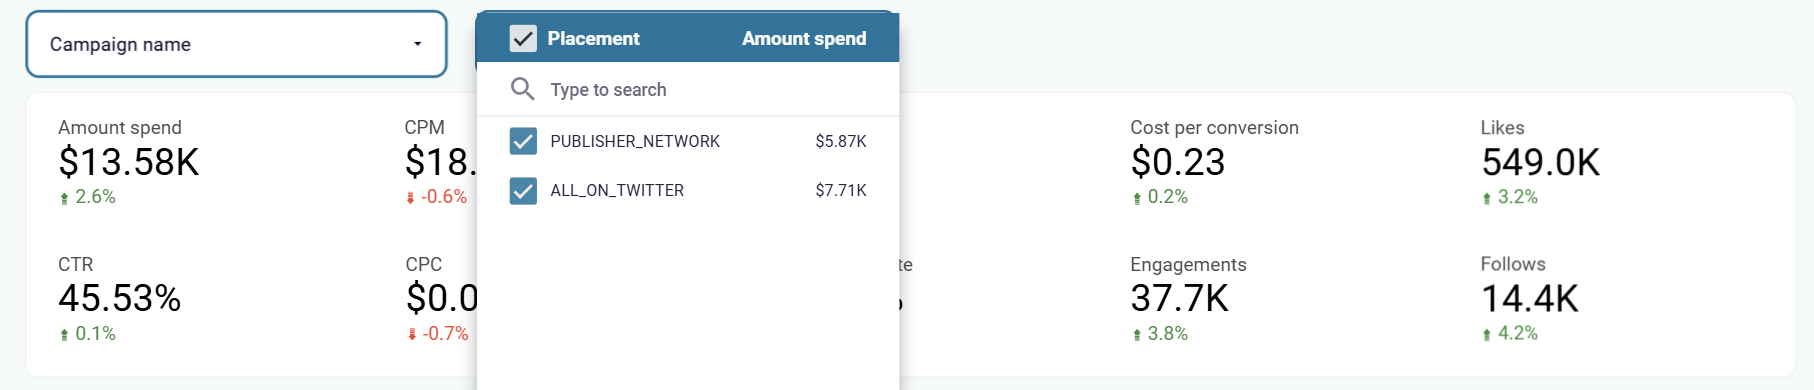
The X Ads dashboard allows you to filter performance data by campaign and placement, letting you directly compare how your ads perform on Twitter versus Publishers Network. With clear metrics on impressions, clicks, and conversions for each platform, you can make informed decisions about where to focus your budget. If Publishers Network shows lower engagement rates despite similar impression numbers, you can reallocate resources to the main Twitter platform for better returns.
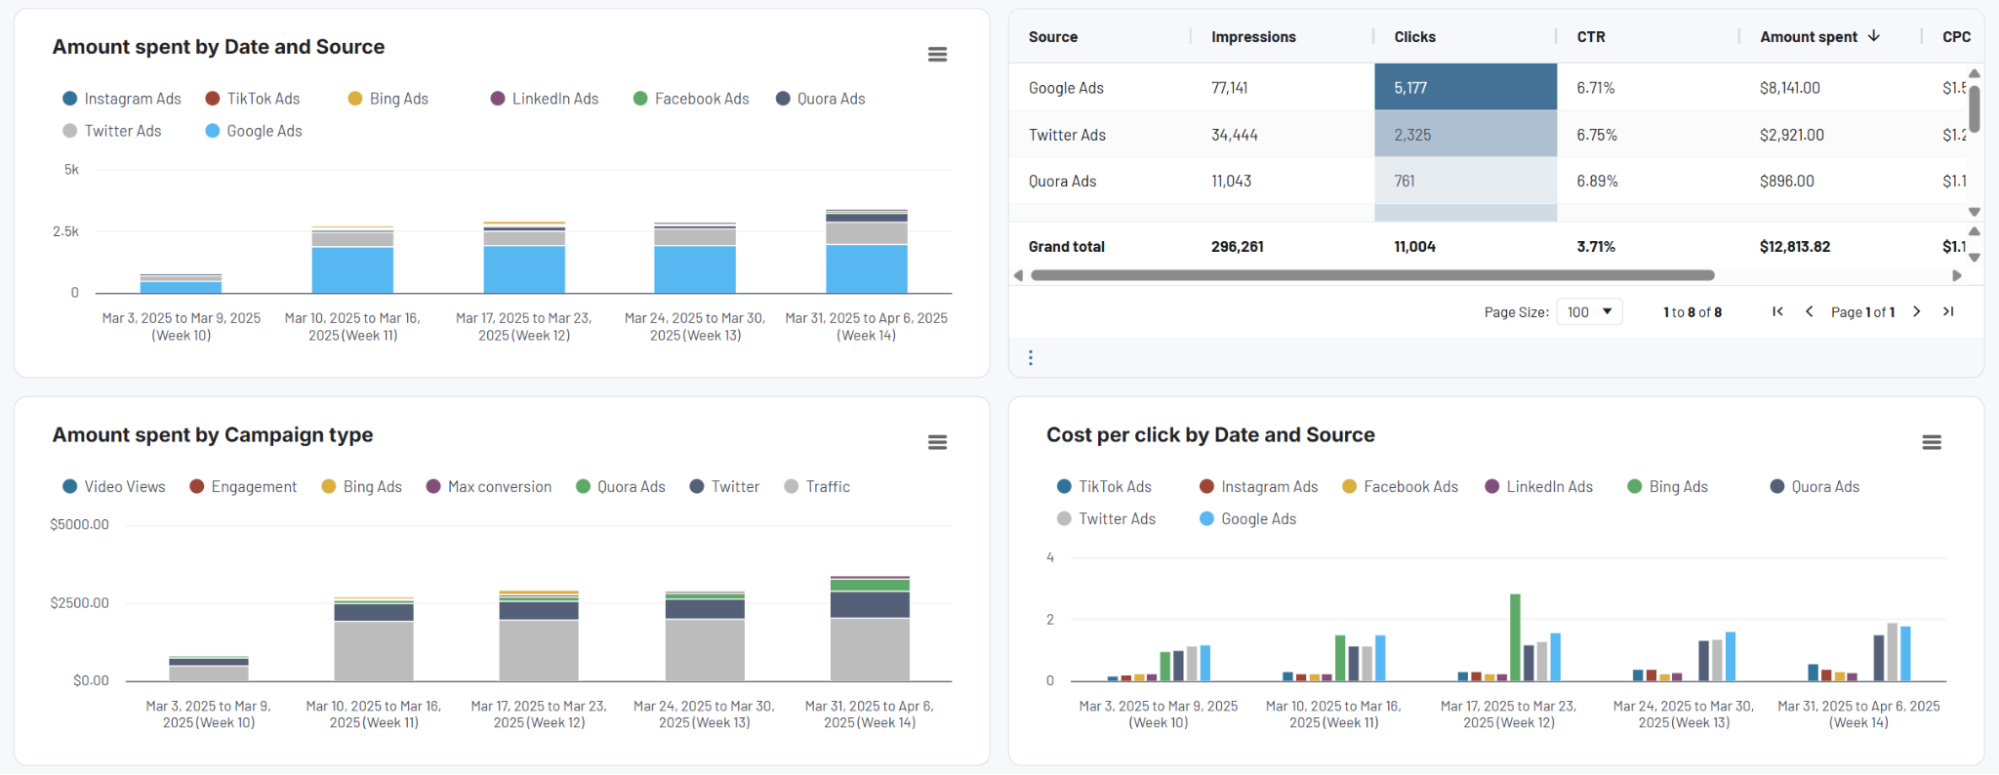
By comparing Twitter Ads performance against other advertising platforms like Facebook, Google, and LinkedIn, the dashboard reveals which channels deliver the best results for your specific goals. You can easily identify if Twitter drives higher engagement but lower conversions than other platforms, allowing you to adjust your cross-channel strategy accordingly. This comprehensive view prevents siloed decision-making and ensures your overall marketing budget is distributed for maximum impact.
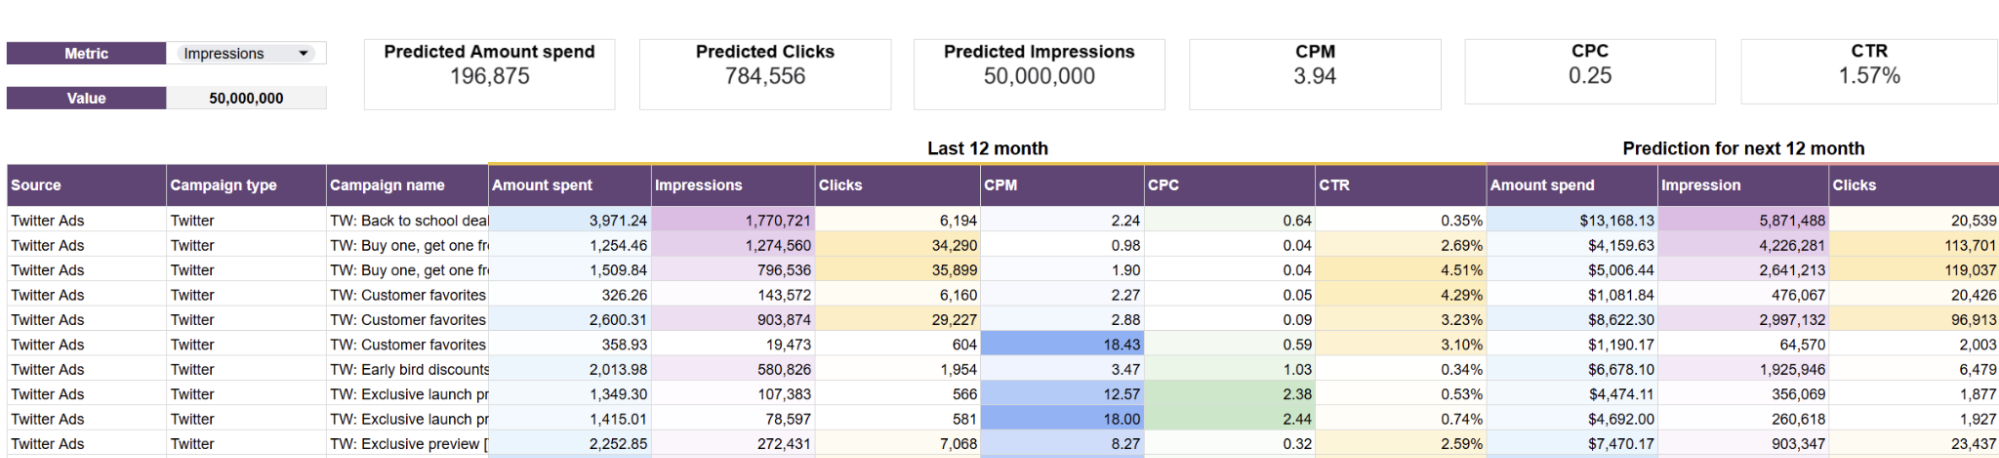
The dashboard's forecasting capabilities help predict future advertising outcomes based on historical performance data. By analyzing past spending patterns and results, you can project expected impressions, clicks, and spend for upcoming campaigns with greater accuracy. This predictive insight is invaluable for planning seasonal promotions, product launches, or quarterly budget allocations, ensuring you allocate sufficient resources to achieve your Twitter advertising goals.
How to create an X Ads dashboard?

Metrics you can track with an X (Twitter) Ads dashboard template
Monitor how many times your ads were displayed to Twitter users across both the main platform and Publishers Network. This visibility metric helps you understand your campaign's reach and provides context for engagement rates. When combined with audience demographic data, impressions help identify which segments of your audience are most frequently exposed to your content.
Track the number of users who clicked on your Twitter ads, providing a direct measure of how compelling your creative and messaging are to your target audience. By monitoring clicks alongside impressions, you can evaluate the effectiveness of different ad formats, copy variations, and calls-to-action to optimize engagement rates over time.
Measure the percentage of impressions that result in clicks, offering insight into how relevant and appealing your ads are to your target audience. A rising CTR indicates improving ad relevance or targeting, while declining rates may signal creative fatigue or audience saturation, helping you determine when to refresh campaign elements.
Monitor how much you're paying for each click on your Twitter ads, providing a clear measure of campaign efficiency. Tracking CPC over time helps identify bidding optimization opportunities and reveals which audience segments or creative approaches deliver the most cost-effective engagement for your advertising budget.
Track how many users complete desired actions after clicking your ads, broken down by device type (Android, iOS, desktop, mobile). This detailed view reveals which platforms drive the most valuable interactions with your content, allowing you to optimize ad placement and targeting parameters to focus on high-converting environments.
Visualize your daily and monthly advertising expenditure to identify spending patterns, spikes, or anomalies that may require attention. This financial tracking helps ensure budget compliance throughout campaign periods and reveals correlations between spending levels and performance outcomes to guide future budget allocation decisions.
Analyze campaign performance by country, age range, and gender to understand which audience segments respond best to your Twitter advertising. These demographic insights help refine targeting parameters for future campaigns and may reveal unexpected audience opportunities that warrant further exploration or dedicated campaign development.
Compare metrics between Twitter's main platform and its extended Publisher Network to determine the value of expanding your ad reach beyond Twitter itself. This comparison helps optimize where your ads appear based on performance data rather than assumptions, ensuring your budget is allocated to the environments that deliver the best results.