Stripe dashboard examples and reporting templates
Monitor your subscription business performance with an automated reporting solution that connects directly to your Stripe account. Track monthly recurring revenue, analyze customer retention patterns, evaluate subscription plan effectiveness, and make data-driven pricing decisions based on scheduled data updates from your billing platform.
Stripe dashboard examples for every need


about your case. It doesn't cost you a penny 😉
Choose your white label digital stripe dashboard to kick off
What is a Stripe dashboard?
The dashboard connects to your Stripe billing data through Coupler.io, which refreshes information on a schedule you define, ensuring your financial metrics remain current without manual exports or spreadsheet updates. This creates a centralized view of subscription health that helps SaaS businesses and membership platforms understand whether their growth comes from new customer acquisition or expanding value from existing subscribers.

What reports should be included in Stripe dashboards?
A well-structured Stripe dashboard should incorporate reports that address the complete spectrum of subscription business performance, from revenue patterns to customer behavior. Drawing from proven reporting frameworks for recurring revenue businesses, we recommend building your dashboard around these four analytical perspectives.
This report provides visibility into how different pricing tiers contribute to your total revenue over time. It displays monthly recurring revenue trends for each subscription plan through multi-line charts that show growth trajectories, complemented by percentage distribution visualizations that reveal which tiers dominate your revenue mix. A detailed breakdown table presents exact MRR values by plan for each period, enabling direct comparison of plan performance. This combination helps identify which pricing tiers are expanding, plateauing, or declining, informing decisions about where to focus product development, marketing campaigns, and sales resources for maximum impact on recurring revenue.
This report examines both the velocity of your business expansion and the quality of that growth. It combines monthly recurring revenue growth rate charts showing percentage increases or decreases over time with average revenue per user analysis that reveals how much each customer contributes to your bottom line. By monitoring these metrics together, you can determine whether revenue gains stem from acquiring more customers or from increasing the value extracted from your existing subscriber base. This distinction is fundamental for resource allocation decisions—whether to invest more heavily in acquisition channels or focus on expansion and upsell strategies within your current customer population.
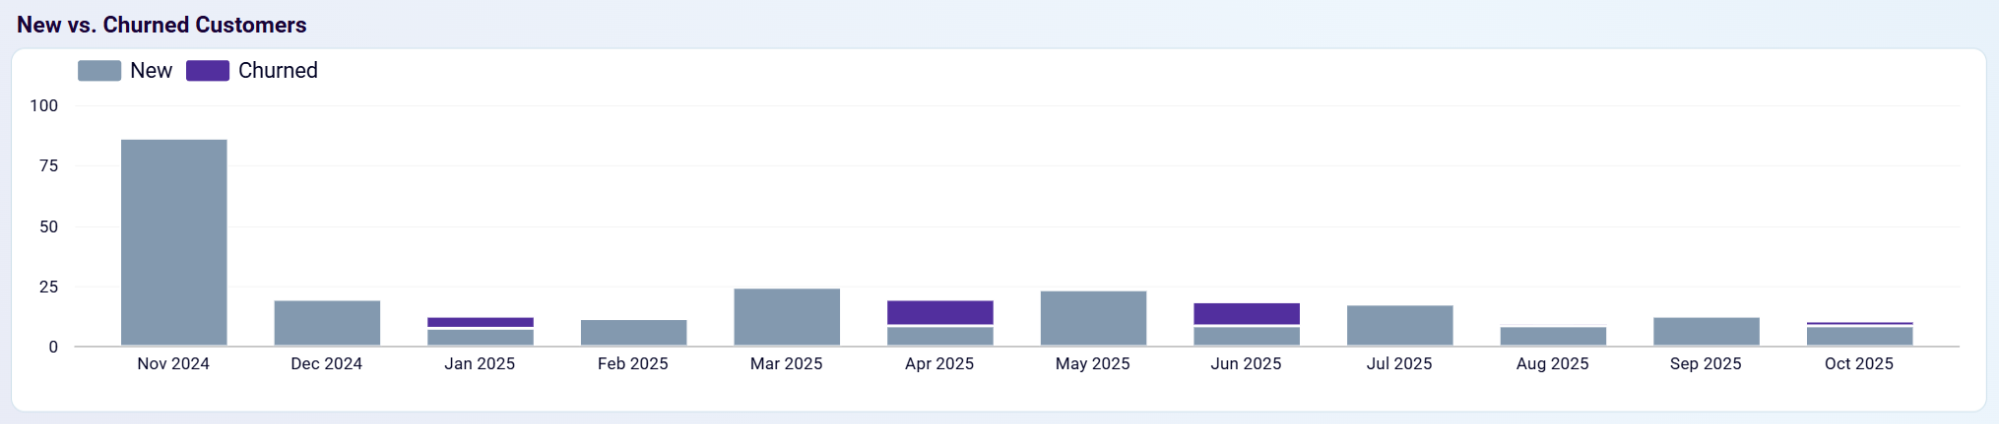
This report tracks the relationship between new subscribers gained and existing customers lost each period. It visualizes new customer counts alongside churned customer numbers in side-by-side comparisons that immediately reveal whether your subscriber base is expanding or contracting. When acquisition outpaces churn significantly, you're achieving strong net growth; when the gap narrows or reverses, it signals retention issues that require immediate attention. This report helps identify problematic periods that may correlate with pricing changes, product updates, or seasonal factors, enabling targeted retention interventions before customer loss accelerates and damages revenue stability.
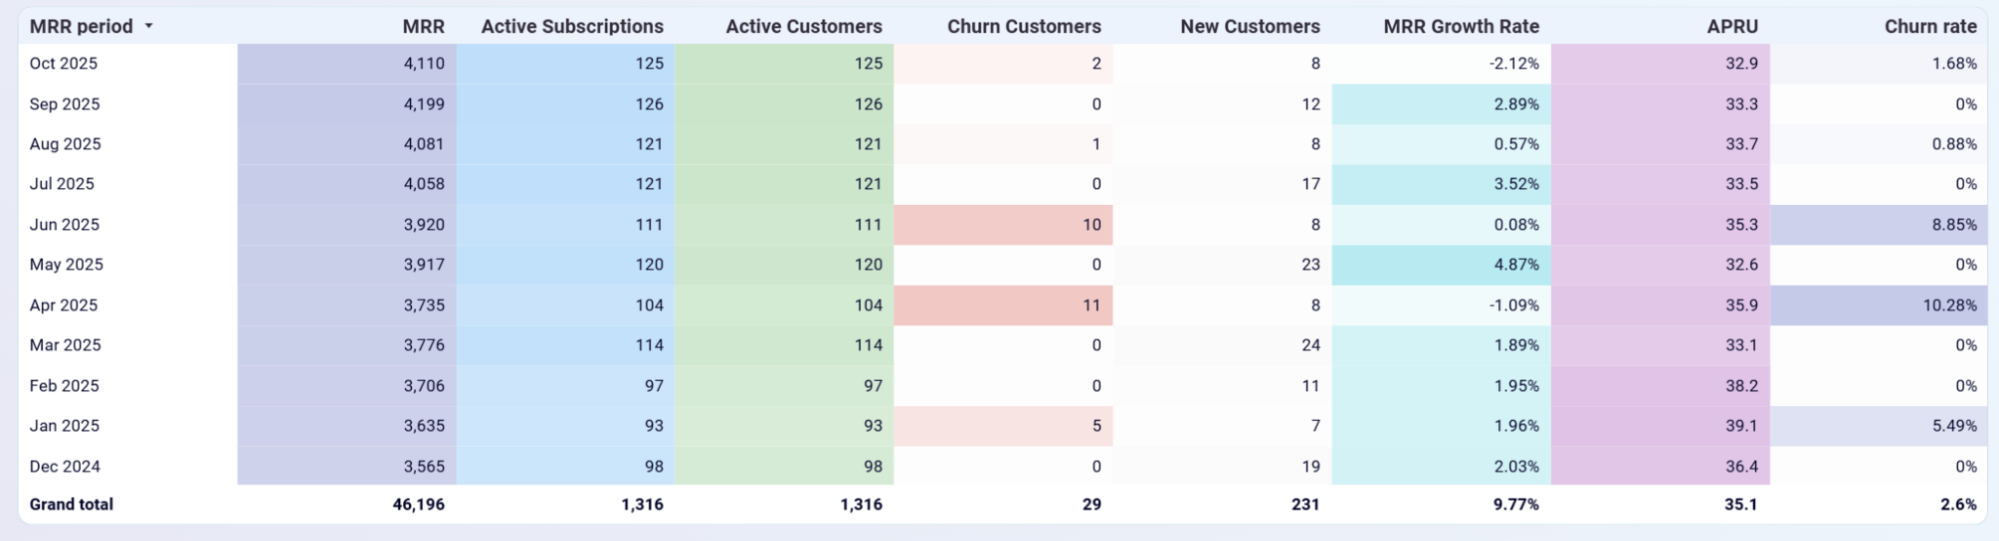
This report delivers a unified monthly view of all critical performance indicators in one consolidated table. It presents monthly recurring revenue, active subscriptions, active customers, churn figures, new customer acquisition, growth rates, average revenue per user, and churn percentages in a single reference that allows correlation analysis across metrics. You can spot patterns such as declining average revenue per user despite customer growth, or identify when churn rate spikes coincide with specific business events. This holistic perspective transforms isolated metrics into an interconnected story about subscription business health that drives strategic decision-making.
What insights you can get with the Stripe reporting dashboard
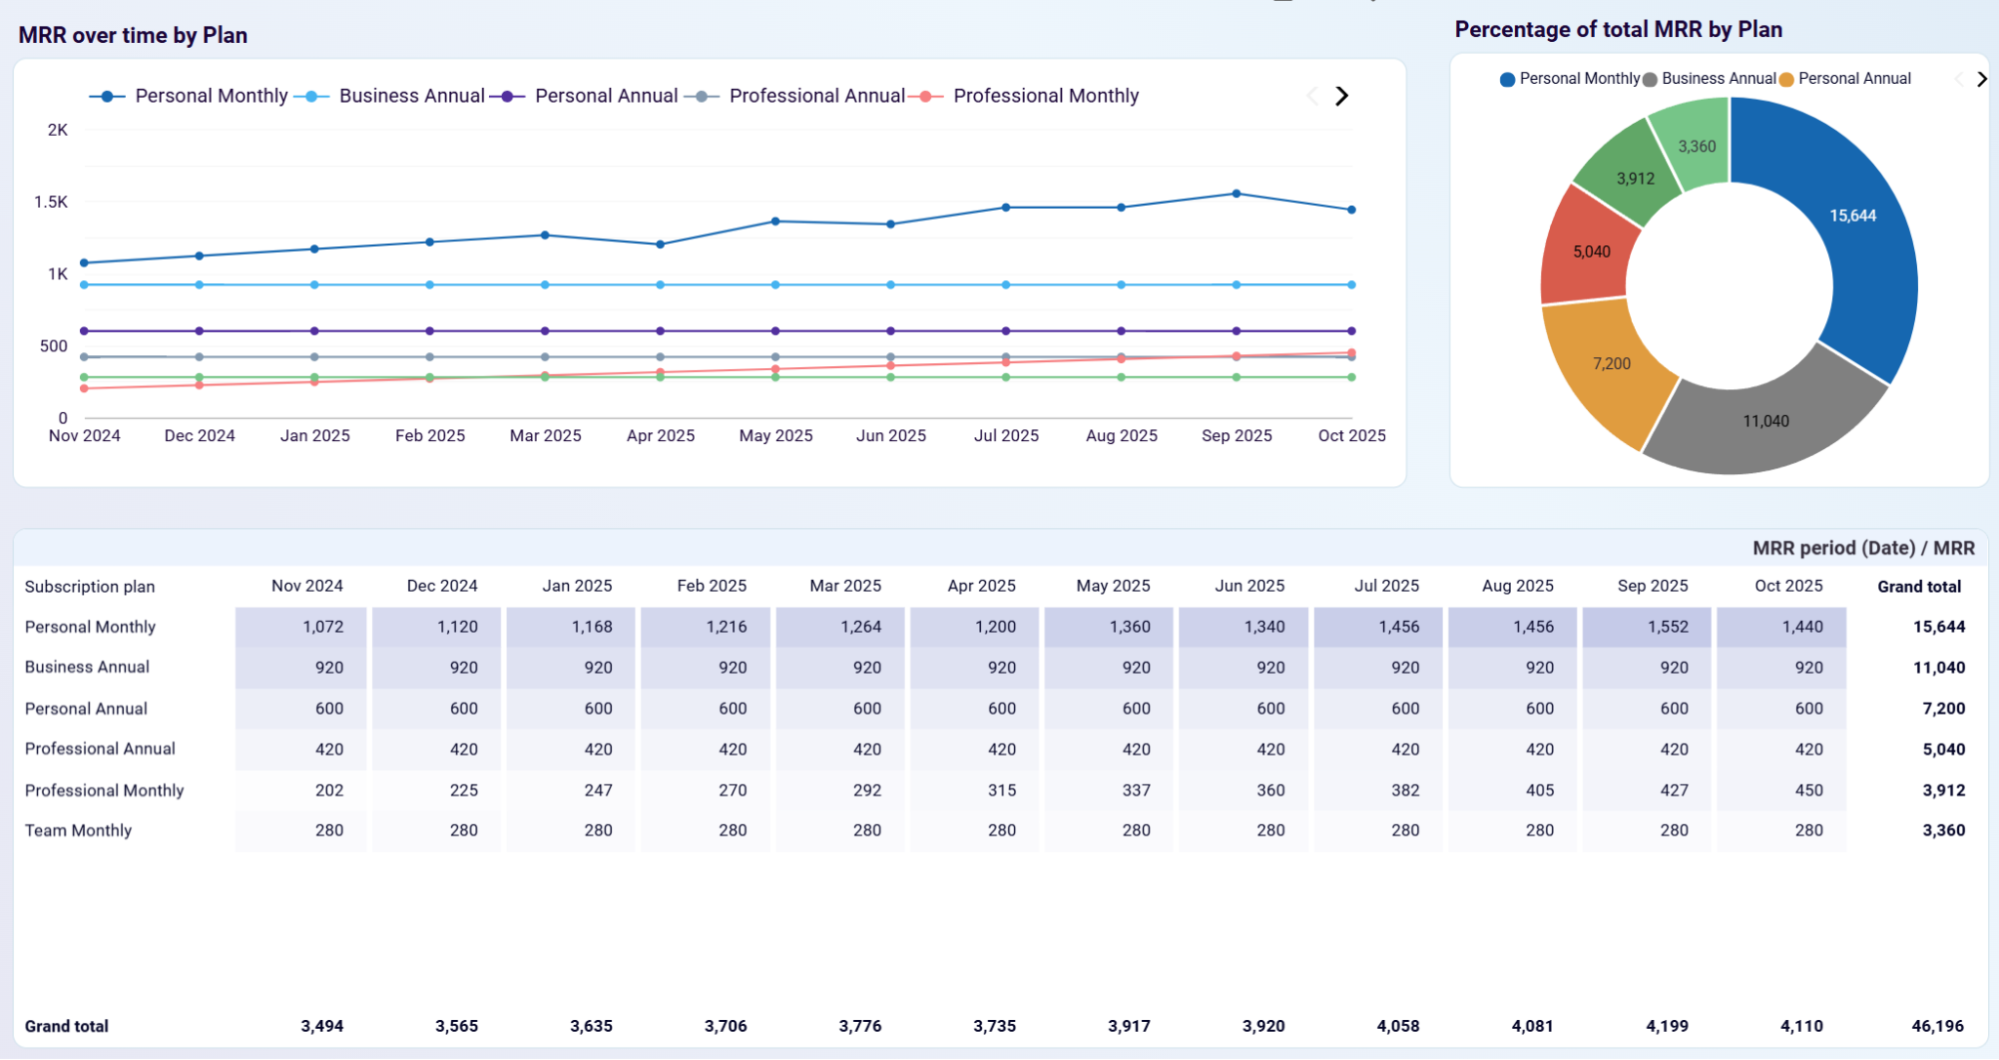
Track how each pricing tier contributes to your total monthly recurring revenue and identify which subscription plans drive sustainable growth. The multi-line chart displays growth trajectories for all plans simultaneously, while the pie chart shows current revenue distribution across tiers. The detailed breakdown table provides exact MRR values by plan for each month, making it easy to compare performance and spot trends. This visualization reveals which plans are expanding, stagnating, or declining, helping you decide where to focus marketing efforts and product development resources for maximum revenue impact.
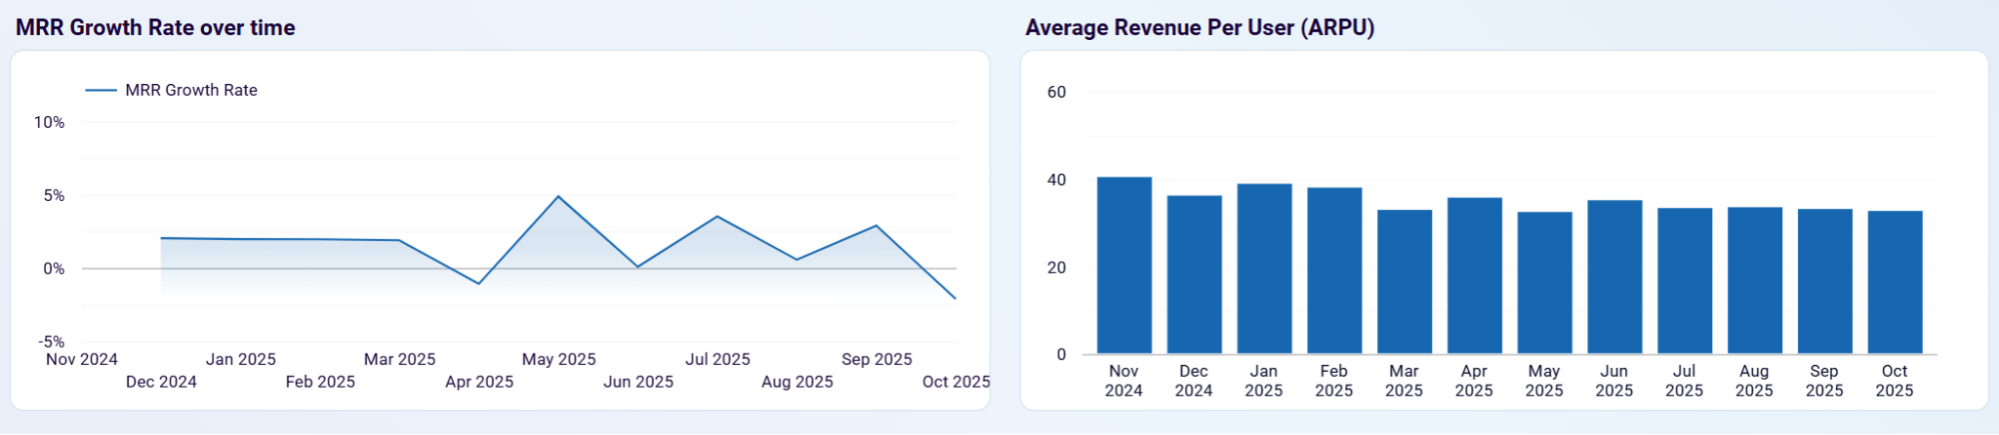
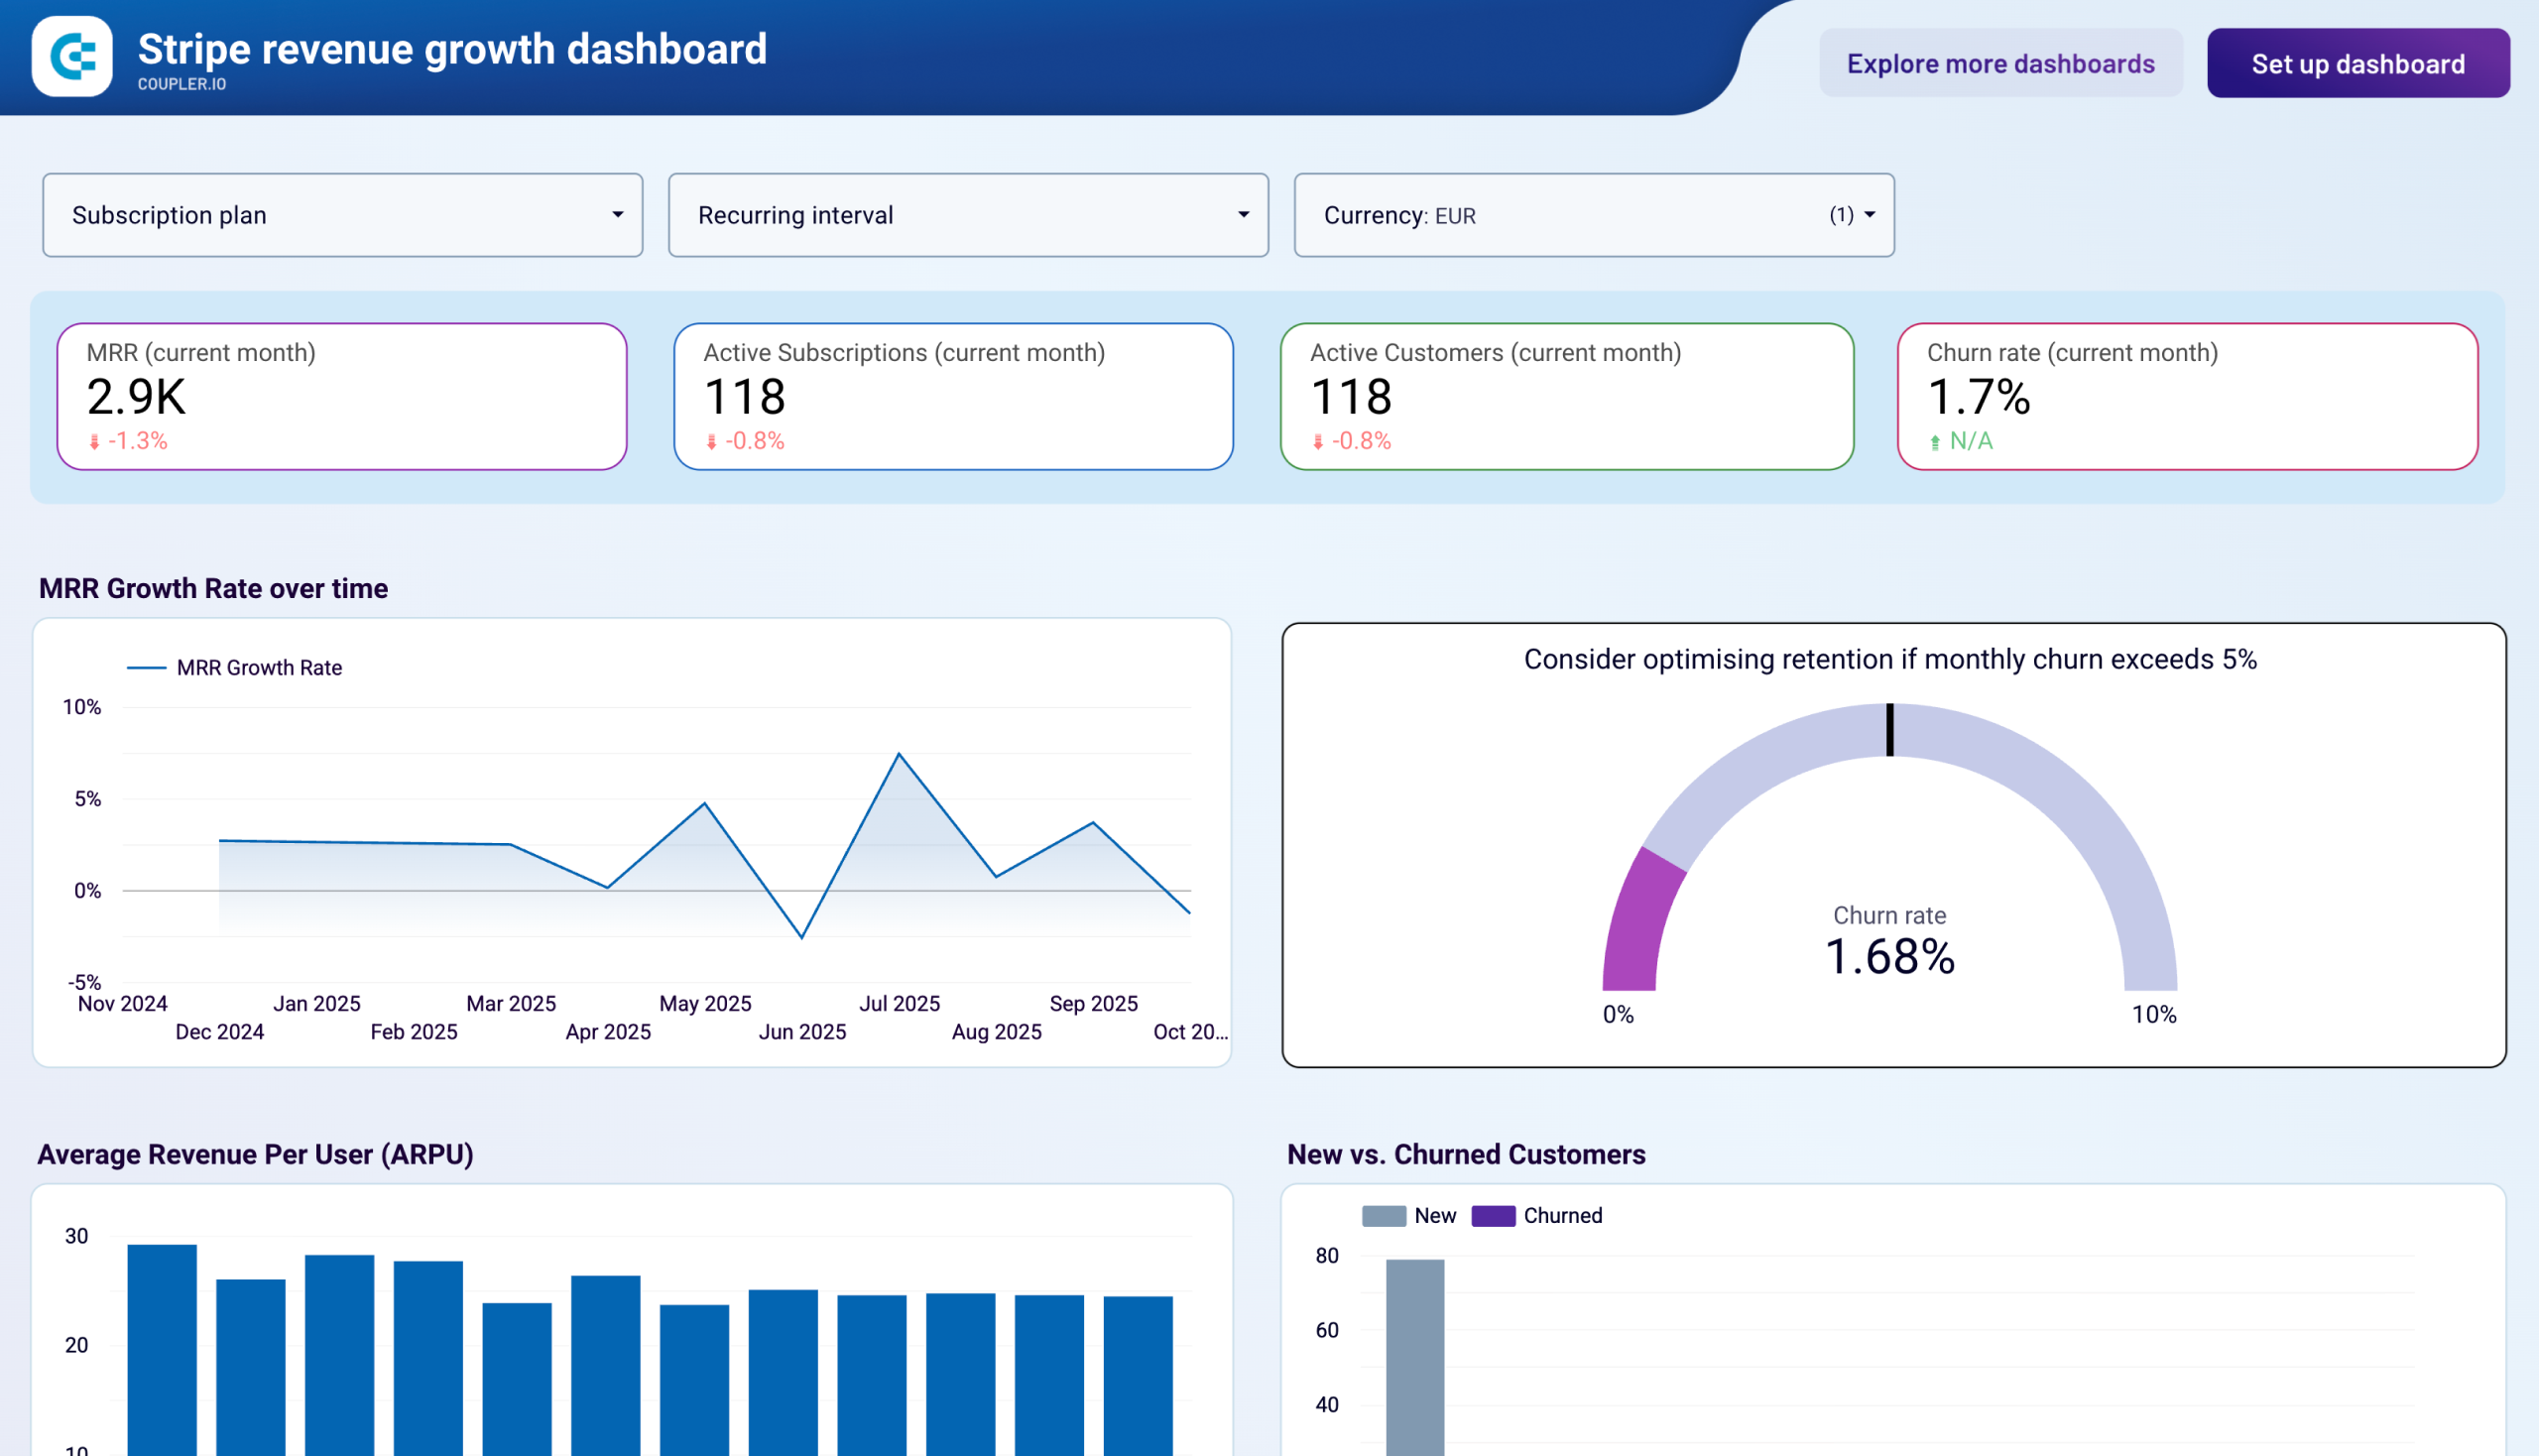
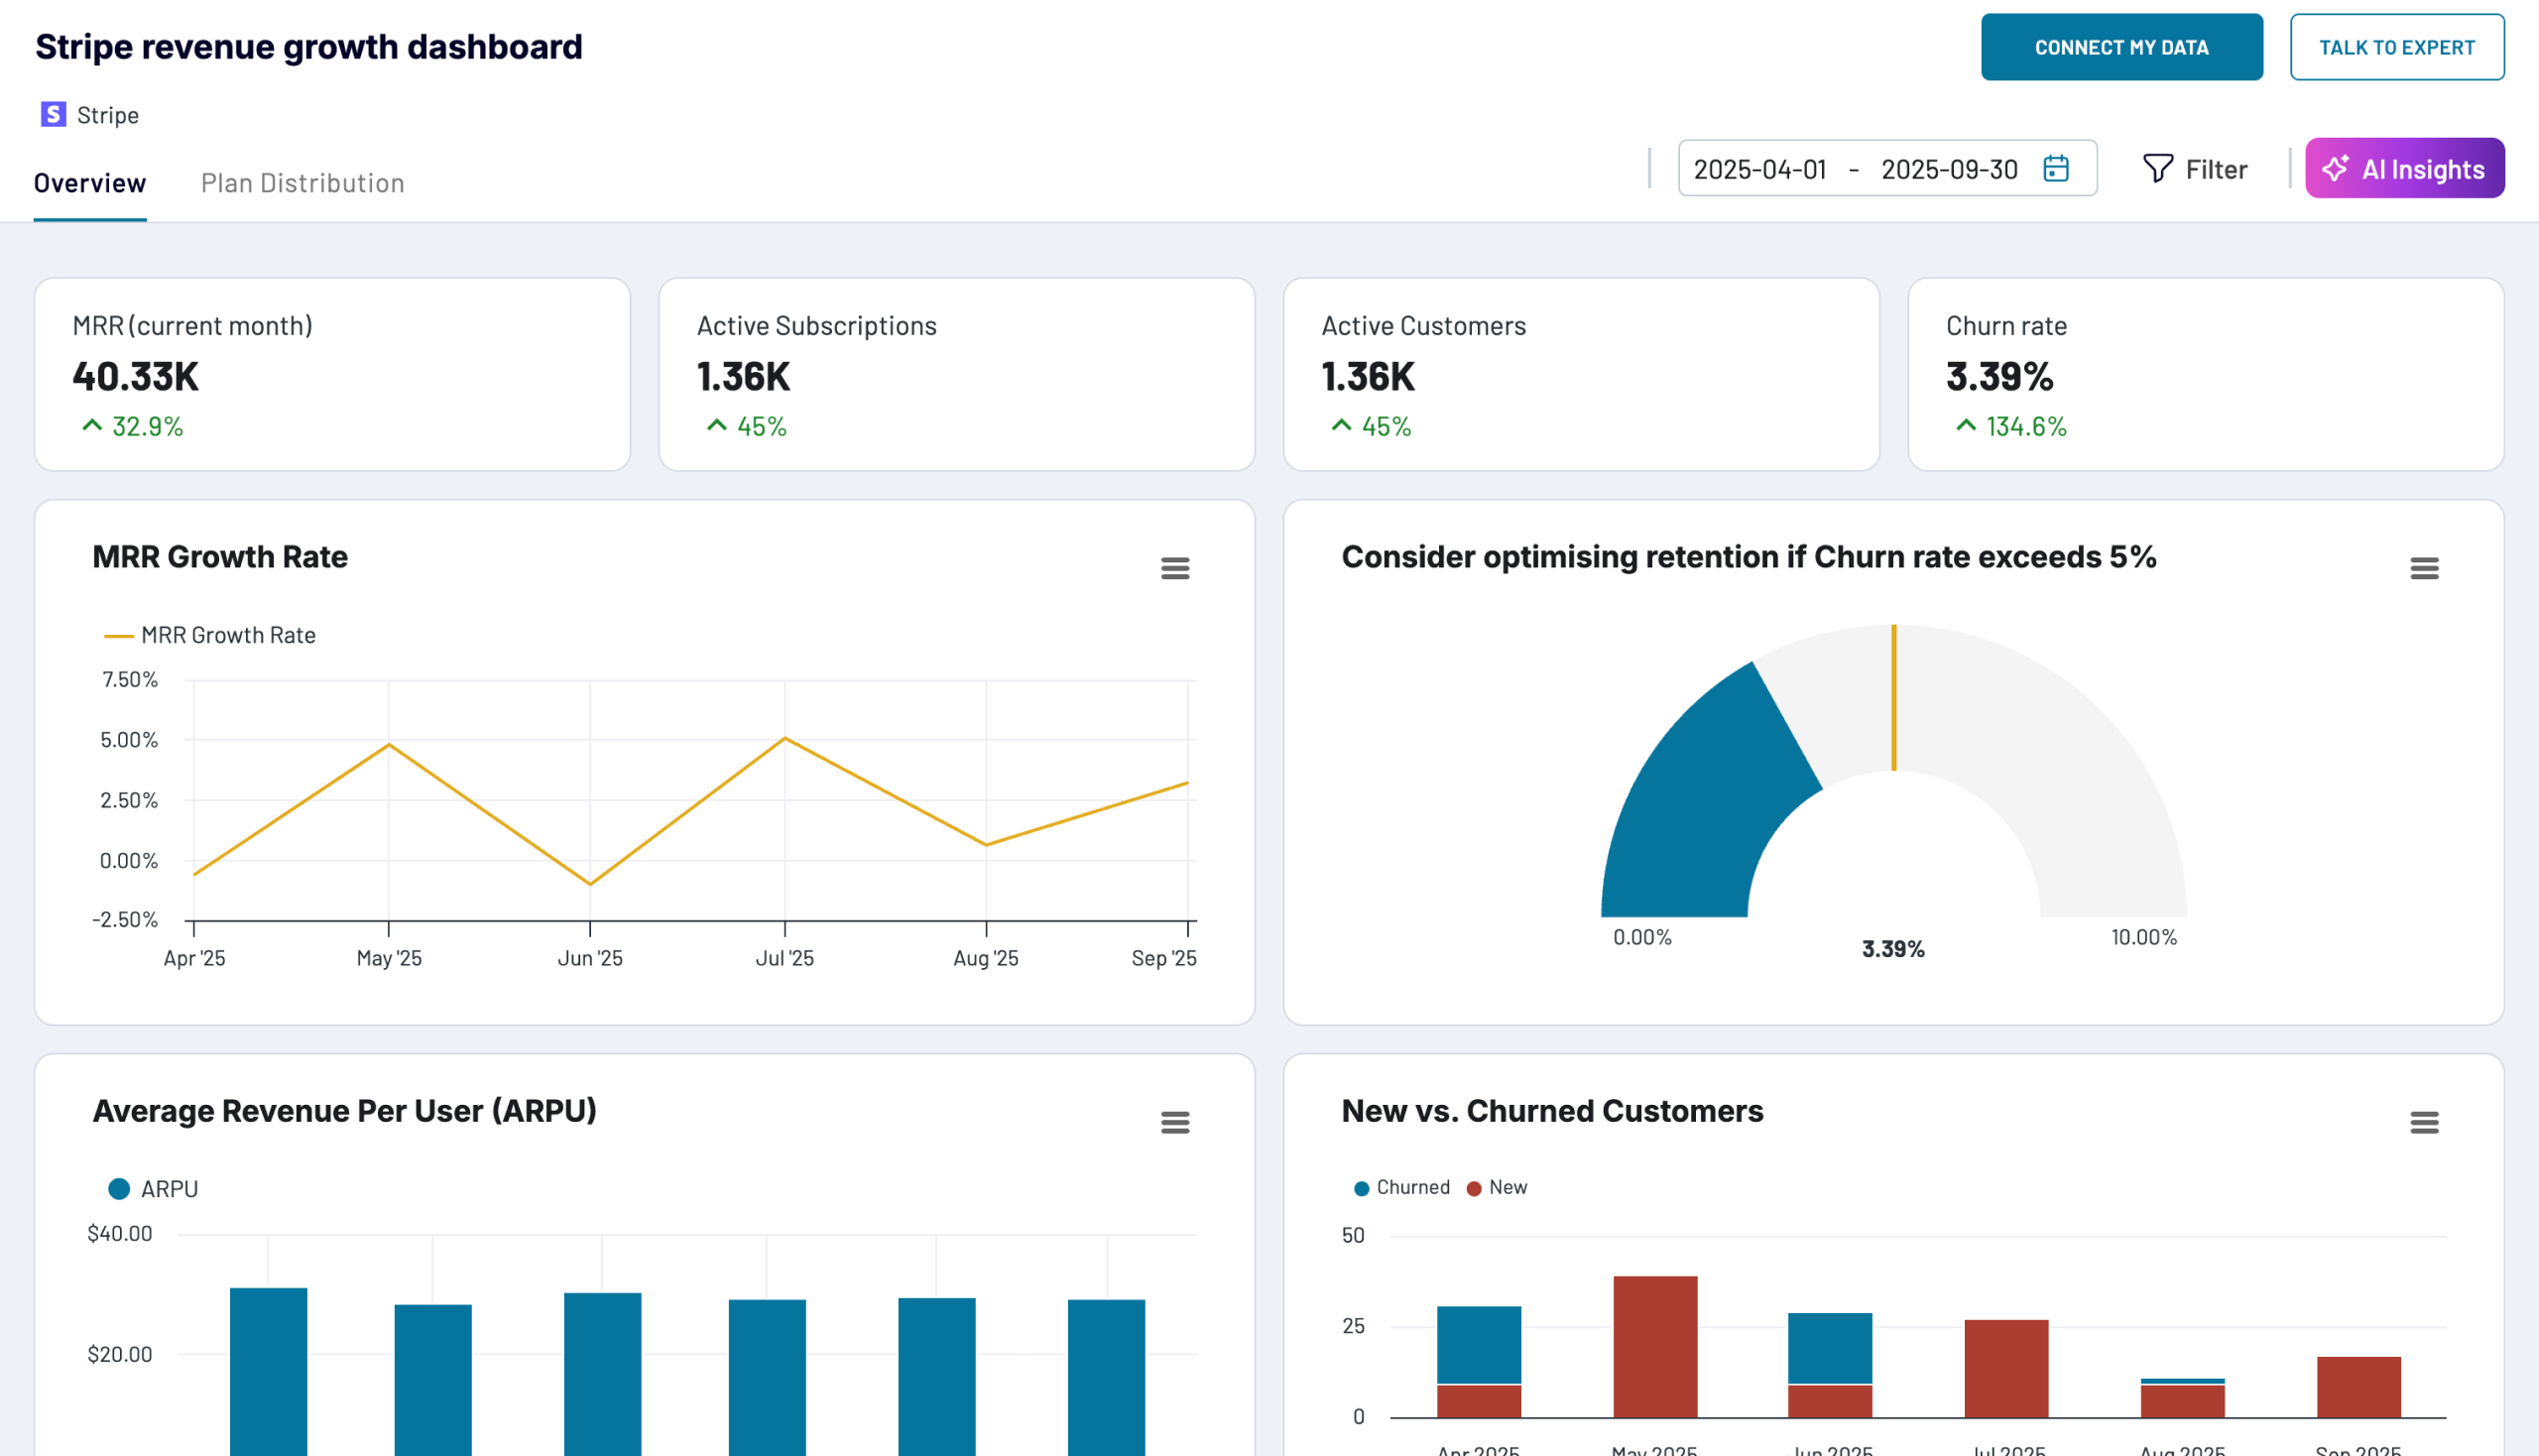
Understand the speed at which your business is growing and whether that growth comes from acquiring more customers or increasing value per customer. The growth rate chart shows monthly percentage changes in MRR, revealing acceleration or deceleration in business momentum. The ARPU bar chart displays average revenue per customer over time, indicating whether growth stems from higher-value subscribers or simply more subscribers. Together, these metrics help assess whether your expansion strategy is working and whether you're building a business on volume or value.
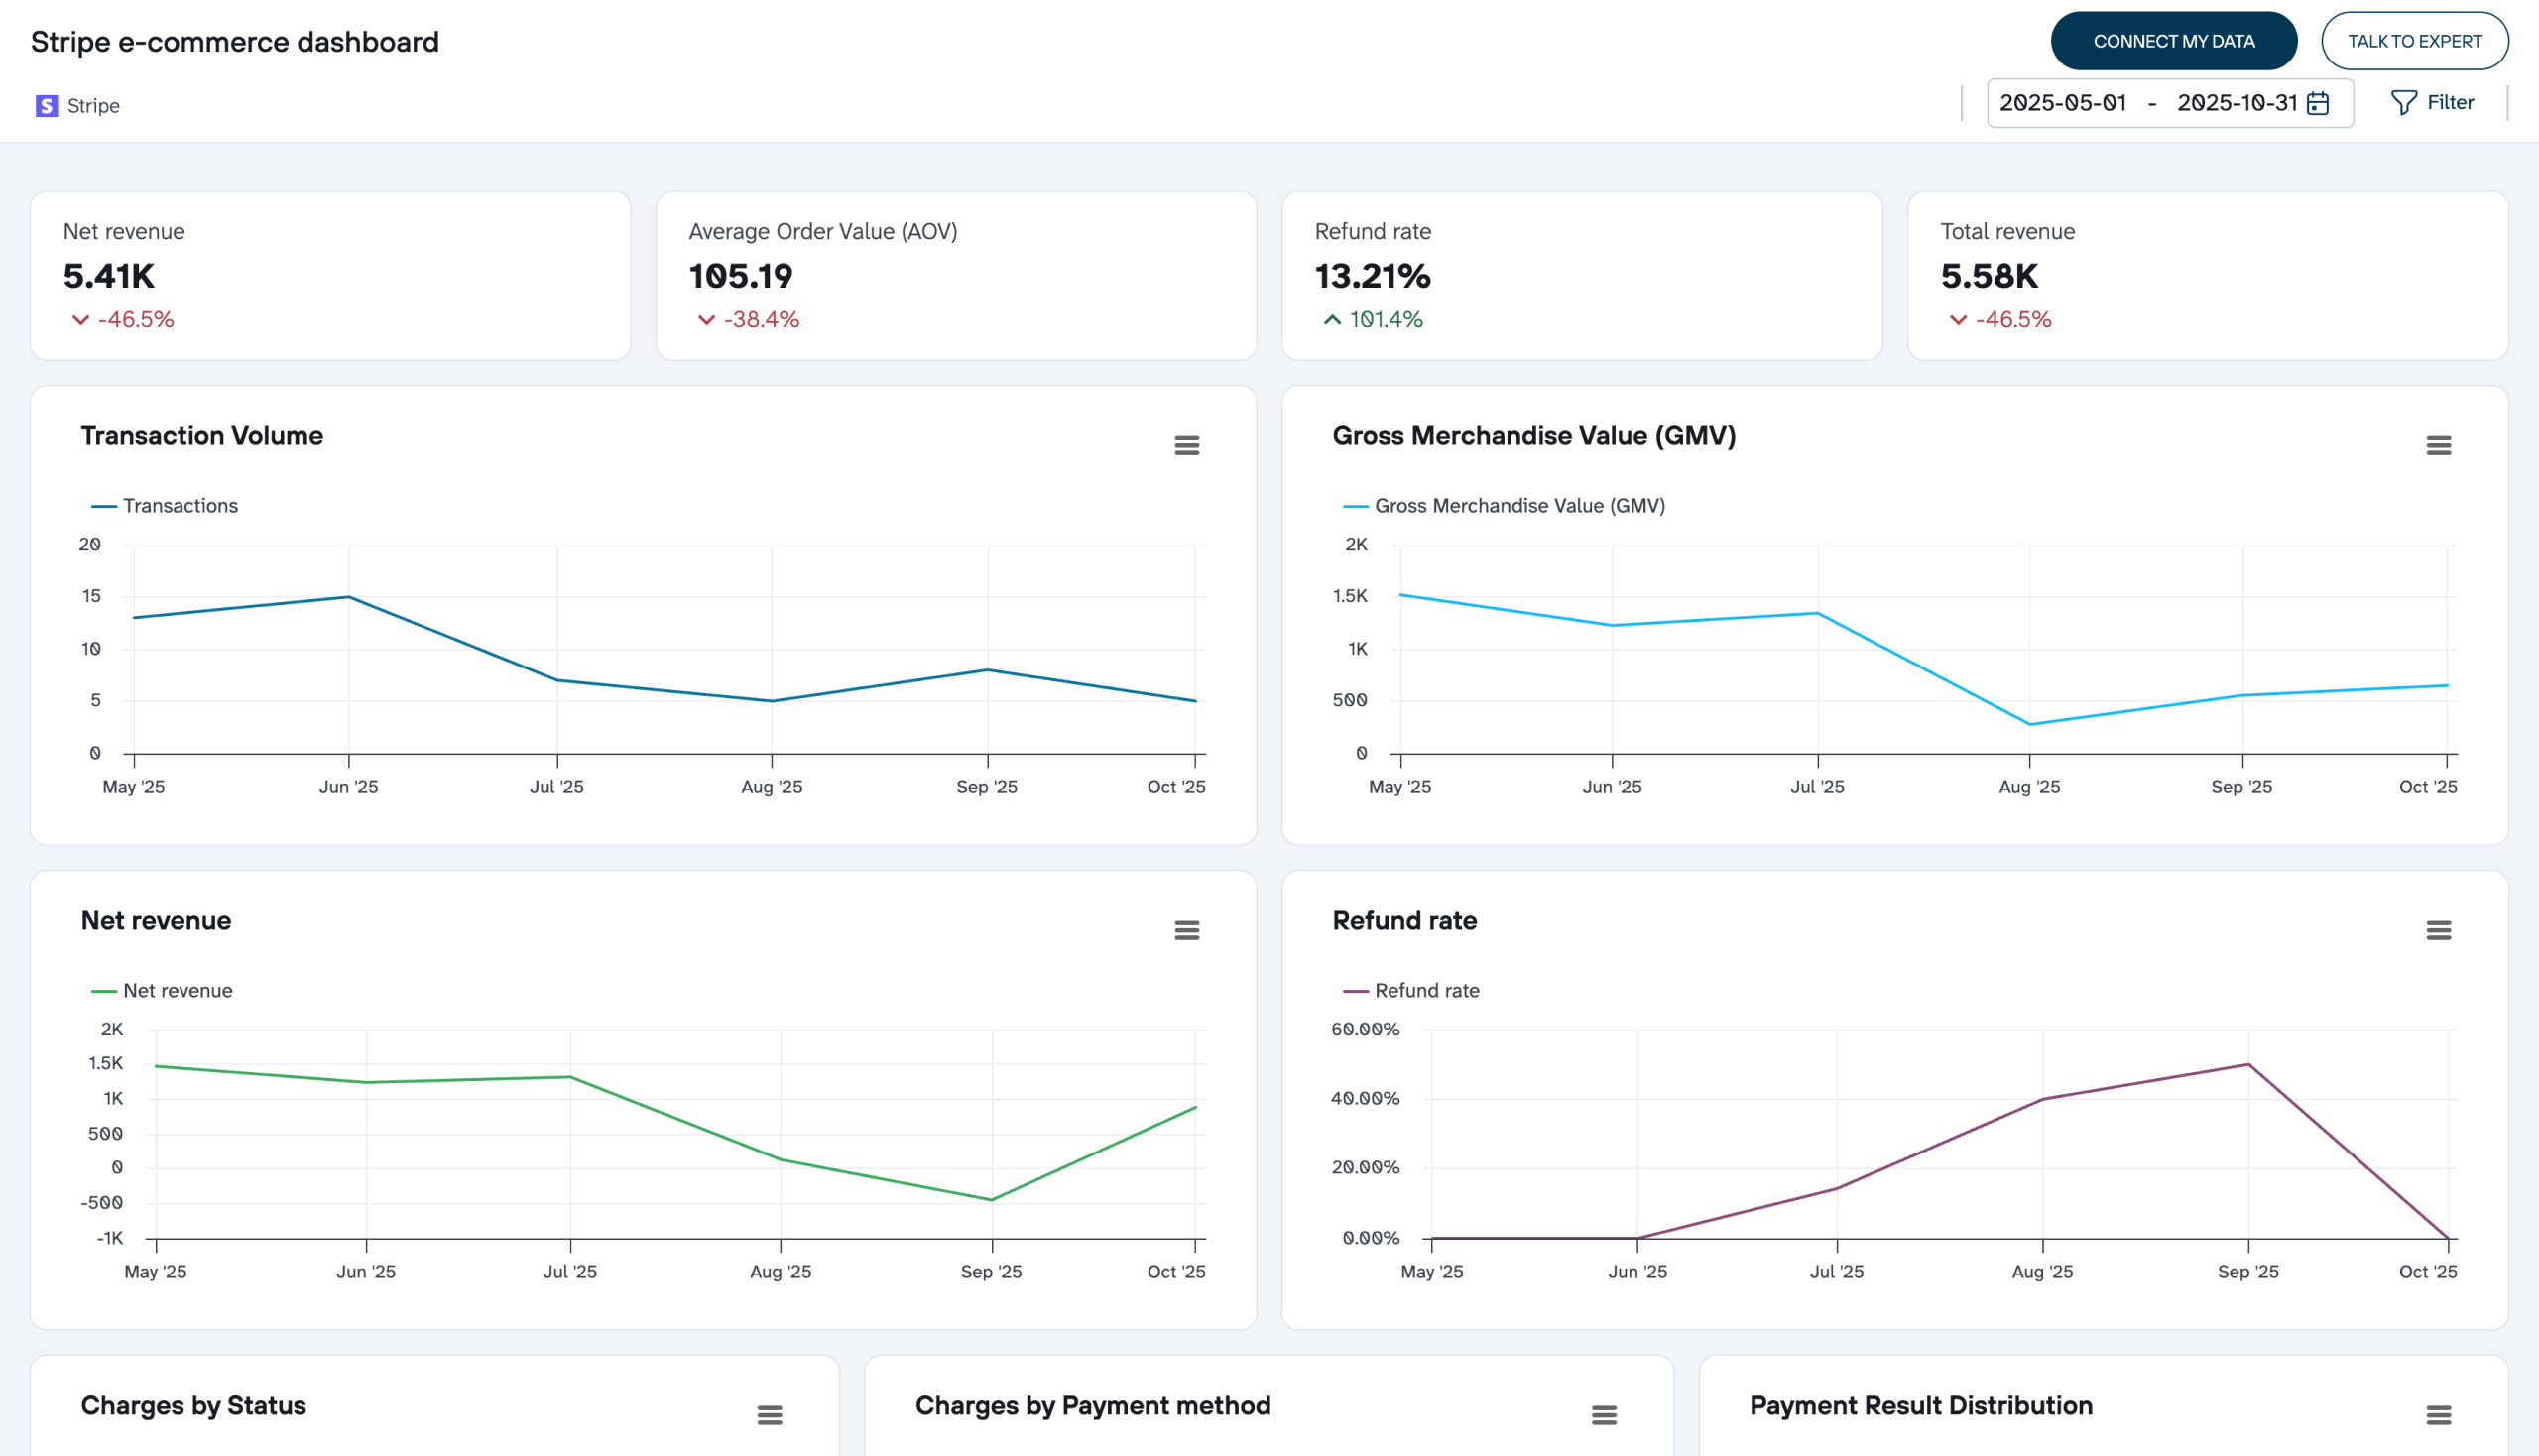
Compare new customer acquisition against customer churn to determine if your subscriber base is expanding or contracting. The stacked bar chart displays both new customers gained and existing customers lost each month, making retention issues immediately visible. When acquisition significantly outpaces churn, you're achieving healthy net growth; when the gap narrows, it signals problems with customer satisfaction or product-market fit. This insight helps identify specific periods requiring retention intervention and reveals whether growth momentum depends on strong acquisition, excellent retention, or both working in tandem.
Access all critical subscription metrics in one unified monthly breakdown that enables correlation analysis across different performance indicators. The table displays MRR, subscription counts, customer totals, churn figures, acquisition numbers, growth percentages, ARPU, and churn rates for each period with color-coded highlighting for concerning values. This consolidated view allows you to identify relationships between metrics—such as noticing when ARPU declines despite customer growth, or when churn spikes coincide with pricing changes. The comprehensive perspective transforms isolated numbers into an interconnected narrative about subscription business health.
How to create a Stripe dashboard?

Metrics you can track with a Stripe dashboard template
The total predictable revenue your business generates from active subscriptions each month. MRR provides the foundational metric for tracking business size and growth trajectory, calculated by summing all active subscription values normalized to a monthly basis. It excludes one-time charges and focuses solely on recurring billing, making it the most reliable indicator of subscription business health and the primary metric investors use to value recurring revenue companies.
The percentage change in monthly recurring revenue from one period to the next, showing how quickly your business is expanding or contracting. This metric reveals business momentum and helps identify acceleration or deceleration trends. Growth rates between 2-7% monthly are typical for healthy subscription businesses, while negative growth rates signal serious retention or acquisition problems requiring immediate investigation and intervention.
The total number of subscription instances that are currently active and generating recurring revenue. This count may differ from customer count if individual customers can hold multiple subscriptions. Tracking active subscription counts helps you understand the volume side of your revenue equation and identify whether changes in MRR stem from subscription count changes or from shifts in subscription value and pricing tier distribution.
The number of unique customers with at least one active subscription in the given period. This metric provides a customer-centric view of your business size and helps calculate customer-level metrics like average revenue per user. Comparing active customer counts against active subscription counts reveals whether your customers typically maintain single or multiple subscriptions, informing product bundling and cross-sell strategies.
The number of customers who canceled all their subscriptions during a specific period. Tracking absolute churn numbers alongside churn rates provides context about the scale of customer loss. High churn counts, even with acceptable churn rates, can indicate systemic problems with product-market fit, customer success processes, or competitive positioning that require strategic intervention beyond tactical retention improvements.
The count of customers who initiated their first subscription during a specific period, representing your customer acquisition volume. This metric helps evaluate the effectiveness of your marketing and sales efforts. Comparing new customer acquisition against churned customers shows whether your customer base is expanding or shrinking, with healthy businesses maintaining acquisition rates significantly higher than churn rates to achieve net growth.
The average monthly recurring revenue generated per active customer, calculated by dividing total MRR by active customer count. ARPU indicates whether you're building a business on volume or value and reveals whether revenue growth comes from acquiring more customers or increasing value per customer. Declining ARPU despite customer growth suggests you're attracting lower-value subscribers or experiencing downgrades from existing customers.
The percentage of customers who canceled their subscriptions during a period, calculated by dividing churned customers by total customers at the start of the period. Churn rate is one of the most critical metrics for subscription businesses, with rates above 5-7% monthly indicating serious retention problems. Low churn rates compound into powerful growth acceleration over time, as more acquired customers remain in your revenue base rather than leaking out through cancellations.