Snapchat Ads dashboard examples and reporting templates
Get complete visibility into your Snapchat advertising performance with an automated dashboard that tracks campaign metrics, audience engagement, and geographical impact. This customizable Snapchat Ads reporting dashboard consolidates all your key performance indicators in one place, enabling you to optimize spend, identify top-performing campaigns, and make data-driven decisions to improve your advertising ROI.
Examples of Snapchat Ads dashboards for every need


 +3
+3


 +3
+3
 +1
+1
 +4
+4
 +4
+4

 +2
+2

 +2
+2

 +5
+5

 +4
+4
 +5
+5
 +5
+5
 +3
+3
 +3
+3

 +1
+1
 +3
+3
 +3
+3
 +2
+2

 +1
+1

 +1
+1

 +2
+2
 +3
+3

 +4
+4
about your case. It doesn't cost you a penny 😉
Choose your white label Snapchat Ads dashboard to kick off
What is a Snapchat Ads dashboard?
Built specifically for tracking paid ad campaign performance on Snapchat, this dashboard visualizes key metrics like impressions, clicks, swipes, cost per swipe, and geographical performance. With Coupler.io's connector integration, the dashboard automatically refreshes with your latest Snapchat Ads data without manual exports, giving you real-time insights to optimize your advertising strategy and budget allocation.

What reports should be included on a meaningful Snapchat Ads dashboard?
A well-structured Snapchat Ads reporting dashboard should include several essential reports that provide a complete view of your advertising performance. Based on our analysis of effective Snapchat advertising analytics, we recommend incorporating these key report types:
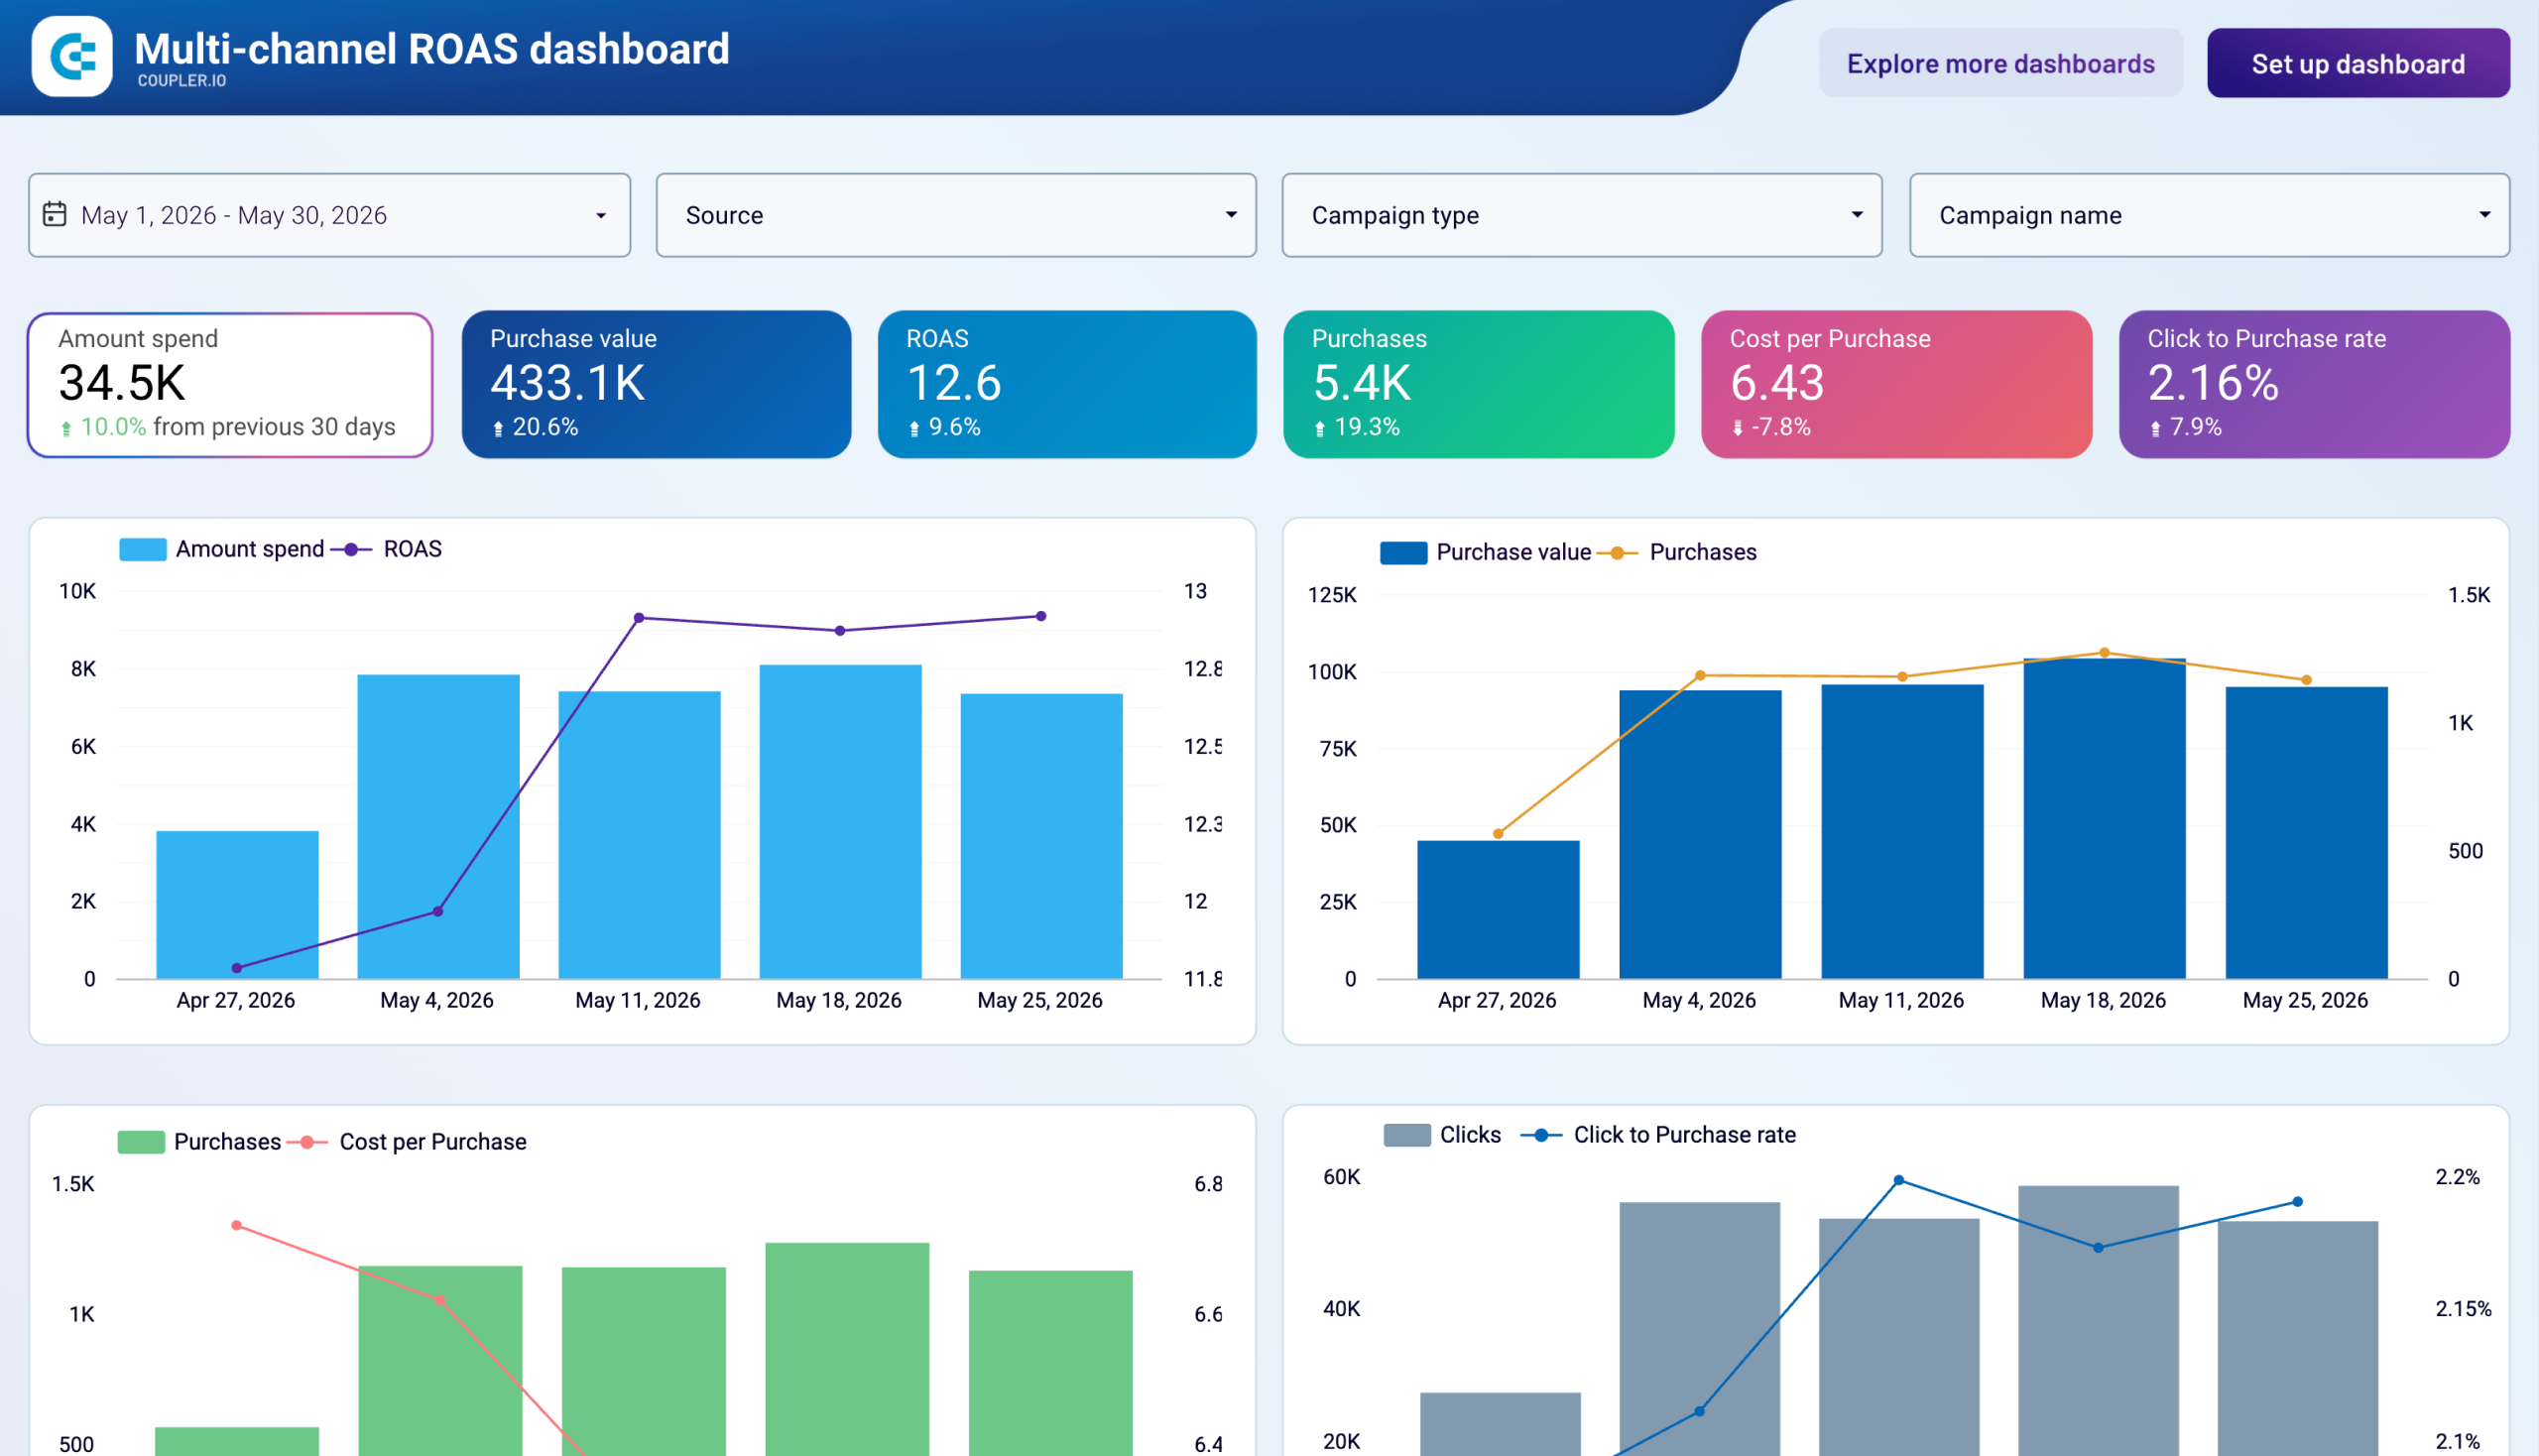
The performance overview report provides immediate visibility into critical campaign metrics with customizable filters by account, campaign, and campaign objective. This report displays key indicators like impressions, clicks, amount spent, and swipe-ups in both summary scorecards and trend visualizations. It enables quick assessment of campaign effectiveness, highlights performance changes compared to previous periods, and allows you to filter results for detailed analysis of specific segments of your advertising efforts.
The campaign dynamics report tracks the daily and monthly trends of your advertising metrics, showing how key performance indicators evolve over time. You can monitor impressions, clicks, swipes, and spend patterns through intuitive line and column charts that reveal both short-term fluctuations and longer-term trends. This report includes drill-up capabilities to view weekly progress, helping you identify optimal posting times, recognize seasonal patterns, and correlate campaign changes with performance shifts.
The geographic performance report visualizes your ad performance across different countries and regions through interactive maps and regional breakdowns. This report shows where your ads generate the most engagement, highlighting top countries by swipe-ups, impressions, or eCPM. These geographic insights enable you to optimize targeting strategies, allocate budget to high-performing regions, and tailor content for different geographic audiences, maximizing the effectiveness of your Snapchat ad campaigns across global markets.
The campaign comparison report presents a detailed side-by-side analysis of all your Snapchat campaigns, allowing you to evaluate relative performance across multiple metrics. This comprehensive table breaks down each campaign by critical KPIs such as amount spent, swipes, eCPSU, eCPM, and other engagement metrics. The report enables you to identify your most cost-effective campaigns, recognize underperforming initiatives that need optimization, and make informed decisions about budget reallocation to maximize overall advertising ROI.
What insights you can get with the Snapchat Ads reporting dashboard
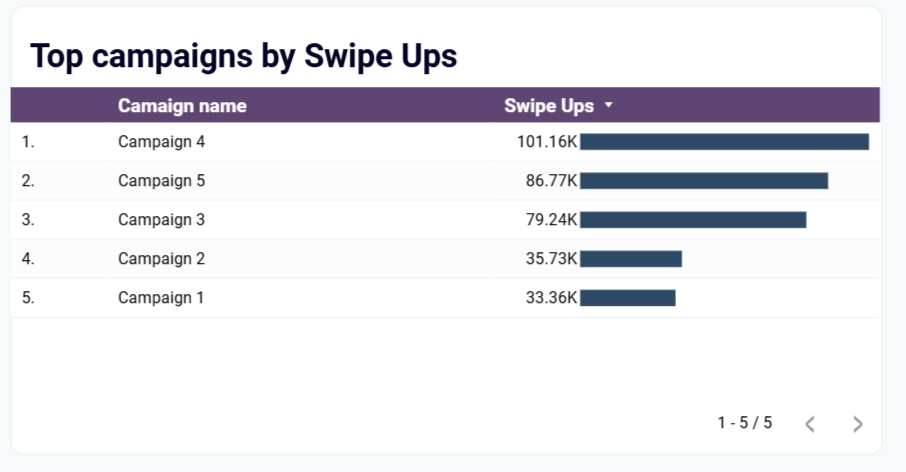
The Snapchat Ads dashboard highlights your best-performing campaigns based on swipe-up engagement, featuring a dedicated table that ranks campaigns by this critical interaction metric. This visualization immediately shows which content and messaging drives the most direct engagement with your brand. With this insight, you can quickly identify successful creative approaches, optimize your content strategy based on proven performance, and allocate more resources to campaign types that generate the highest user engagement.
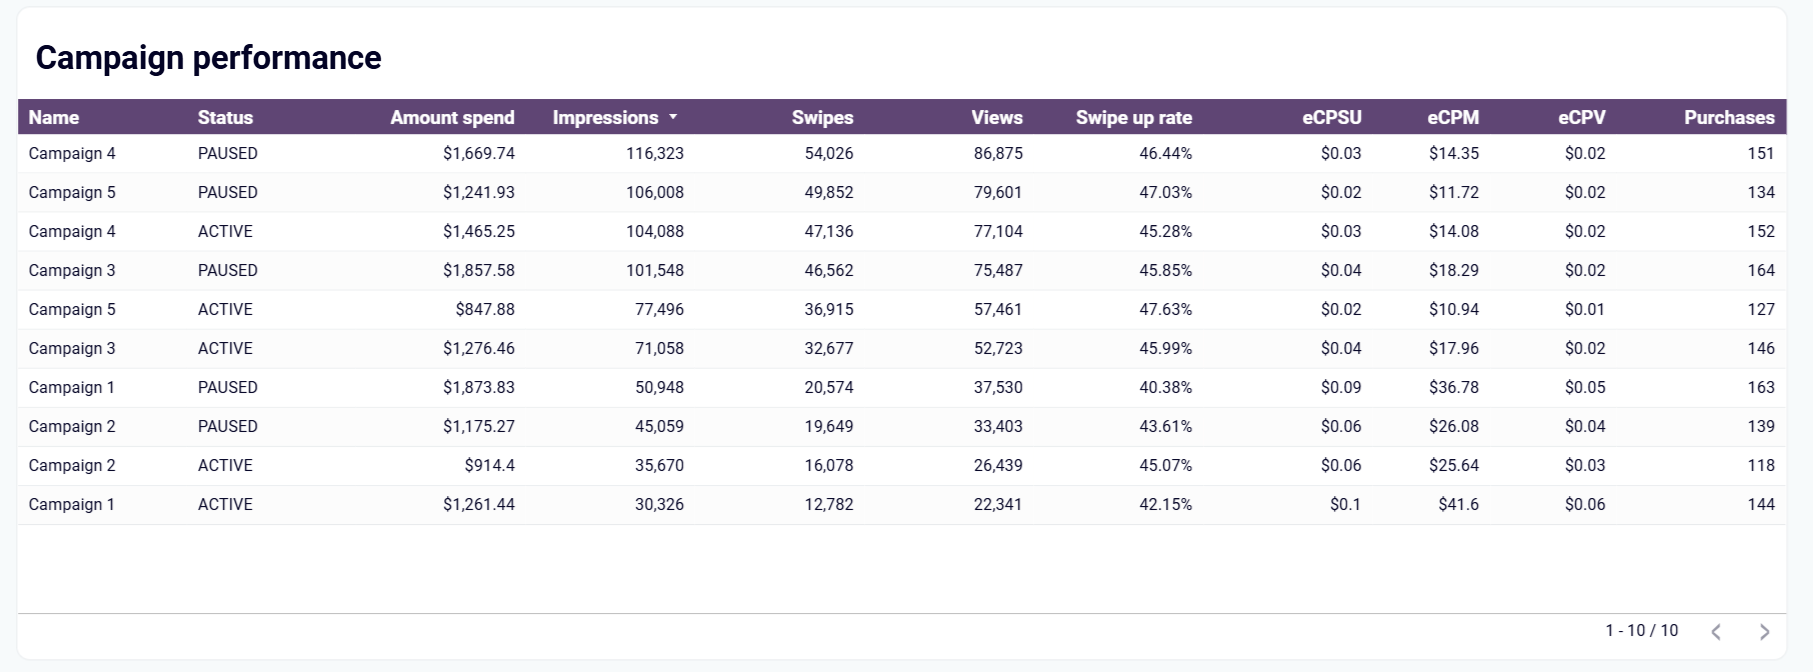
The comprehensive campaign comparison table provides a detailed breakdown of all your Snapchat campaigns by essential metrics like amount spent, swipes, eCPSU, and eCPM. This structured view allows you to evaluate each campaign's efficiency and return on investment at a glance. By comparing performance across multiple dimensions, you can quickly identify which campaigns deliver the best value for your advertising budget, understand the factors contributing to success, and make data-driven decisions about which campaigns to scale and which to optimize.
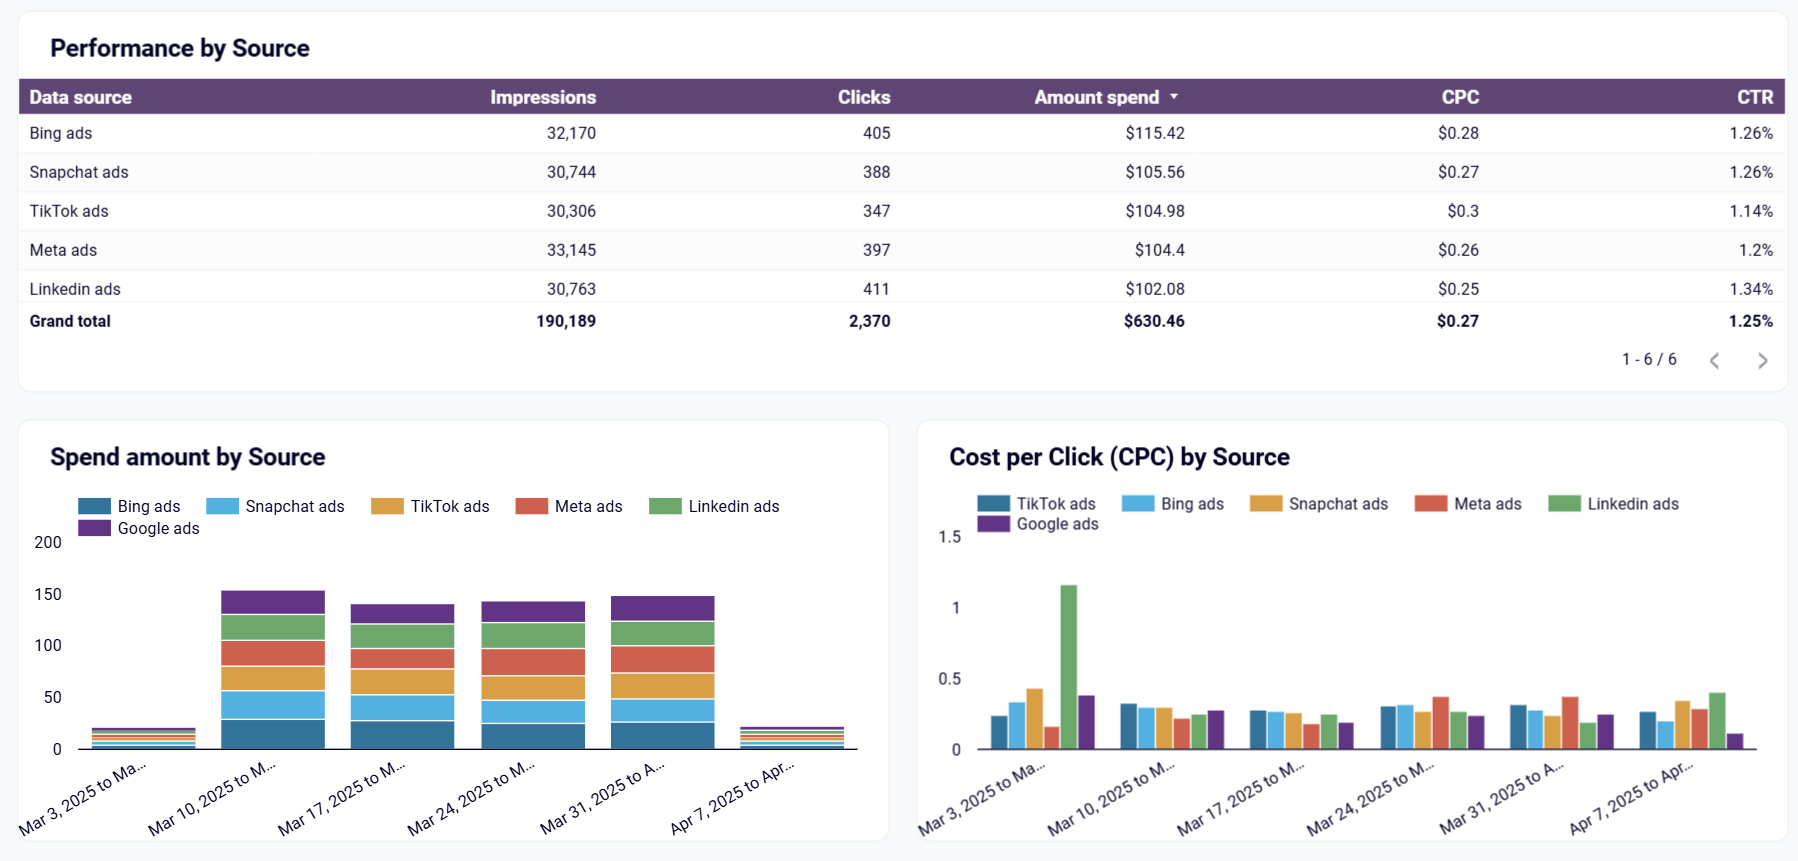
The dashboard provides in-depth analysis of essential performance metrics including impressions, clicks, amount spent, cost per click, and click-through rates for each advertising source. This detailed view enables you to pinpoint which campaigns are delivering the most cost-effective results and optimize future initiatives for better engagement. By understanding how different creative approaches and targeting strategies affect these core metrics, you can refine your advertising approach to focus on techniques that generate higher conversion rates at lower costs.
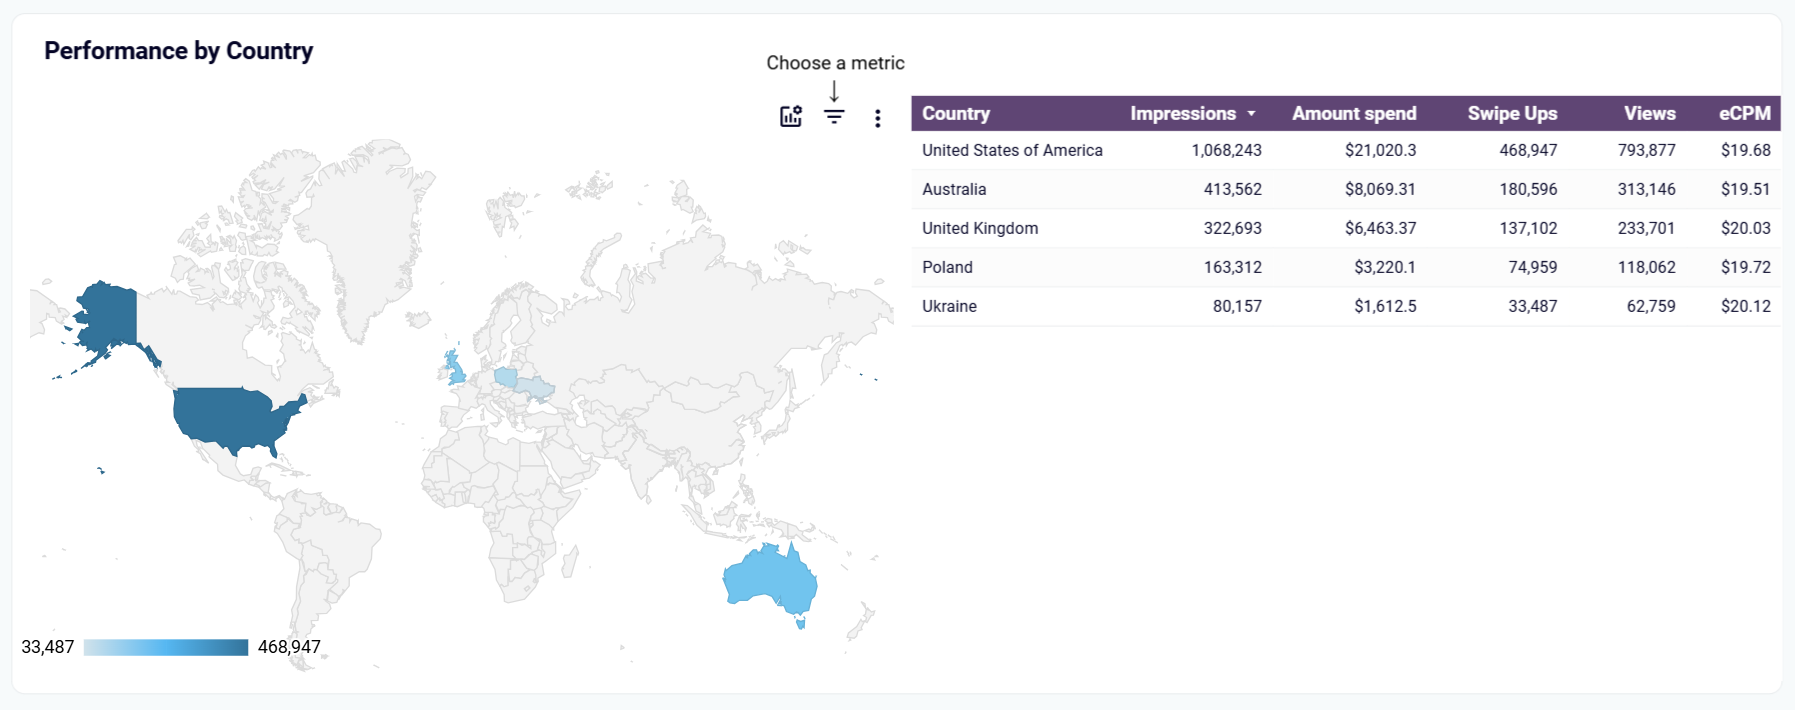
The geographic performance section provides a visual heat map showing how your Snapchat campaigns perform across different countries and regions. You can toggle between different metrics including swipe-ups, eCPM, or impressions to identify regional strengths and weaknesses in your advertising strategy. This visualization helps you discover untapped markets with high engagement, recognize regions where your content resonates most strongly, and adjust your targeting and localization efforts to maximize return on ad spend across different countries.
How to create a Snapchat Ads dashboard?

Metrics you can track with a Snapchat Ads dashboard template
Monitor the overall reach of your Snapchat advertising campaigns through total ad views. This metric shows how many times your ads were displayed to users, providing insight into your brand's visibility on the platform. By tracking impressions over time and comparing them against your targeting parameters, you can evaluate whether your ads are reaching your intended audience at the expected scale.
Track the number of times users tap on your ads, indicating direct interest in your content. This essential engagement metric helps you assess the initial appeal of your creative assets and messaging. By monitoring click patterns across different campaigns and audience segments, you can identify which visual elements and copy most effectively capture user attention, allowing you to replicate successful approaches in future campaigns.
Measure the number of times users swipe up on your ads to access your website, app, or landing page. This critical conversion action represents a stronger intent signal than regular clicks. By tracking swipe up performance across campaigns, you can determine which content drives meaningful engagement and which calls-to-action most effectively encourage users to take the next step in your marketing funnel.
Monitor your total advertising expenditure across all Snapchat campaigns, providing complete visibility into your budget allocation and utilization. This metric allows you to track spending patterns over time, compare actual costs against projected budgets, and calculate the efficiency of your advertising investments. With this data, you can make informed decisions about scaling successful campaigns while optimizing or pausing underperforming ones.
Track how much you're spending on average to generate each swipe-up action across your campaigns. This efficiency metric helps you evaluate which campaigns deliver engagement at the lowest cost. By comparing eCPSU across different campaigns, target audiences, and creative approaches, you can optimize your advertising strategy to maximize engagement while minimizing costs.
Monitor how much you're paying for every thousand impressions across your Snapchat campaigns. This standardized cost metric allows you to compare the relative efficiency of different campaigns and targeting approaches. Tracking eCPM helps you identify which audience segments and creative styles deliver the most cost-effective reach, enabling better budget allocation and campaign optimization.
Measure the percentage of users who clicked on your ad after seeing it, providing insight into how compelling and relevant your creative is to your audience. This engagement ratio helps you evaluate the effectiveness of your ad copy, visuals, and call-to-action elements. By monitoring CTR across different campaigns and creative approaches, you can identify winning formulas and optimize underperforming ads to drive higher engagement.
Analyze how much you're spending for each click on your Snapchat ads. This efficiency metric helps you evaluate the cost-effectiveness of different campaigns and targeting strategies. By monitoring CPC trends, you can identify opportunities to optimize bidding strategies, improve targeting parameters, and refine creative elements to generate more clicks without increasing your budget.
Track how effectively your Snapchat ads drive desired user actions beyond the platform, such as app installs, sign-ups, or purchases. These outcome-focused metrics connect your advertising efforts directly to business results. By analyzing which campaigns and creative approaches generate the highest conversion rates, you can optimize your strategy to focus on driving meaningful business outcomes rather than just platform engagement.