Profitability dashboard examples and reporting templates
Gain actionable insights into your business performance with automated profitability reporting dashboards that consolidate data from QuickBooks, Xero, Google Ads, and ecommerce platforms. Track revenue metrics, analyze profit margins, monitor marketing ROI, and make strategic decisions based on real-time insights from your financial and marketing data sources.
Profitability dashboards for every need


about your case. It doesn't cost you a penny 😉
Choose your profitability dashboard template to kick off
What is a profitability dashboard?
Modern profitability dashboards go beyond simple profit and loss statements by breaking down profitability by customer, product, marketing channel, and time period. With automated data refreshing through Coupler.io, these dashboards provide up-to-date insights without manual data entry or calculations. They help you answer critical questions about which aspects of your business drive profits, where you might be losing money, and how to allocate resources for maximum returns.

What reports should be included on a meaningful profitability dashboard?
A well-designed profitability reporting dashboard should include several key report types that provide visibility into different aspects of your business performance. Based on our analysis of financial and marketing dashboards, we recommend incorporating these four essential report types:
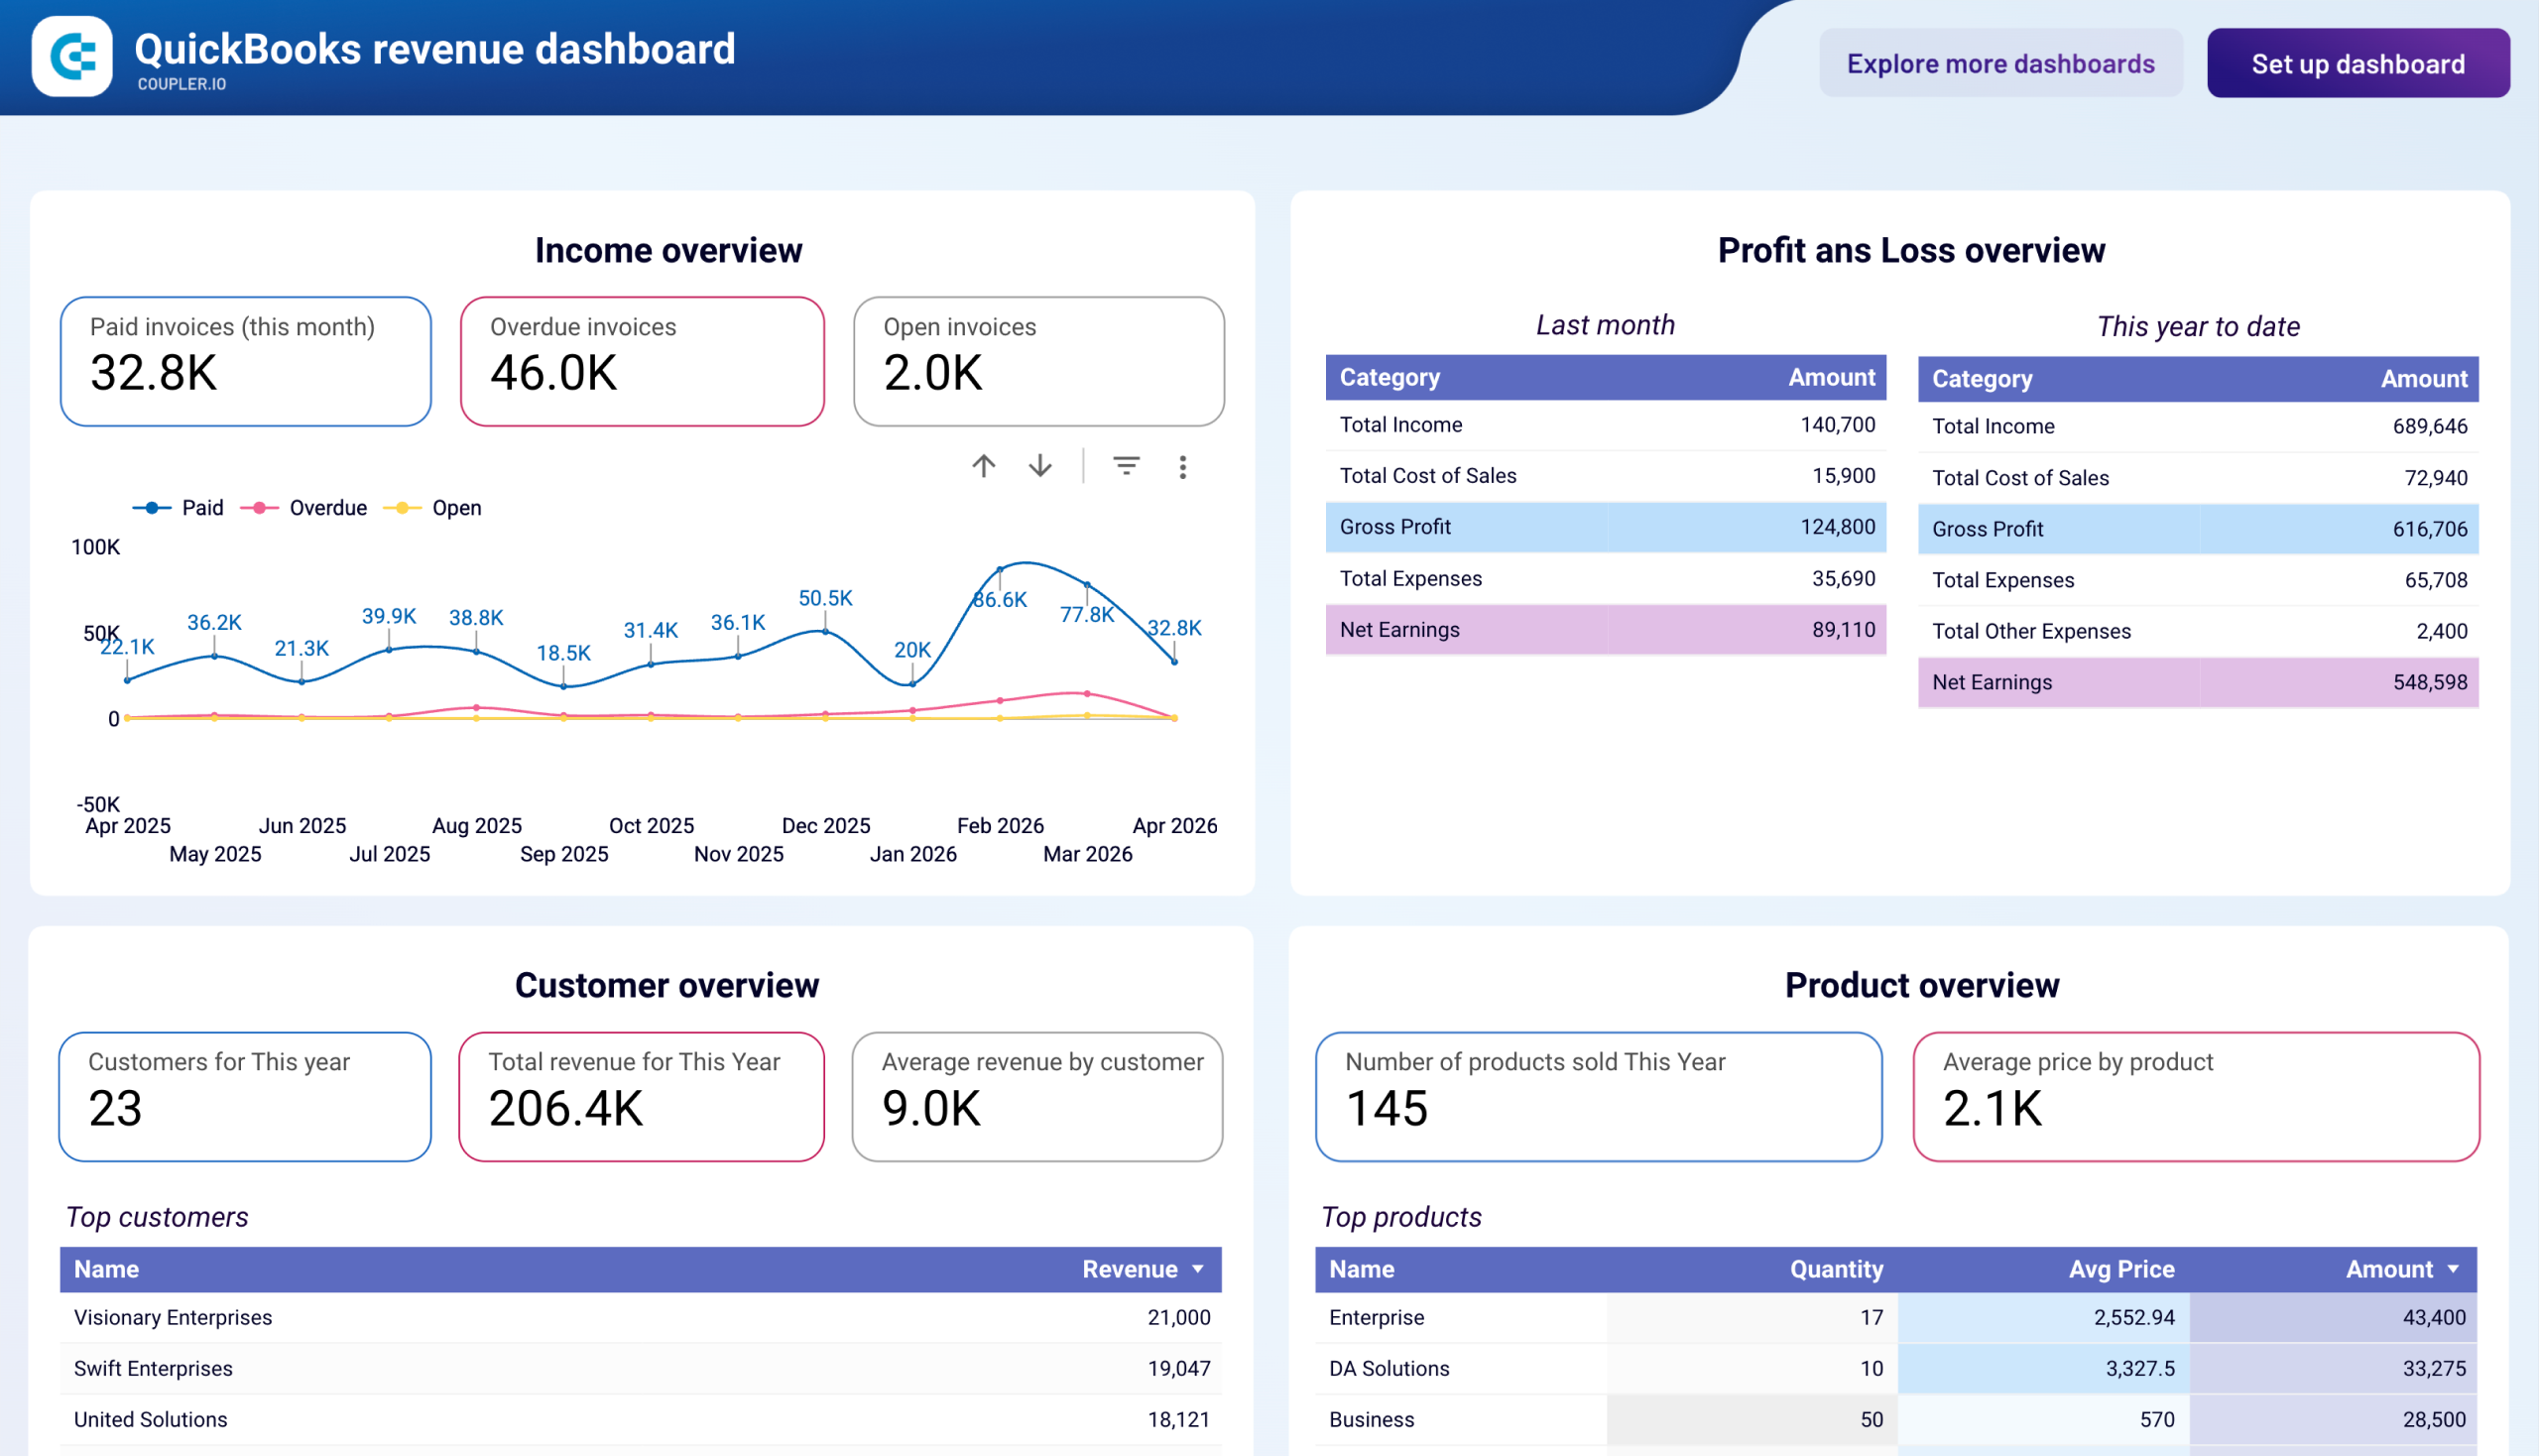
The revenue dashboard report provides a foundation for profitability analysis by tracking income trends over the last 12 months. It shows revenue distribution by customers and products, displays key revenue metrics, and lists your top customers and best-selling products. This report helps you identify seasonal fluctuations, peak revenue periods, and unexpected dips in profitability, giving you clear visibility into which revenue streams contribute most to your bottom line.
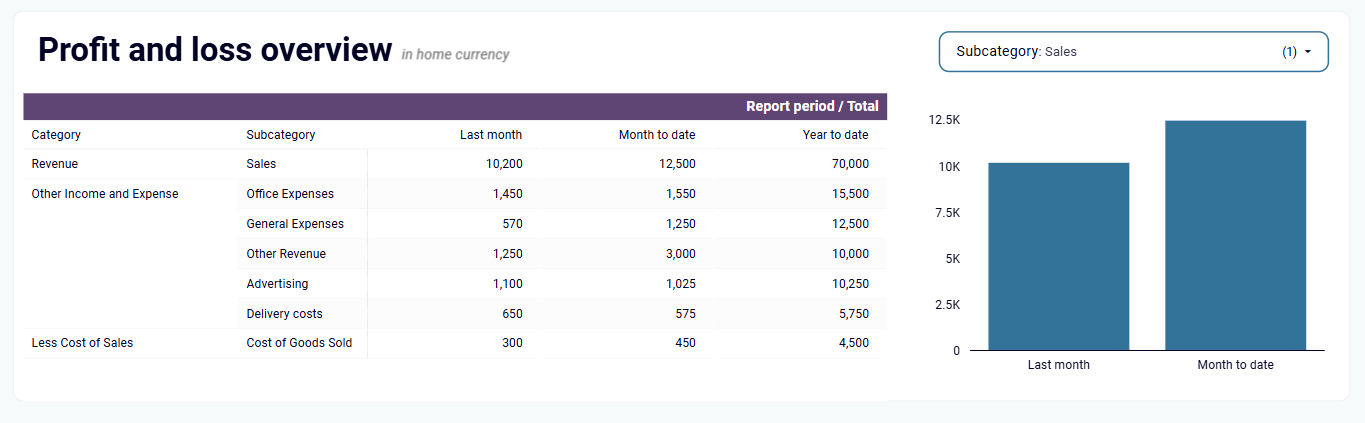
The profit and loss overview report delivers critical performance monitoring by comparing revenue against expenses across multiple time periods (last month, month-to-date, year-to-date). It includes balance sheet visualizations with clear assets versus liabilities comparisons and cash flow monitoring showing net income trends. These insights provide the core financial metrics that drive strategic decision-making and help you understand how operational costs impact your overall profitability.
With profitability dashboard templates for ecommerce tools like Shopify, you obtain key insights into your store's profitability with metrics like total sales, orders, and revenue by product. The monthly dynamics visualization shows the ratio between marketing costs and revenue generated, helping you identify which products and marketing channels deliver the highest returns. This report is essential for understanding your complete sales performance and optimizing both product offerings and marketing spend for maximum profitability.
The ecommerce sales and marketing funnel report combines data from your ecommerce platform and advertising channels to track the journey from ad impressions to purchases. It shows how your PPC campaigns and website traffic convert into sales and revenue by monitoring acquisition costs alongside conversion metrics. This report is essential for understanding your complete customer acquisition funnel and identifying opportunities to improve conversion rates and reduce acquisition costs for better profitability.
What insights you can get with the profitability dashboard
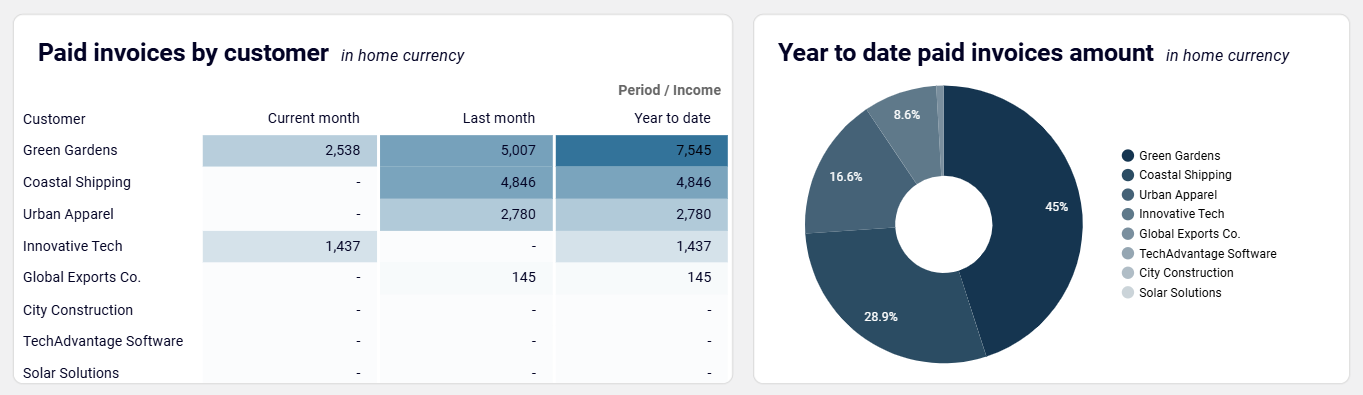
The accounts receivable dashboard shows a detailed breakdown of customer payments and revenue patterns. You can identify your top 10 customers by revenue contribution through visualizations of paid invoices and payment history. This insight helps you prioritize marketing and retention efforts on your most valuable relationships while also identifying opportunities to improve revenue from underperforming accounts.
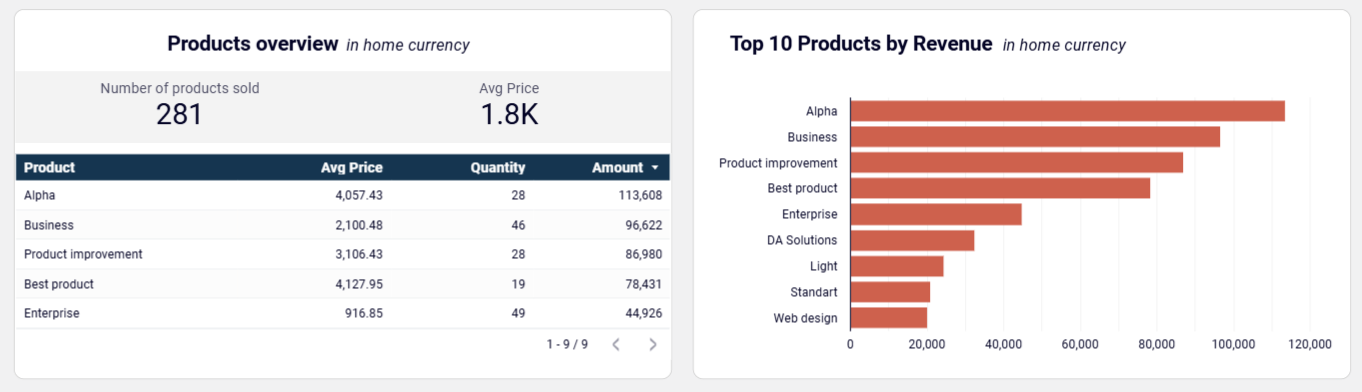
The revenue dashboard provides a comprehensive overview of which products or services generate the most revenue for your business. The product overview report shows your best-selling products and their contribution to total sales, enabling you to identify top performers and understand their impact on your bottom line. This insight allows you to make informed decisions about inventory management, pricing strategies, and promotional activities.
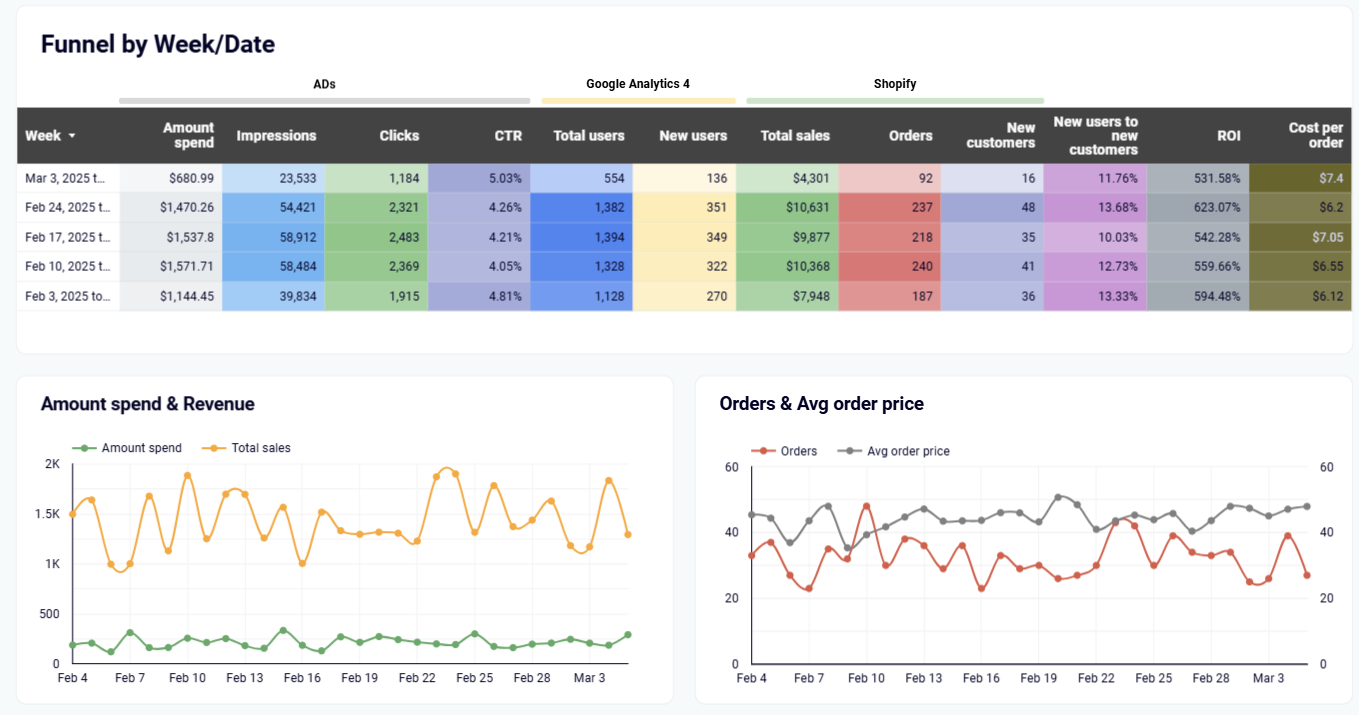
The Shopify marketing funnel analytics dashboard shows the complete journey from marketing spend to revenue generation. The spend vs. revenue chart displays the monthly ratio between costs on advertising and revenue generated by sales, allowing you to identify periods of high and low efficiency. You can track which marketing channels deliver the highest return on investment and adjust your strategy accordingly to maximize profitability across your ecommerce operation.
The financial dashboard provides a clear visualization of your profit and loss overview. You can track revenue against expenses with comparisons showing last month, month-to-date, and year-to-date performance. This insight is crucial for identifying profitability patterns, spotting potential issues early, and making strategic adjustments to improve your bottom line through better expense management and revenue optimization.
How to create a profitability dashboard?

Metrics you can track with the profitability dashboard templates
Monitor your total income over time, broken down by month, quarter, or year. The profitability dashboard visualizes revenue trends for the last 12 months, allowing you to identify seasonal patterns, growth trajectories, and unexpected fluctuations. This foundational metric helps you set realistic goals, measure business growth, and understand the top-line performance that drives profitability.
Track your business's bottom line by measuring the difference between total revenue and total expenses. The profitability reporting dashboard displays this metric for different time periods (last month, month-to-date, year-to-date), helping you understand your overall financial health and identify trends in profitability that require attention or offer opportunities for improvement.
Visualize how your income is distributed across your customer base with rankings of top customers by revenue contribution. The dashboard shows both the total amount and percentage share each customer represents in your overall revenue, allowing you to identify key accounts that significantly impact your profitability and deserve focused relationship management.
Analyze which products or services drive the most revenue for your business through clearly ranked product performance metrics. The profitability dashboard highlights your best-selling items and their contribution to total sales, helping you optimize your product mix, inventory management, and promotional strategies to focus on high-performing offerings.
Monitor how much you pay for each click across different advertising platforms, campaigns, and ad sets. The dashboard tracks CPC over time alongside metrics like click-through rate and conversion rate, allowing you to identify inefficient spending patterns and optimize your ad campaigns for more cost-effective performance that improves marketing profitability.
Measure advertising efficiency by tracking the revenue generated relative to your ad spend across platforms like Google Ads and Meta Ads. The profitability reporting dashboard calculates this metric for each campaign, helping you identify which marketing investments deliver the strongest returns and contribute most to your overall profitability.
Track the typical purchase amount across your ecommerce store, with data segmented by time period and marketing channel. The dashboard connects this metric to your total orders and revenue, helping you identify opportunities to increase transaction sizes through improved product offerings, cross-selling, or promotional strategies that boost overall profitability.
Visualize how your costs fluctuate over time with monthly breakdowns of expenses by category. The profitability dashboard tracks these patterns alongside your revenue trends, enabling you to identify opportunities to reduce costs, manage seasonal variations, and improve profit margins through better expense management.