LinkedIn dashboard examples and reporting templates
Elevate your B2B marketing strategy with a professional-grade LinkedIn dashboard that provides insights into organic engagement. Our automated templates transform complex LinkedIn metrics into actionable business intelligence to help you optimize ad spend, refine content for executive audiences, and measure your influence within specific industries and professional networks.
LinkedIn dashboard examples for every need


 +6
+6


 +5
+5
 +6
+6


about your case. It doesn't cost you a penny 😉
Choose your white label LinkedIn dashboard to kick off
What is a LinkedIn dashboard?
Modern dashboards go beyond native LinkedIn analytics and allow you to track campaign metrics, monitor creative performance, analyze follower demographics, and identify geographic trends. With automated data refreshing through Coupler.io, each LinkedIn marketing dashboard ensures you're always working with the most up-to-date LinkedIn information without manual data exports or consolidation. It creates a single source of truth for your LinkedIn marketing efforts, bridging the gap between organic content strategy and paid advertising results.

What reports should be included on a meaningful LinkedIn analytics dashboard?
A comprehensive LinkedIn reporting dashboard should include several key marketing reports that provide complete visibility into your performance. Based on our analysis of marketing dashboards, we recommend incorporating these four essential report types:
The engagement report provides detailed insights into your organic LinkedIn presence, focusing on content performance and audience interaction. It tracks post-level metrics including impressions, likes, comments, and shares, allowing you to identify which content types resonate most with your professional audience. The report visualizes engagement rate trends over time, helping you understand the impact of your content strategy and communication activities. These insights are vital for developing more effective organic content and maximizing your presence on the platform.
The company page analytics report provides detailed insights into your organic LinkedIn presence, focusing on content performance and audience engagement. It includes post-level metrics tracking impressions, likes, comments, and shares, allowing you to identify which content types resonate most with your professional audience. The report also visualizes engagement rate trends over time, helping you understand the impact of your content strategy and communication activities. These insights are vital for developing more effective organic content and maximizing your presence on the platform.
The follower demographics report offers a comprehensive breakdown of your LinkedIn audience by company size, seniority, industry, and geographic location. It compares trends in organic and paid follower growth over time, helping you evaluate the success of your audience-building strategies. The report visualizes the distribution of followers across professional segments, allowing you to identify which industries and roles are most engaged with your brand. These insights are crucial for developing targeted content and ensuring your messaging resonates with your core professional audience.
The content effectiveness report tracks the performance of your organic LinkedIn content across key engagement metrics. It identifies your top-performing posts based on impressions, engagement rate, and audience response, helping you understand which content formats and topics drive the most meaningful professional interaction. The report breaks down post performance by type, allowing you to compare video, image, document, and text-only updates side by side. These insights enable you to refine your content strategy and develop more resonant messaging for your professional audience.
What insights you can get with the LinkedIn reporting dashboard
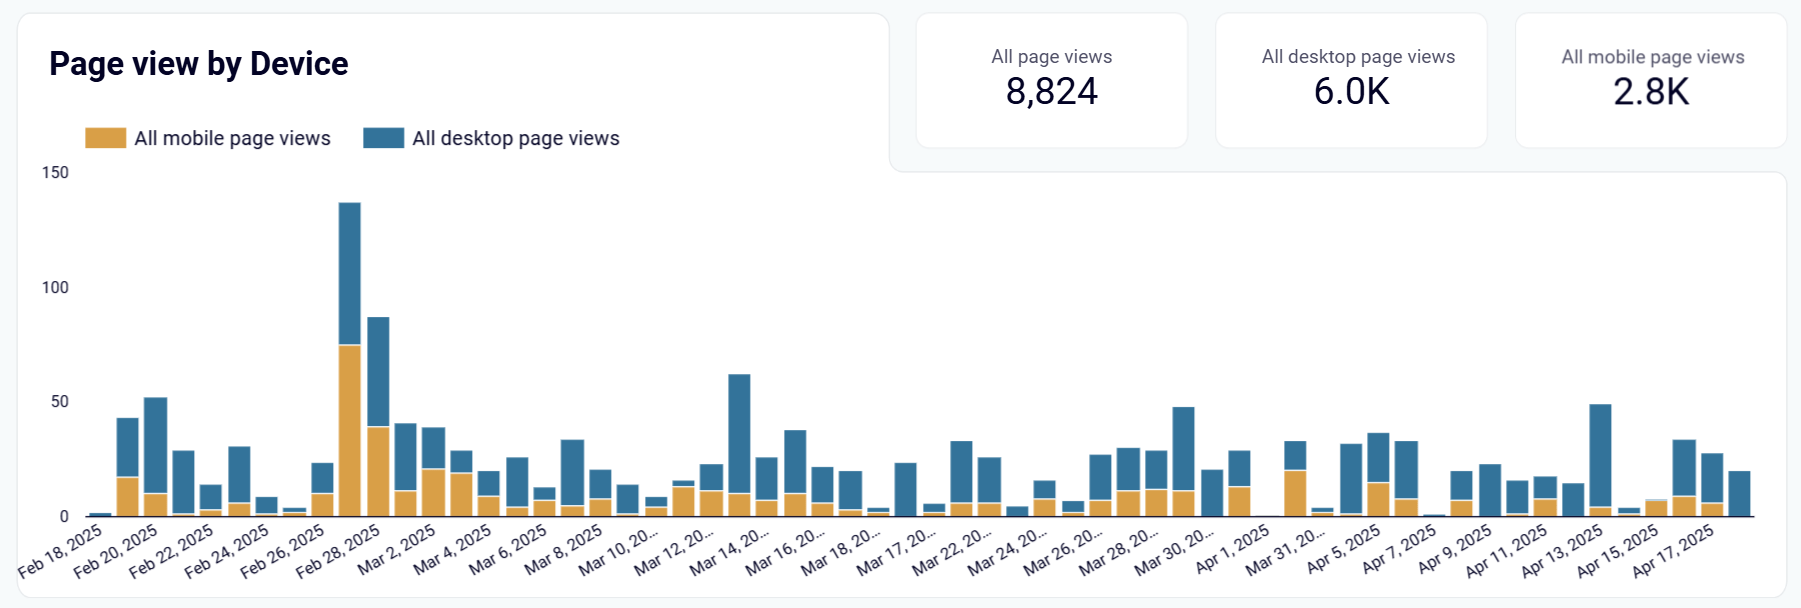
The LinkedIn company page dashboard provides a clear breakdown of how professionals access your content across desktop and mobile devices. This visualization reveals platform preferences among your specific audience segments, helping you optimize content formats and layouts for different screen sizes. By understanding which devices your executive audience and decision-makers prefer, you can ensure your most important content is formatted optimally for their viewing experience, increasing engagement and time spent with your brand.
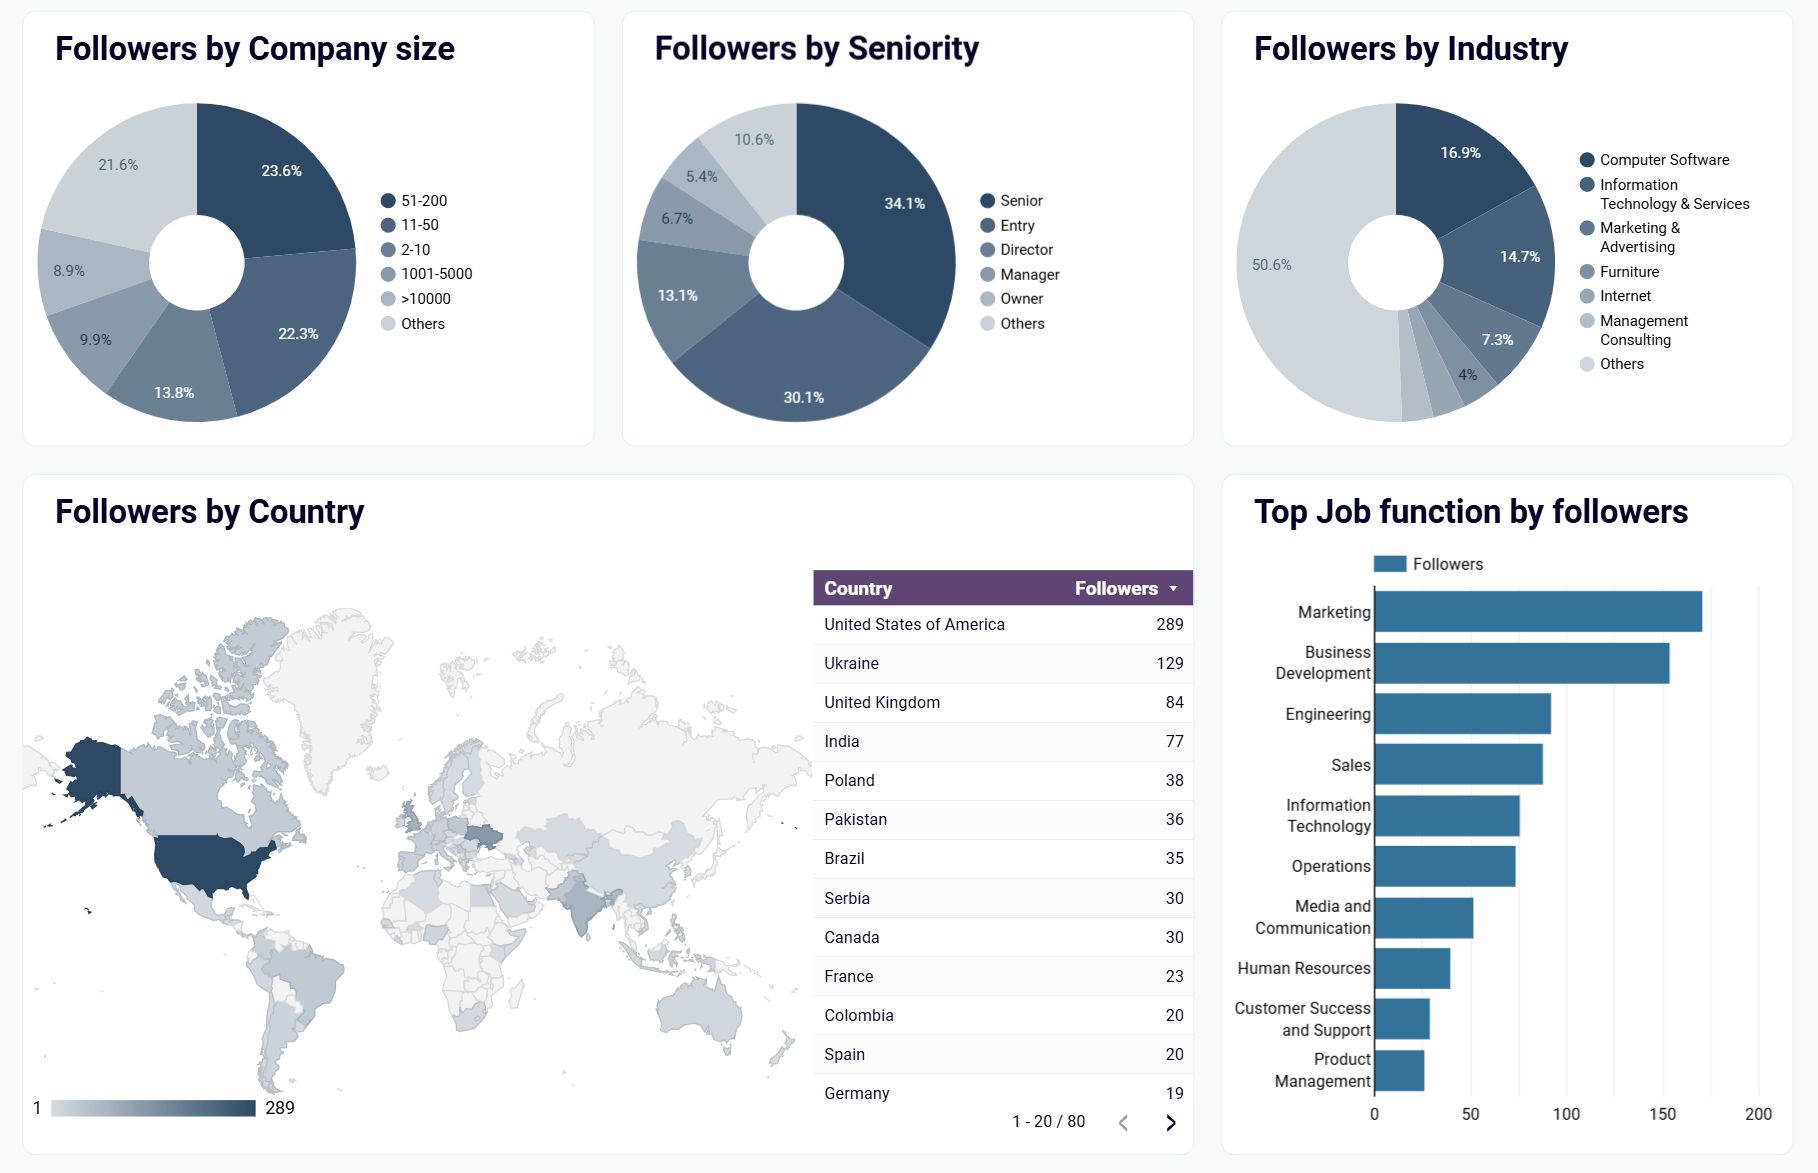
The LinkedIn company page dashboard offers an in-depth follower demographics analysis, breaking down your audience by company size, seniority, industry, and geographic location. This visualization reveals exactly which professional segments are most connected to your brand. This allows you to tailor content specifically to decision-makers, technical professionals, or industry verticals. The comparison between organic and paid follower growth highlights which acquisition strategies are most effective for building your professional audience over time.
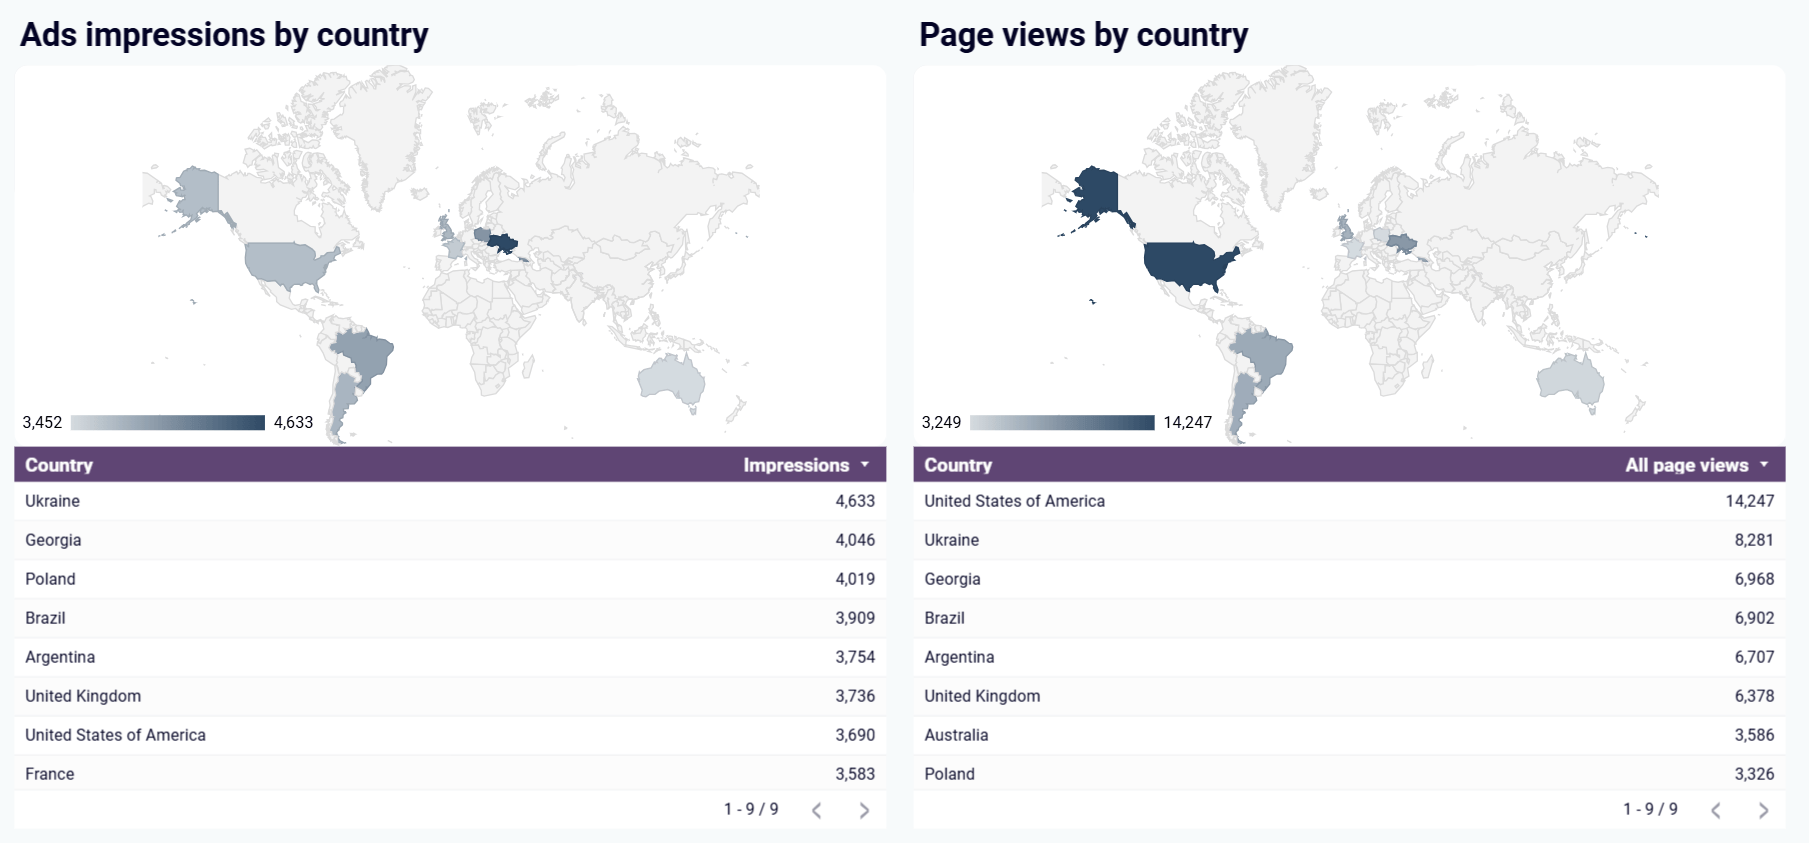
The LinkedIn pages dashboard provides side-by-side geographical visualizations of ad impressions and organic page views by country. This powerful comparison reveals where your paid and organic content resonates most, highlighting potential disconnects between advertising reach and actual engagement. By identifying regions with high ad views but low organic engagement (or vice versa), you can refine regional targeting strategies and allocate resources to markets showing the greatest response to your brand messaging.
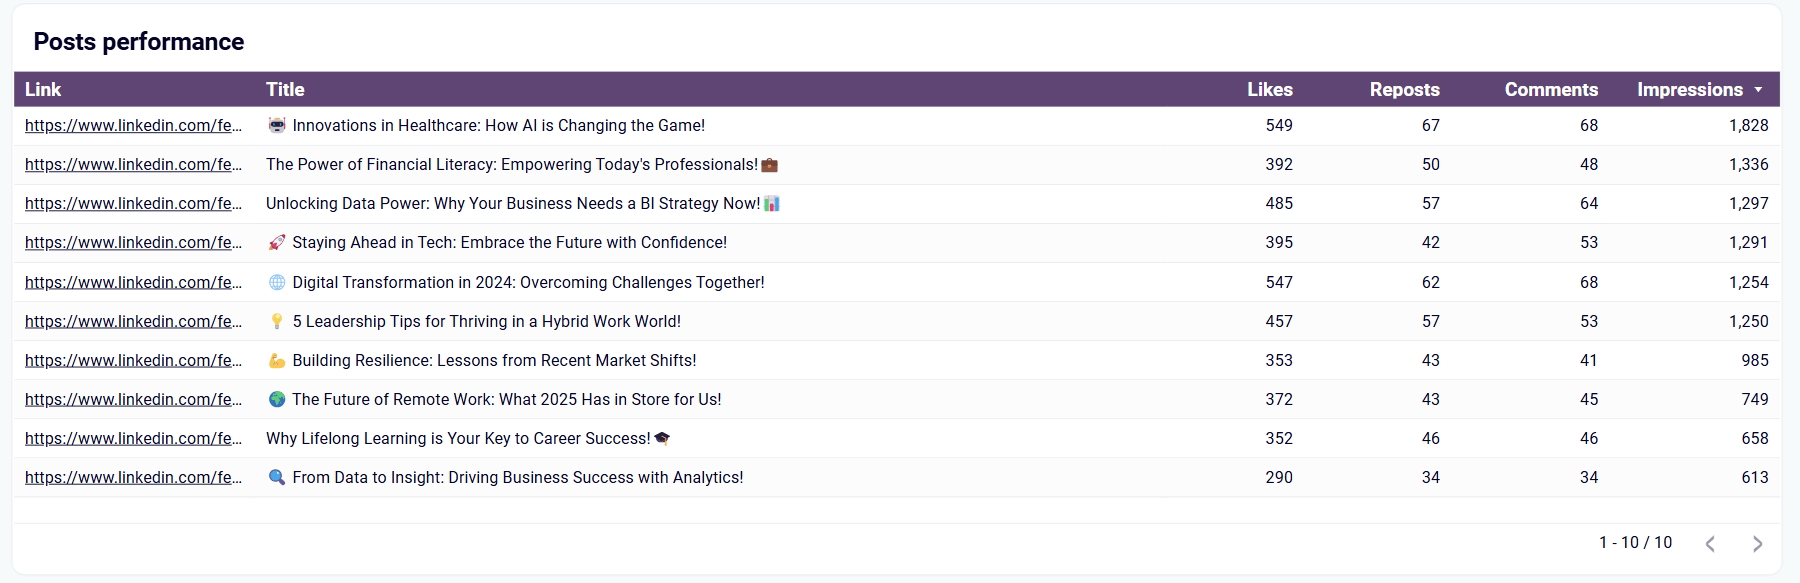
The LinkedIn dashboard delivers detailed performance analytics for each post published on your page. The analysis includes comprehensive metrics on impressions, engagement rates, likes, comments, and reposts for individual content pieces. By comparing different post types side-by-side, you can quickly identify which topics, formats, and publishing times generate the strongest response from your professional audience. This insight allows you to refine your content calendar and publishing strategy to maximize audience interaction and brand visibility.
How to create a LinkedIn dashboard?

Metrics you can track with a LinkedIn dashboard template
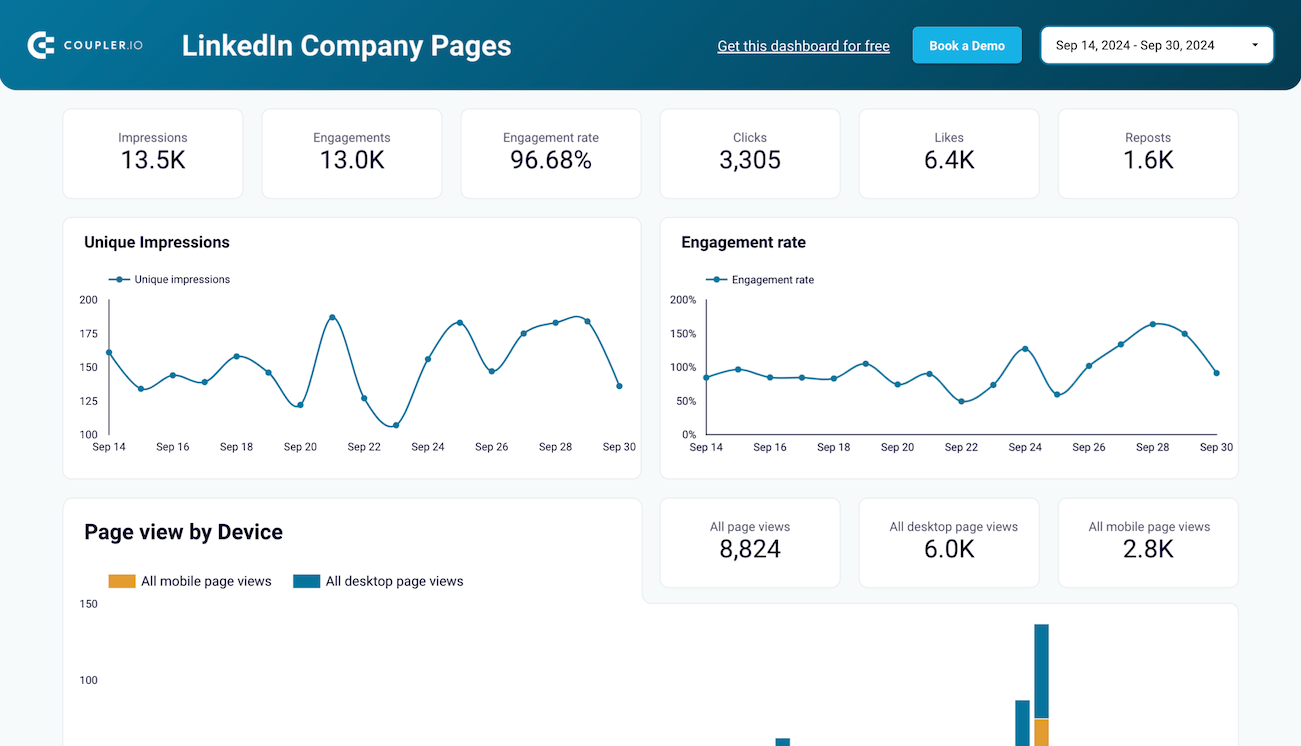
Track the total number of times your LinkedIn content is displayed to professionals across the platform. This fundamental visibility metric helps you measure your brand's reach within specific industries and professional segments, providing context for engagement metrics and helping you evaluate the initial impact of your campaigns and content strategy.
Monitor how often professionals click on the content you share on your LinkedIn company page. This engagement metric provides direct insight into which posts generate genuine interest, helping you refine your content approach to increase meaningful interactions with your professional audience.
Measure how effectively your LinkedIn content resonates with professional audiences by calculating interactions (likes, comments, shares) as a percentage of total impressions. This quality metric helps identify which topics and content formats drive meaningful professional engagement, allowing you to refine your content strategy to better connect with industry-specific audiences.
Analyze how professionals access your LinkedIn company page across desktop and mobile devices. This behavioral metric reveals platform preferences among your specific audience segments, helping you optimize content formats and layouts to deliver the best experience regardless of how executives and decision-makers choose to engage with your brand.
Track the various ways professionals publicly engage with and endorse your content with a LinkedIn profile dashboard. These social proof metrics demonstrate how effectively your messaging resonates with industry audiences and provides valuable insight into which content types generate discussion, attract endorsements, and inspire professionals to share with their own networks.
Monitor the size of your LinkedIn audience who have explicitly opted to see your content in their feeds. This community metric measures your brand's growing influence within professional circles and provides a base for calculating engagement rates, helping you track audience-building effectiveness over time across different industry segments and professional roles.
Track the growth of your LinkedIn audience over time using the LinkedIn profile dashboard. This expansion metric shows how successfully your content and engagement strategy attracts new professional followers, providing insight into your brand's increasing influence within targeted industry segments and professional communities.