Expenses dashboard examples and reporting templates
Track your business spending patterns, vendor obligations, and customer payment cycles with automated reporting that pulls data directly from QuickBooks or Xero. Monitor income against expenditures, analyze payment timing, and identify cash flow patterns that impact your operating budget. Our expenses dashboard templates transform accounting data into visual reports that reveal where money flows in and out of your business.
Expenses dashboard examples for every need


about your case. It doesn't cost you a penny 😉
Choose your white label expenses dashboard to kick off
What is an expenses reporting dashboard?
Through automated data connections via Coupler.io, your expenses reporting dashboards refresh on schedule without manual exports or data entry, ensuring financial decision-makers work with current information about obligations and incoming payments.

What reports should be included in expenses dashboards?
Managing business expenses requires visibility into multiple financial streams that affect your available cash. Revenue tracking shows what's coming in, accounts payable reveal what you owe, and accounts receivable indicate what customers owe you. Together, these reports create a complete picture of your financial position and spending capacity. An effective expenses dashboard template brings these elements together so you understand not just individual transactions but the relationships between income, obligations, and collection timing.
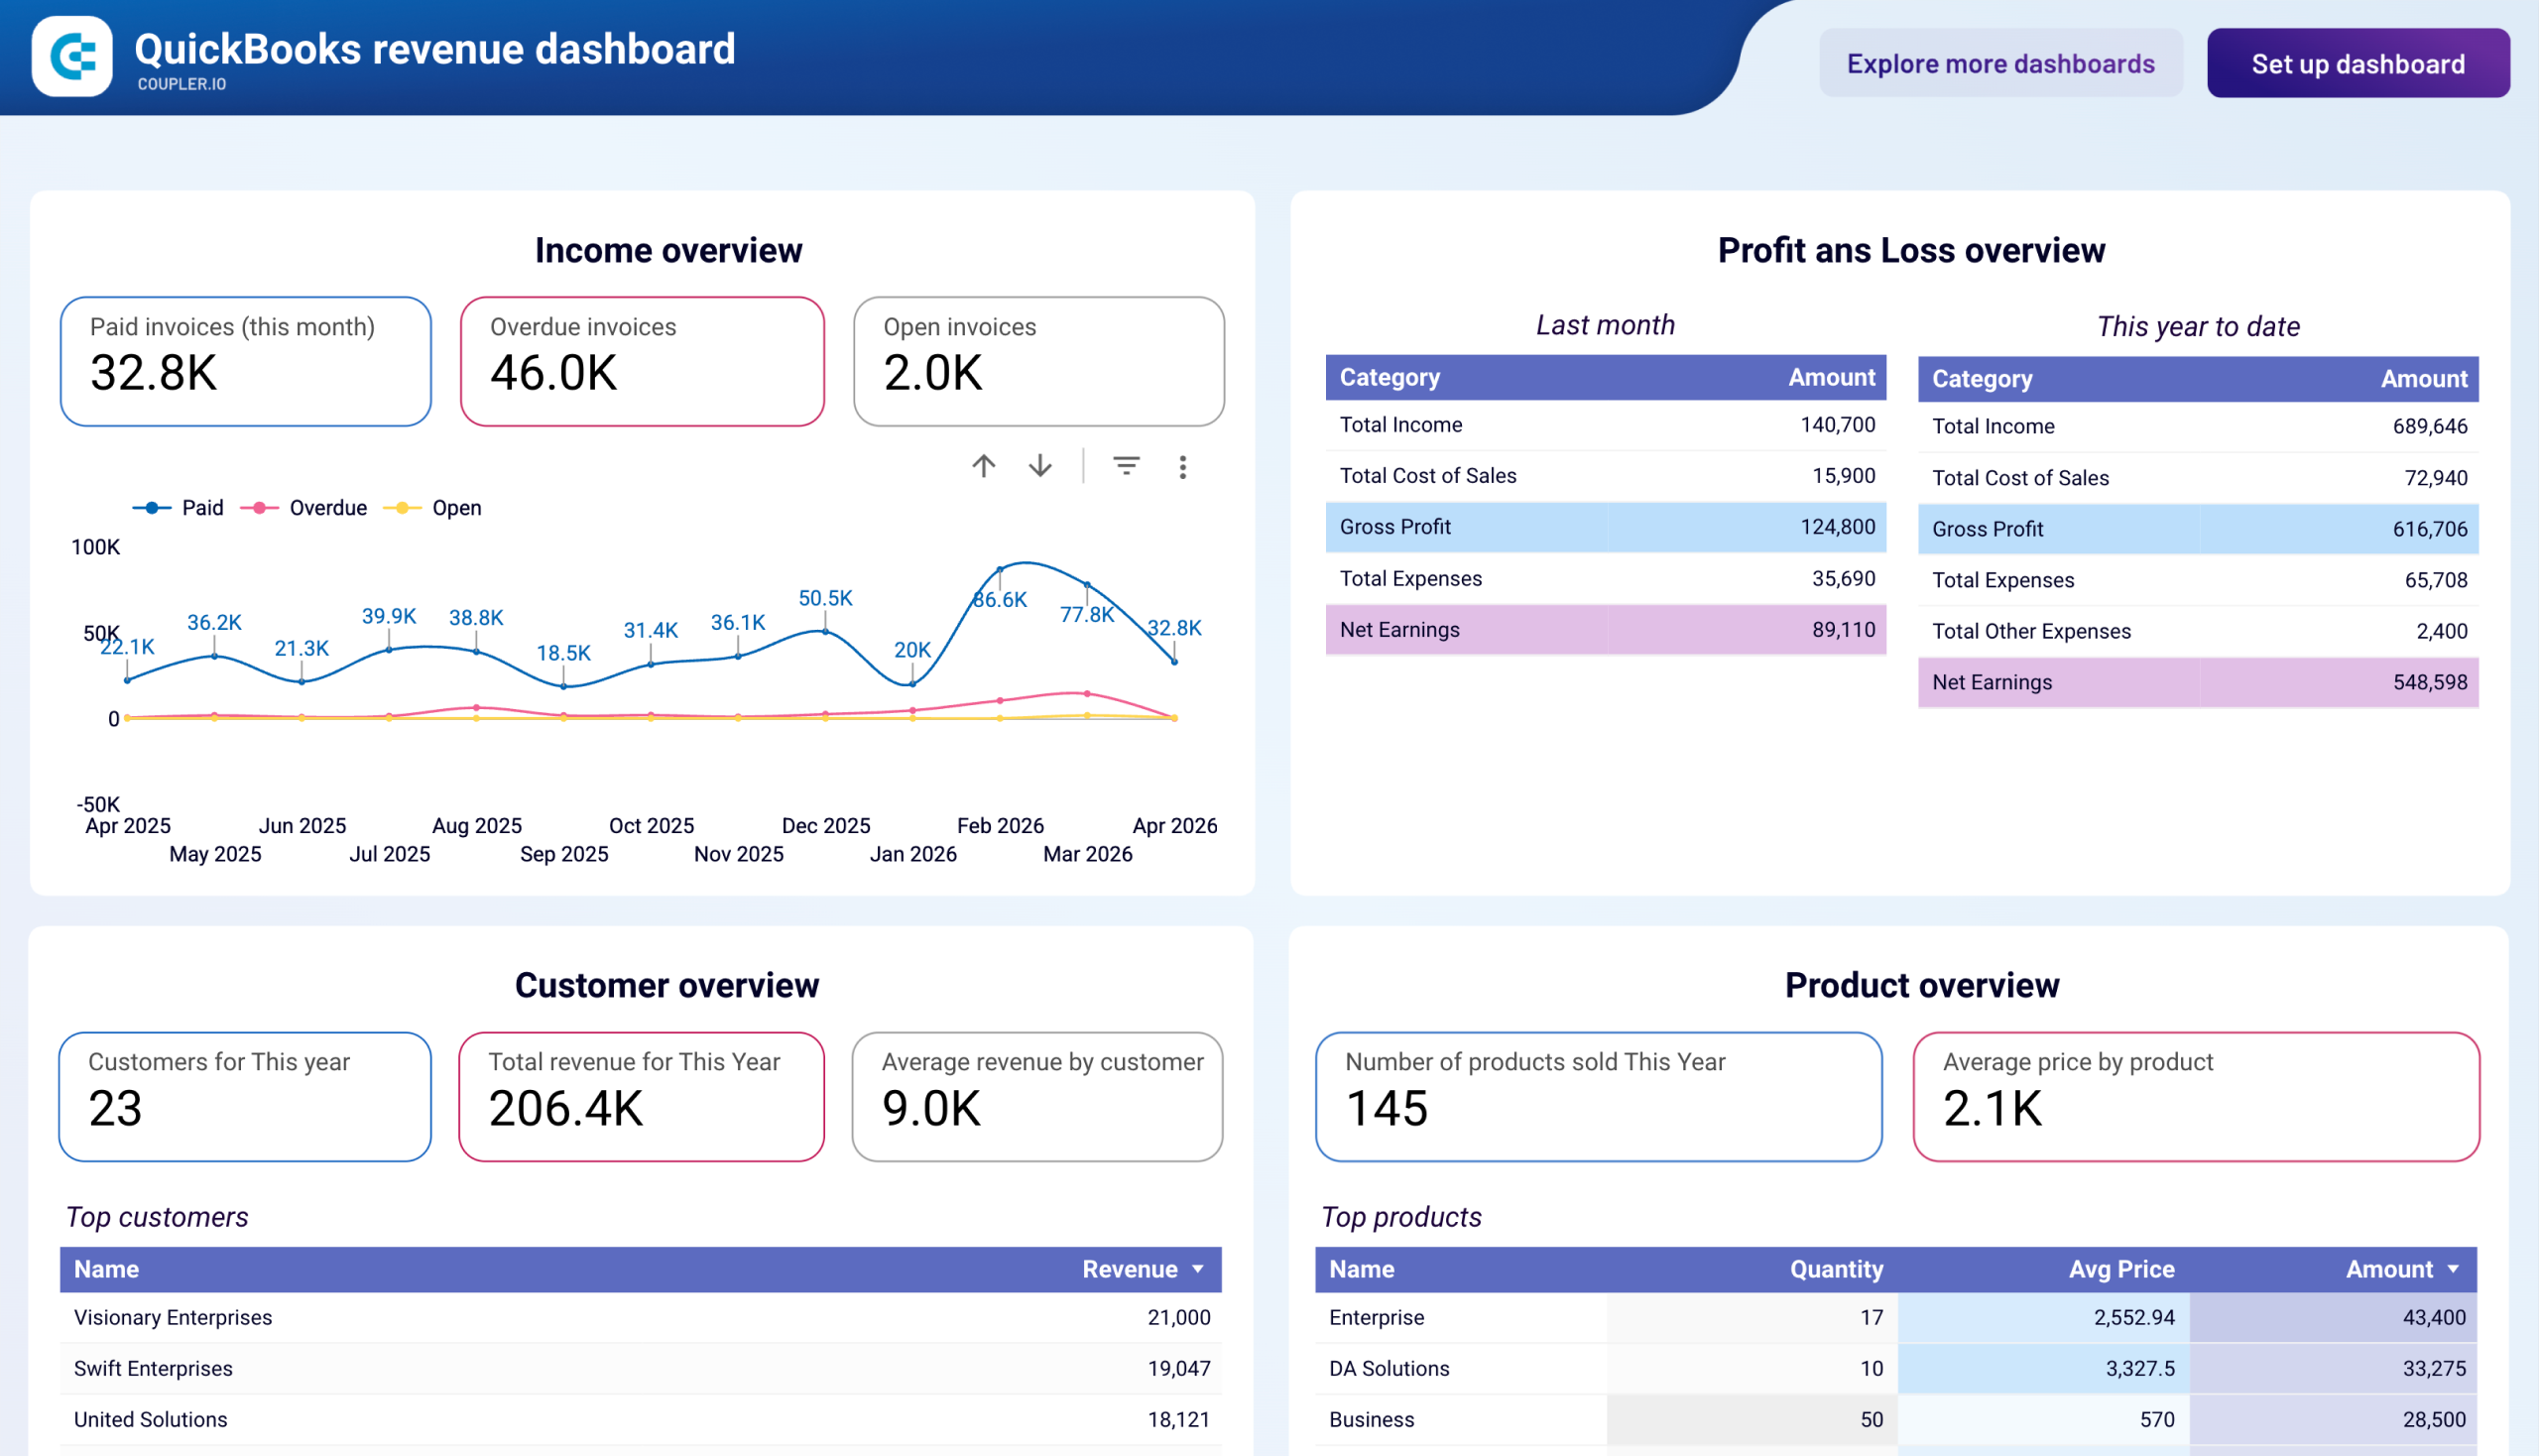
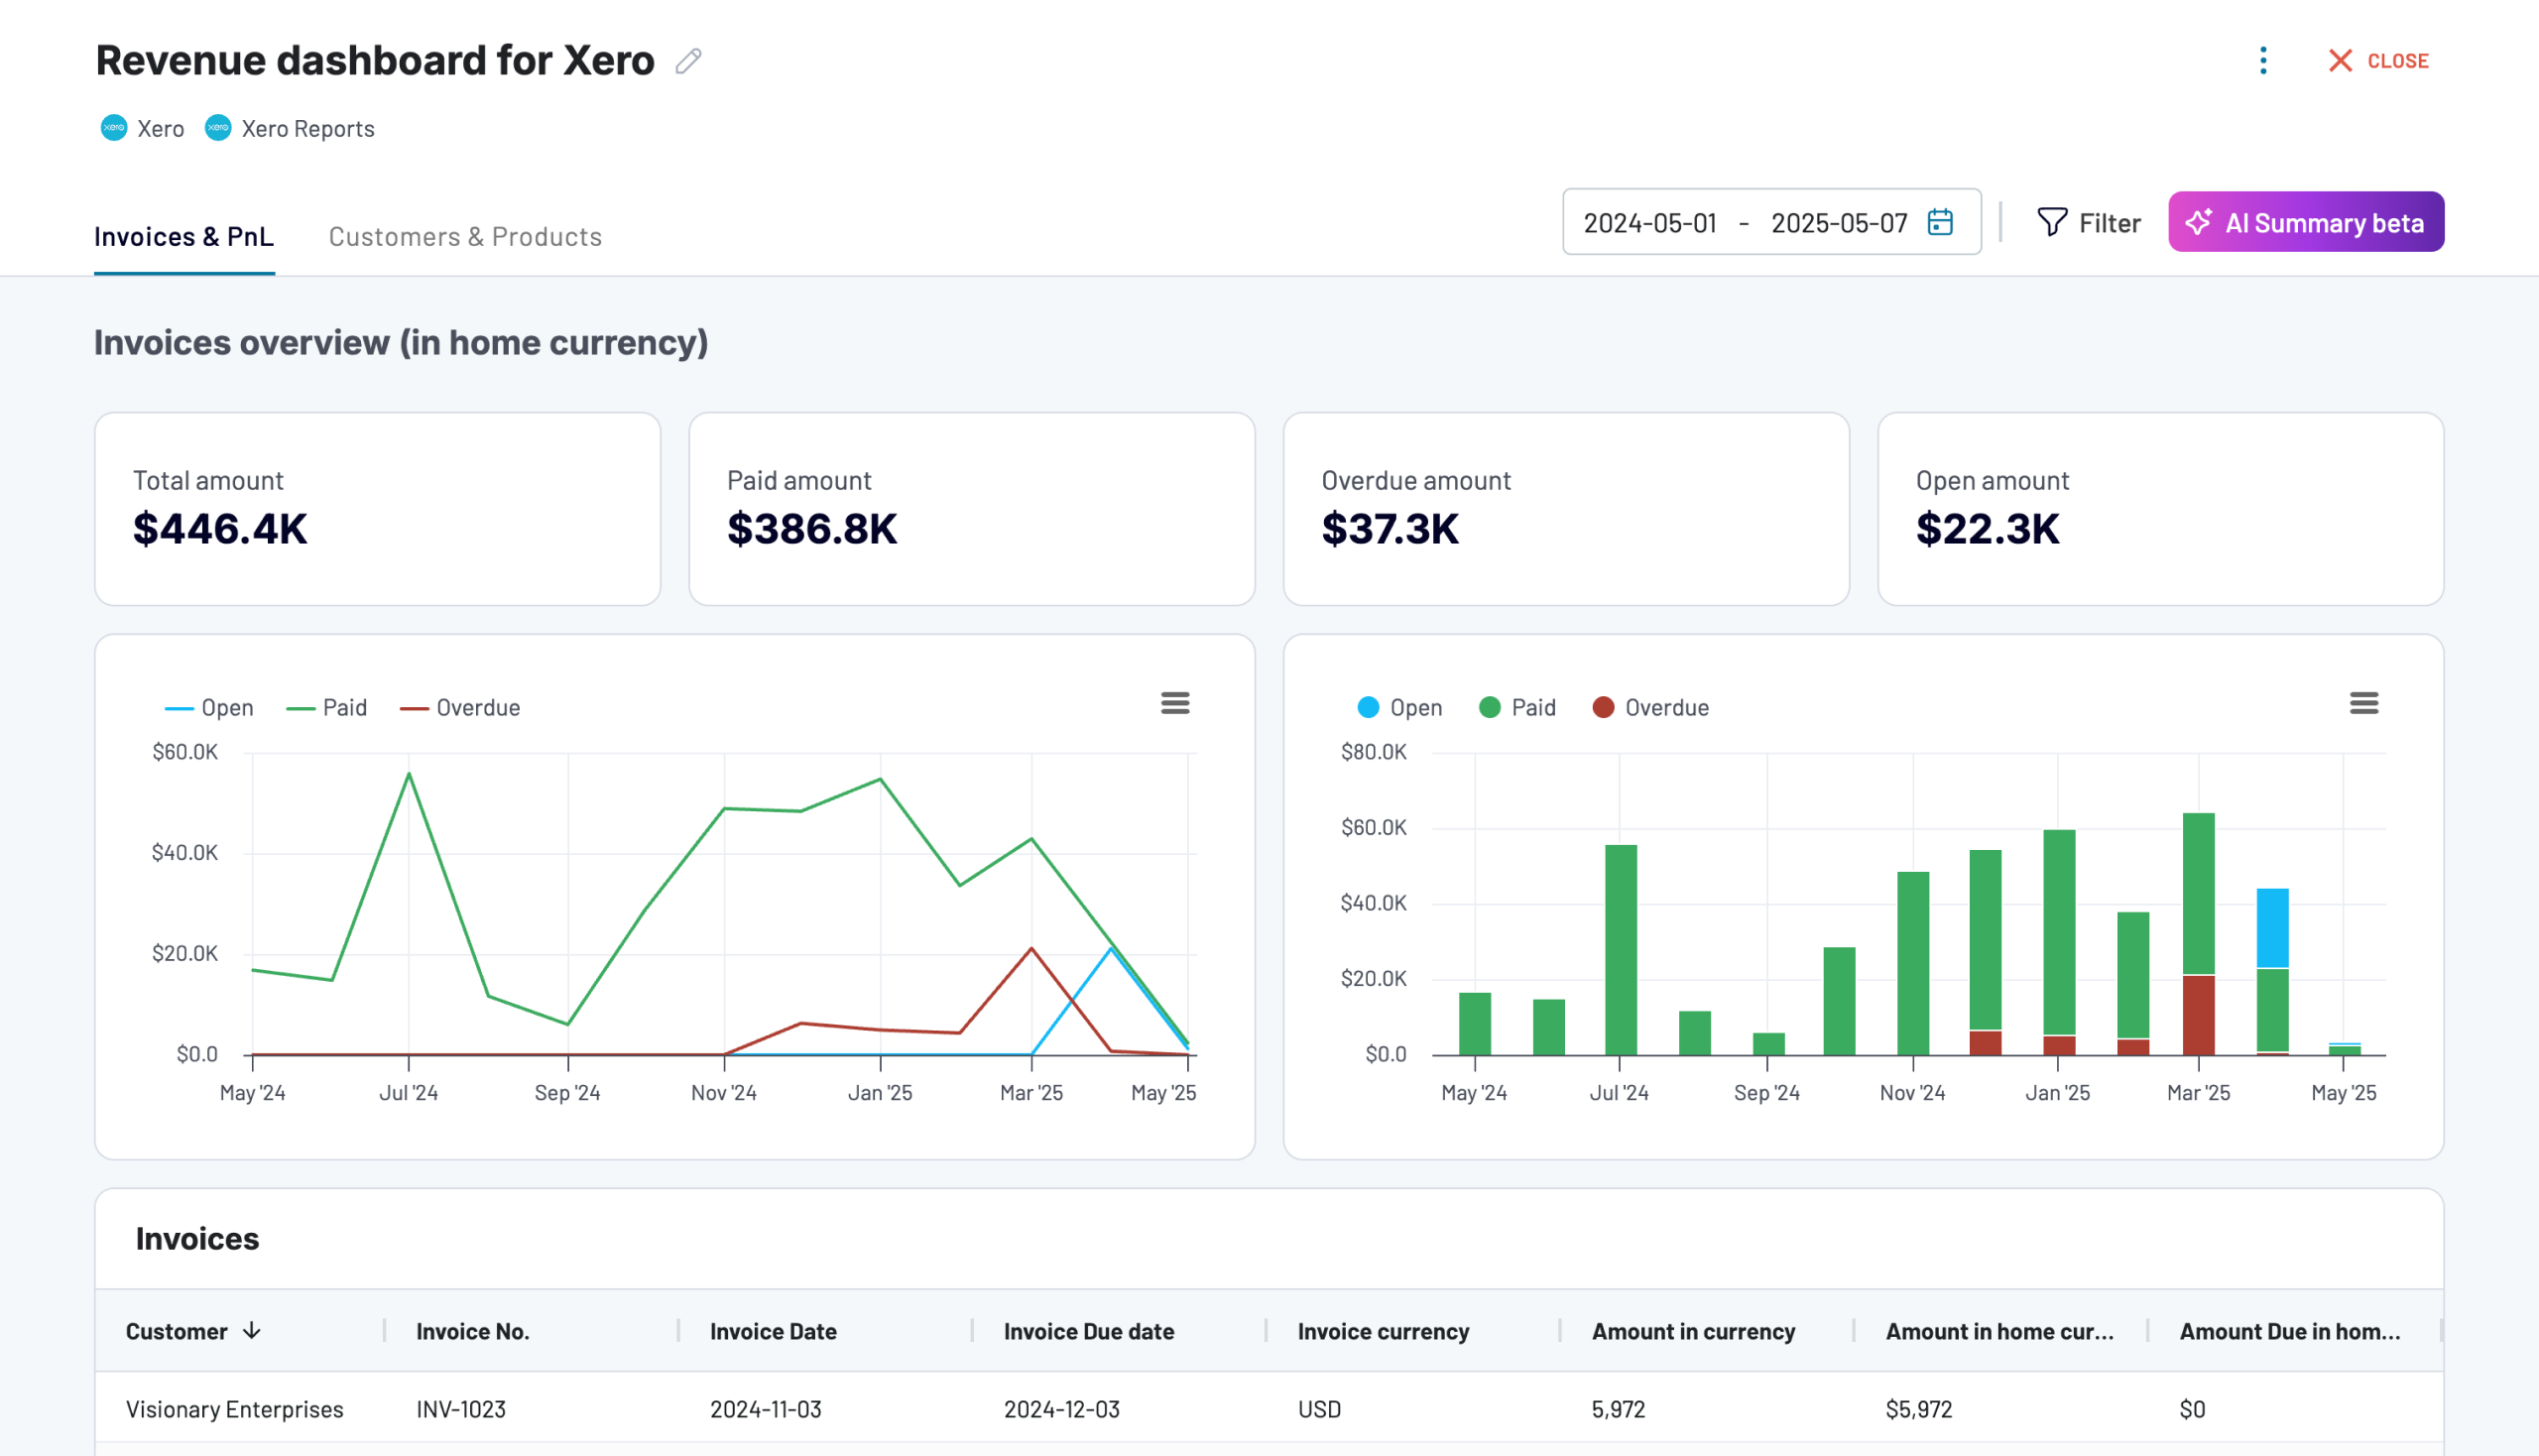
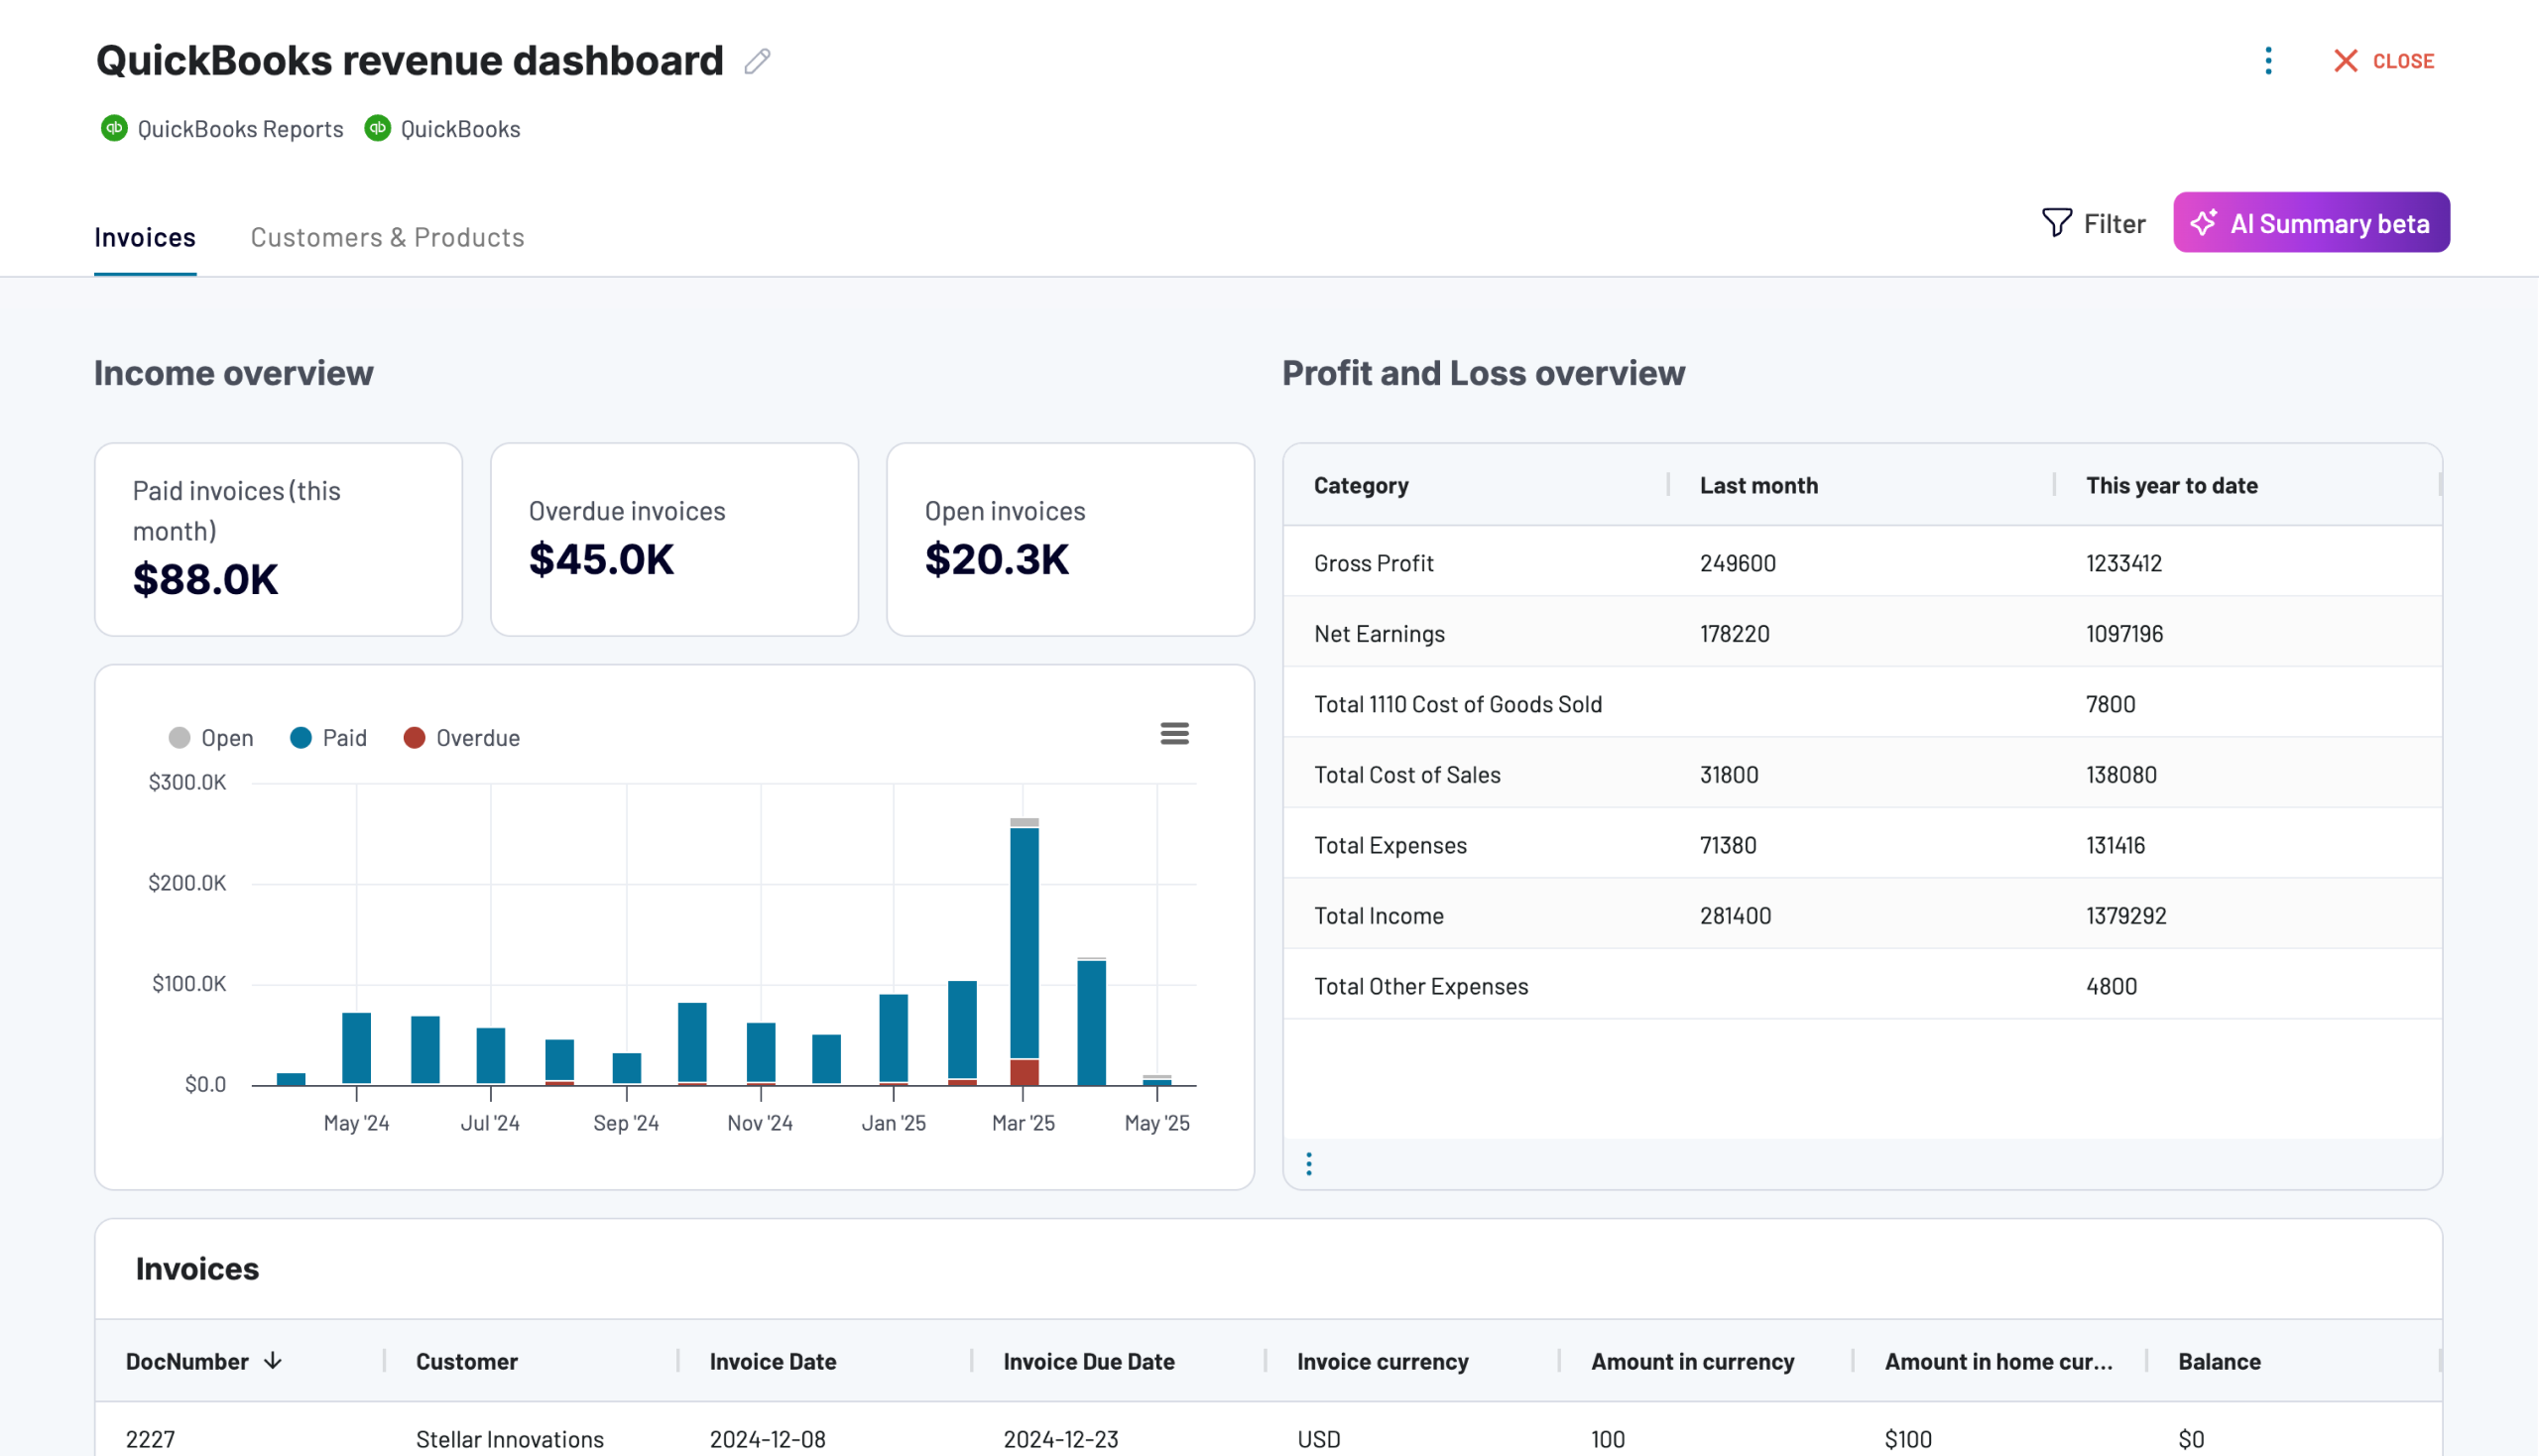
Revenue tracking provides the foundation for understanding your spending capacity by showing income patterns across twelve-month periods. This report reveals seasonal fluctuations that affect when cash is available for expenses, identifies peak revenue periods when you have more flexibility for vendor payments, and spots unexpected income dips that may require spending adjustments.
The profit and loss analysis reveals how effectively you manage costs relative to income by comparing what you earn against what you spend. This report goes beyond simple revenue tracking to show whether your business actually retains money after covering all expenses, or if spending outpaces income despite healthy revenue numbers. By examining expenses as a percentage of revenue, you identify whether costs are proportionate to business size or if spending has grown faster than income.
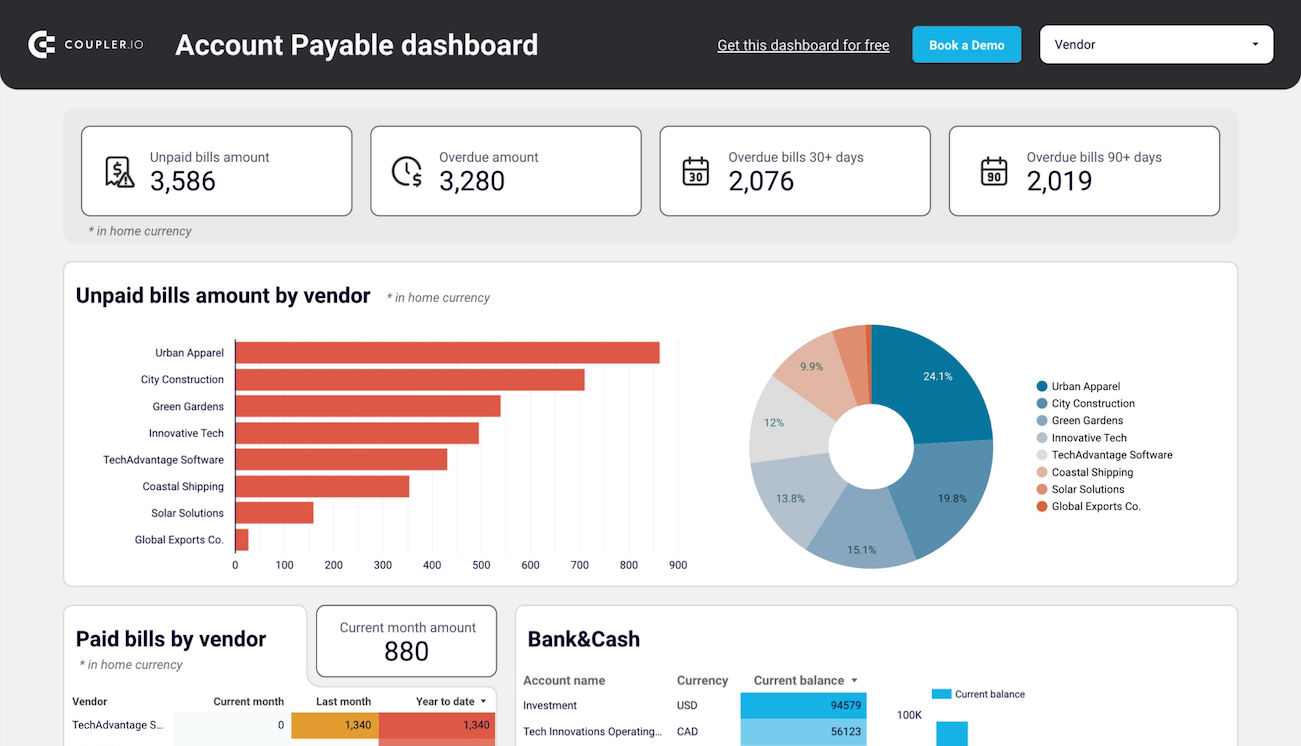
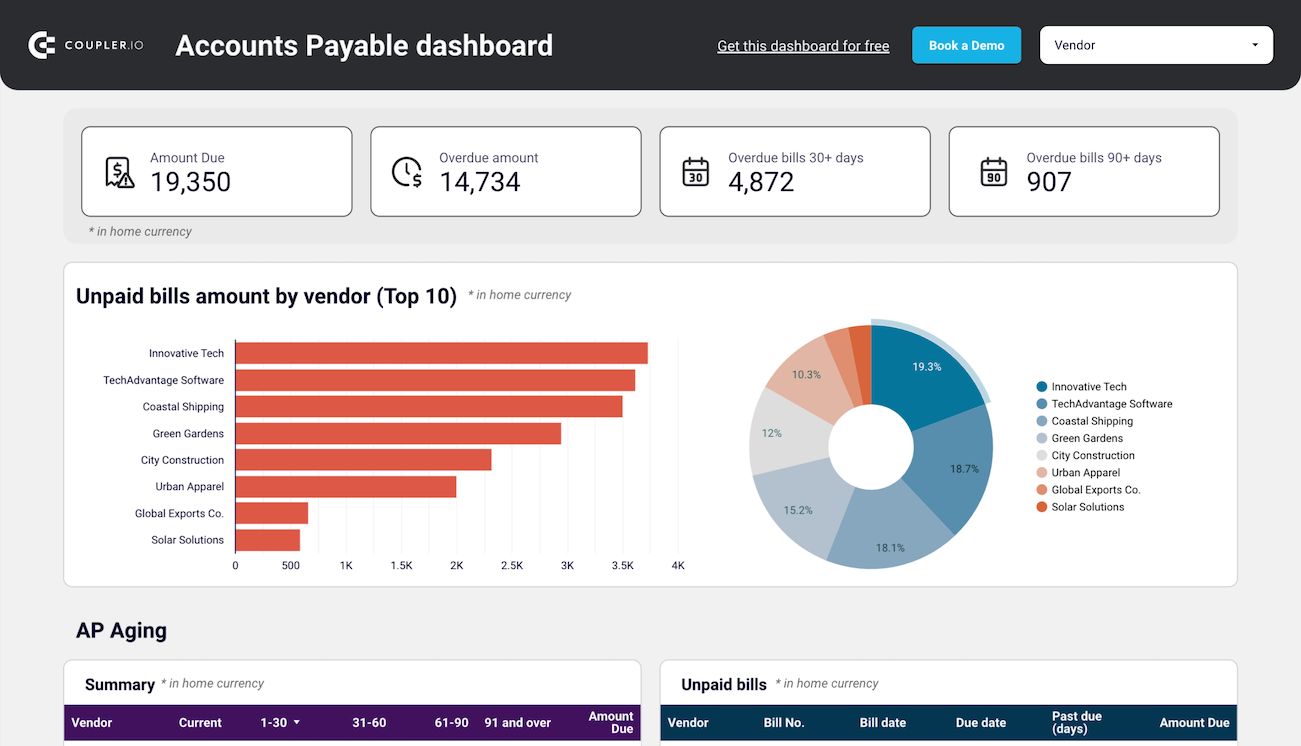
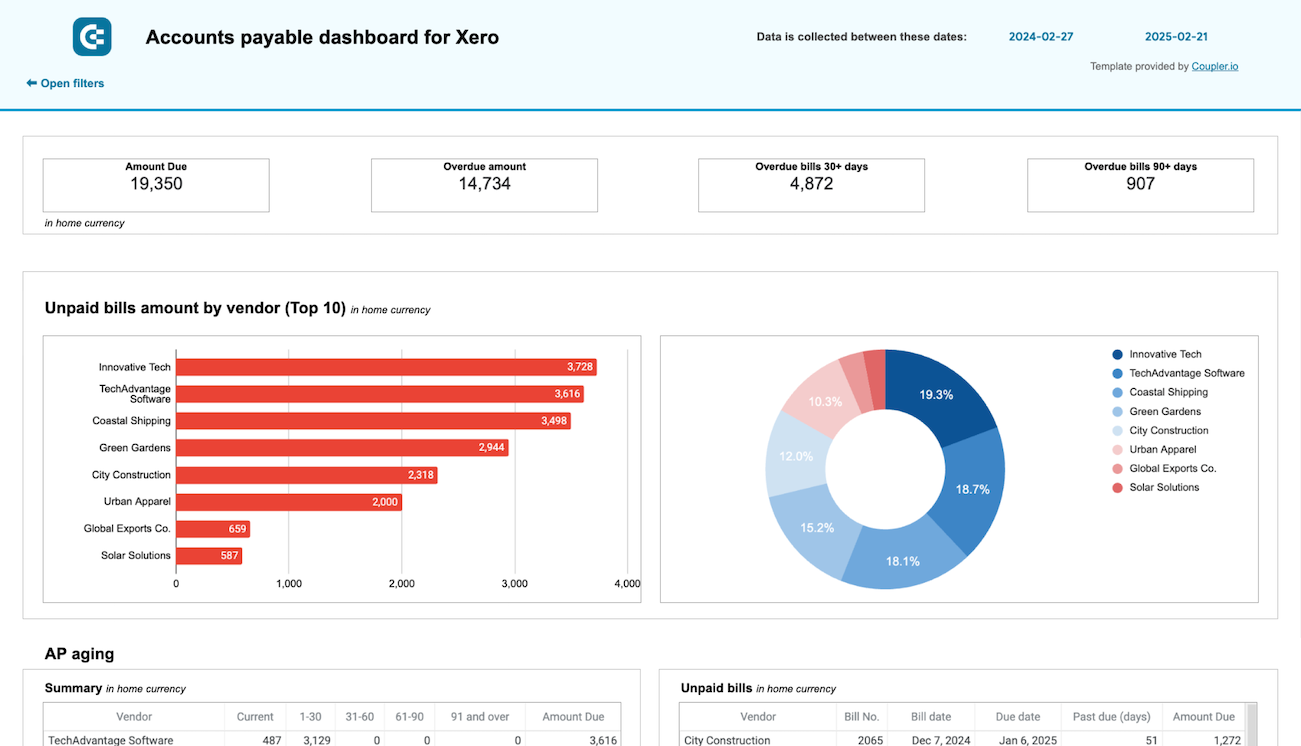
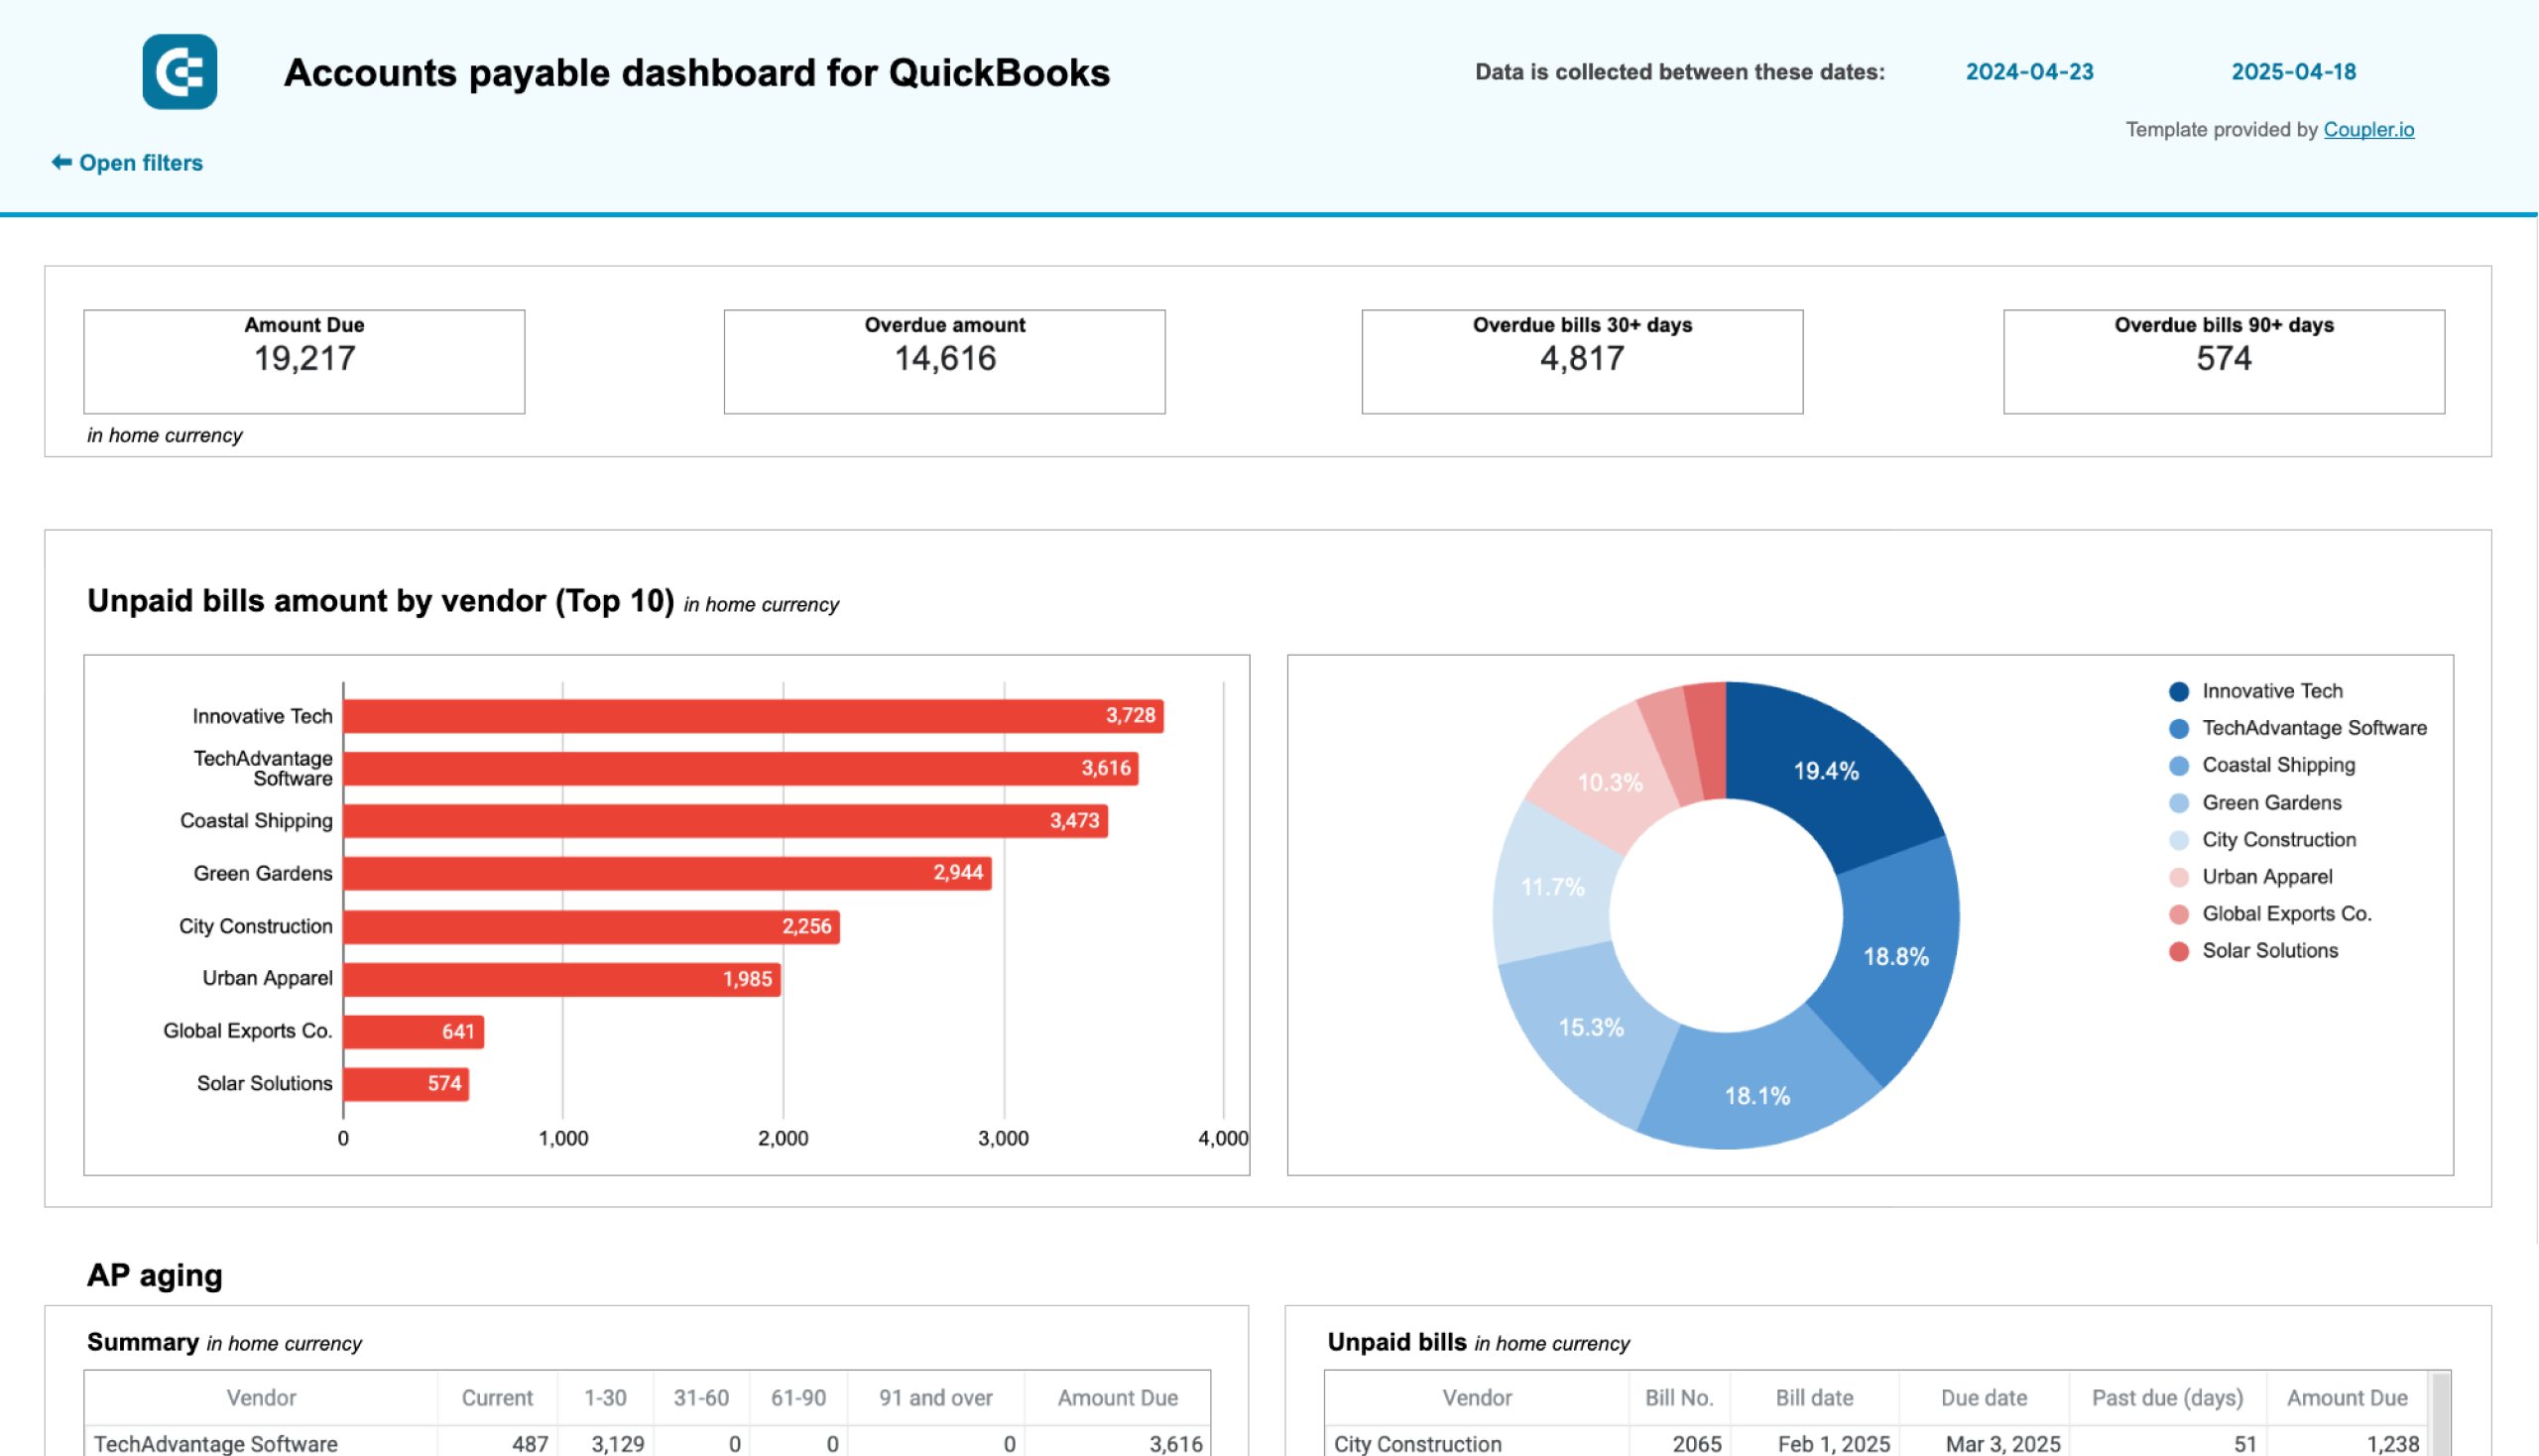
The vendor payment obligations report displays all outstanding bills with detailed aging information showing how long payments have been due. This expenses reporting dashboard component breaks down unpaid amounts by vendor and time period—current bills, those due within 30 days, 31-60 days overdue, 61-90 days overdue, and bills past 90 days. Filtering by specific vendors reveals your largest creditors and helps prioritize which payments require immediate attention to maintain relationships and avoid late fees.
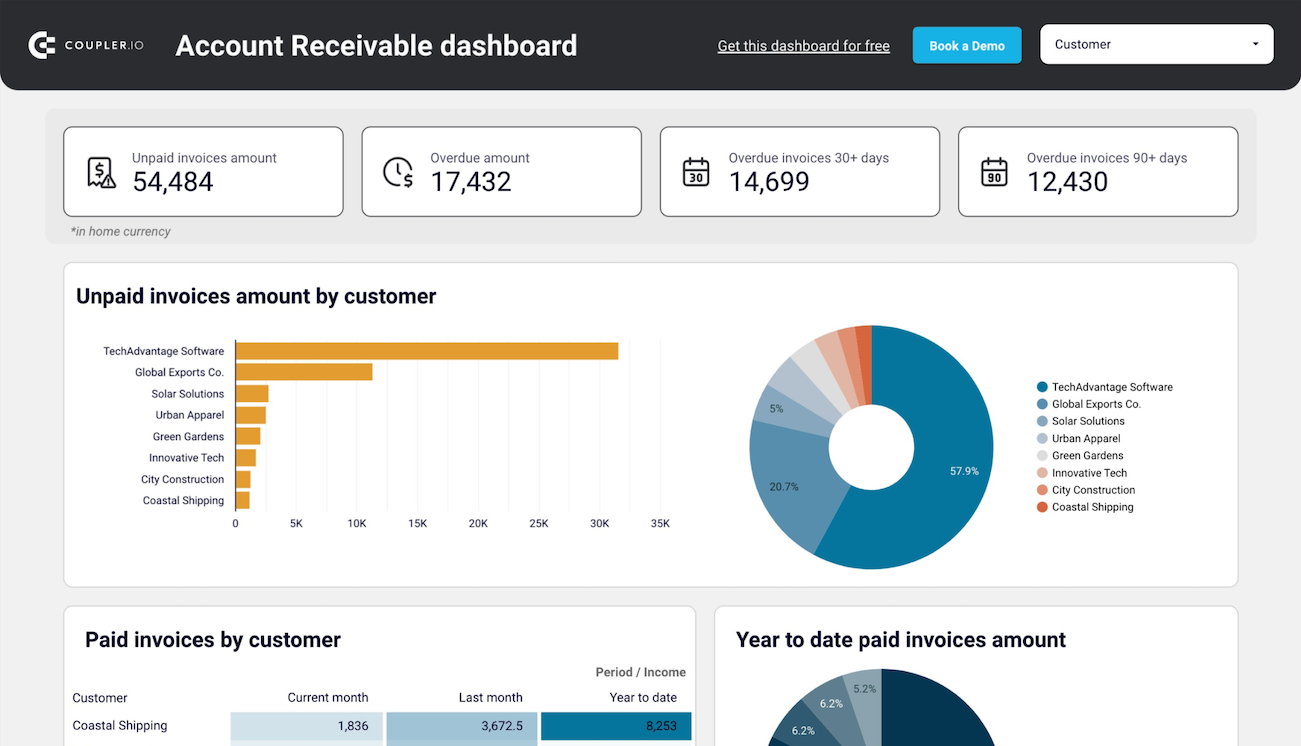
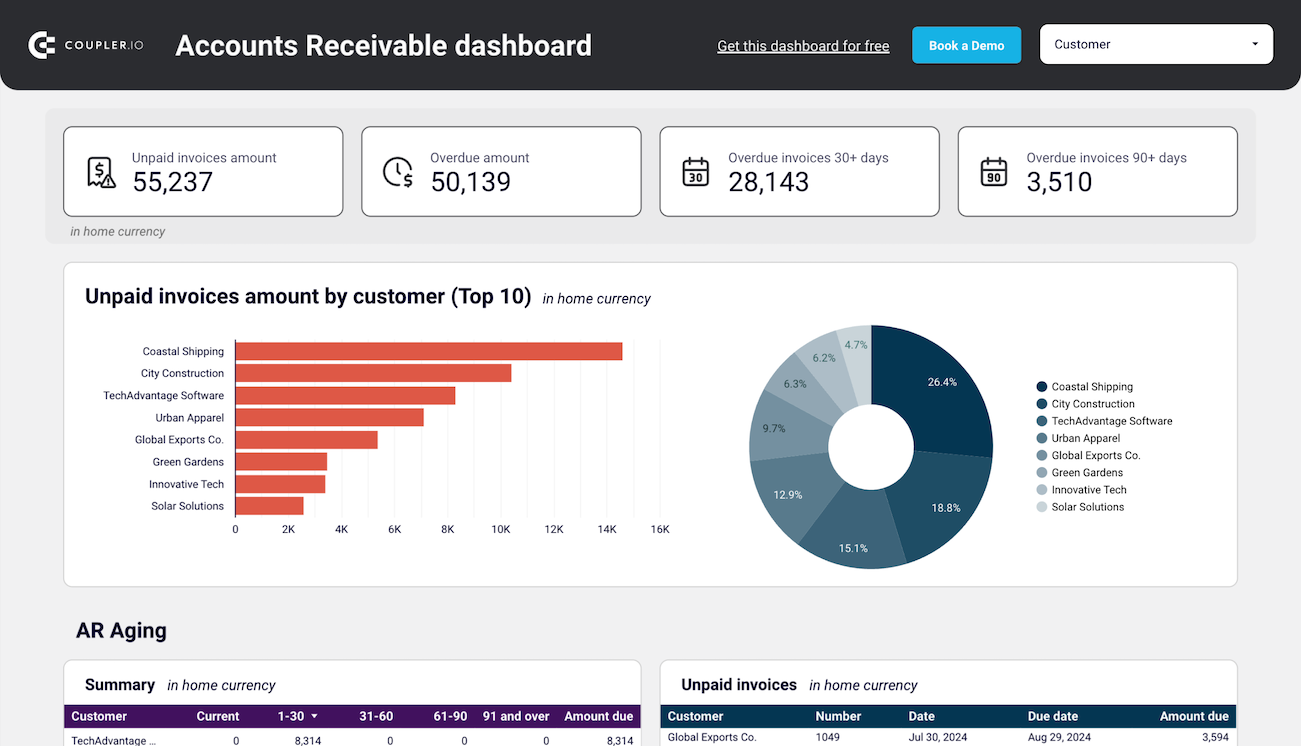
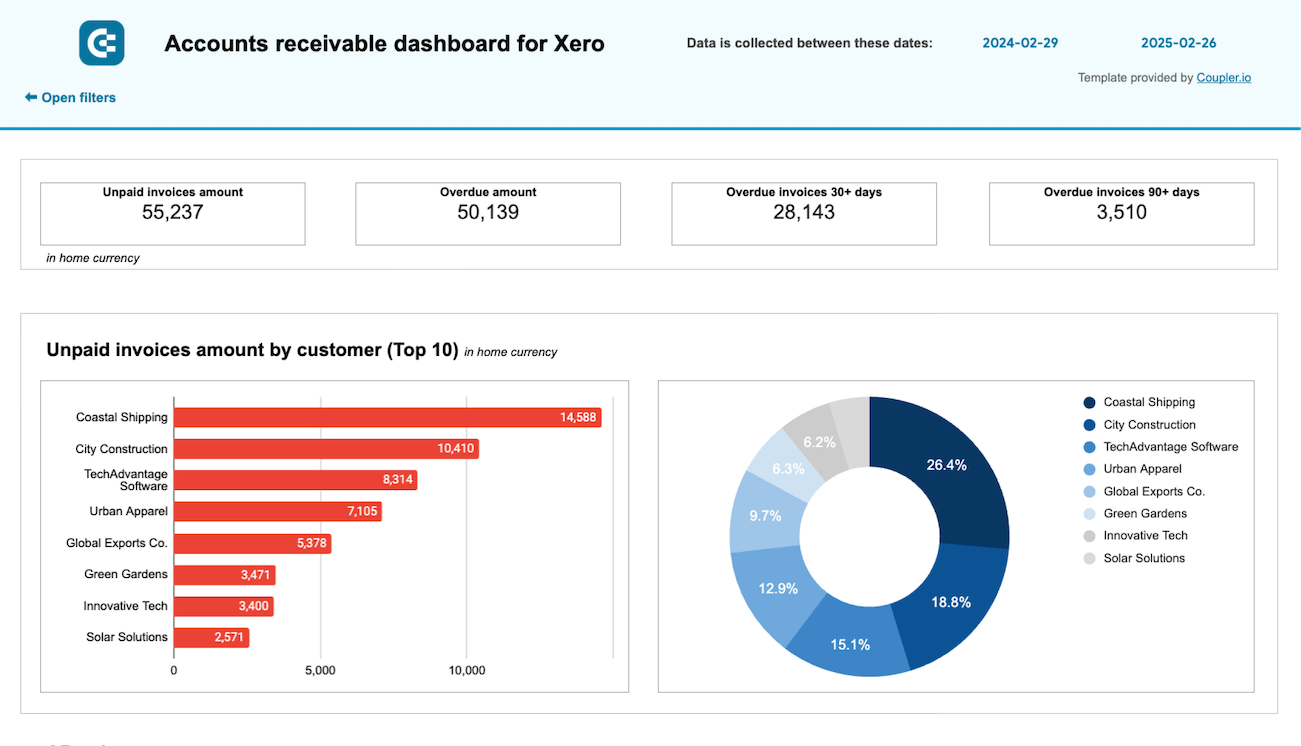
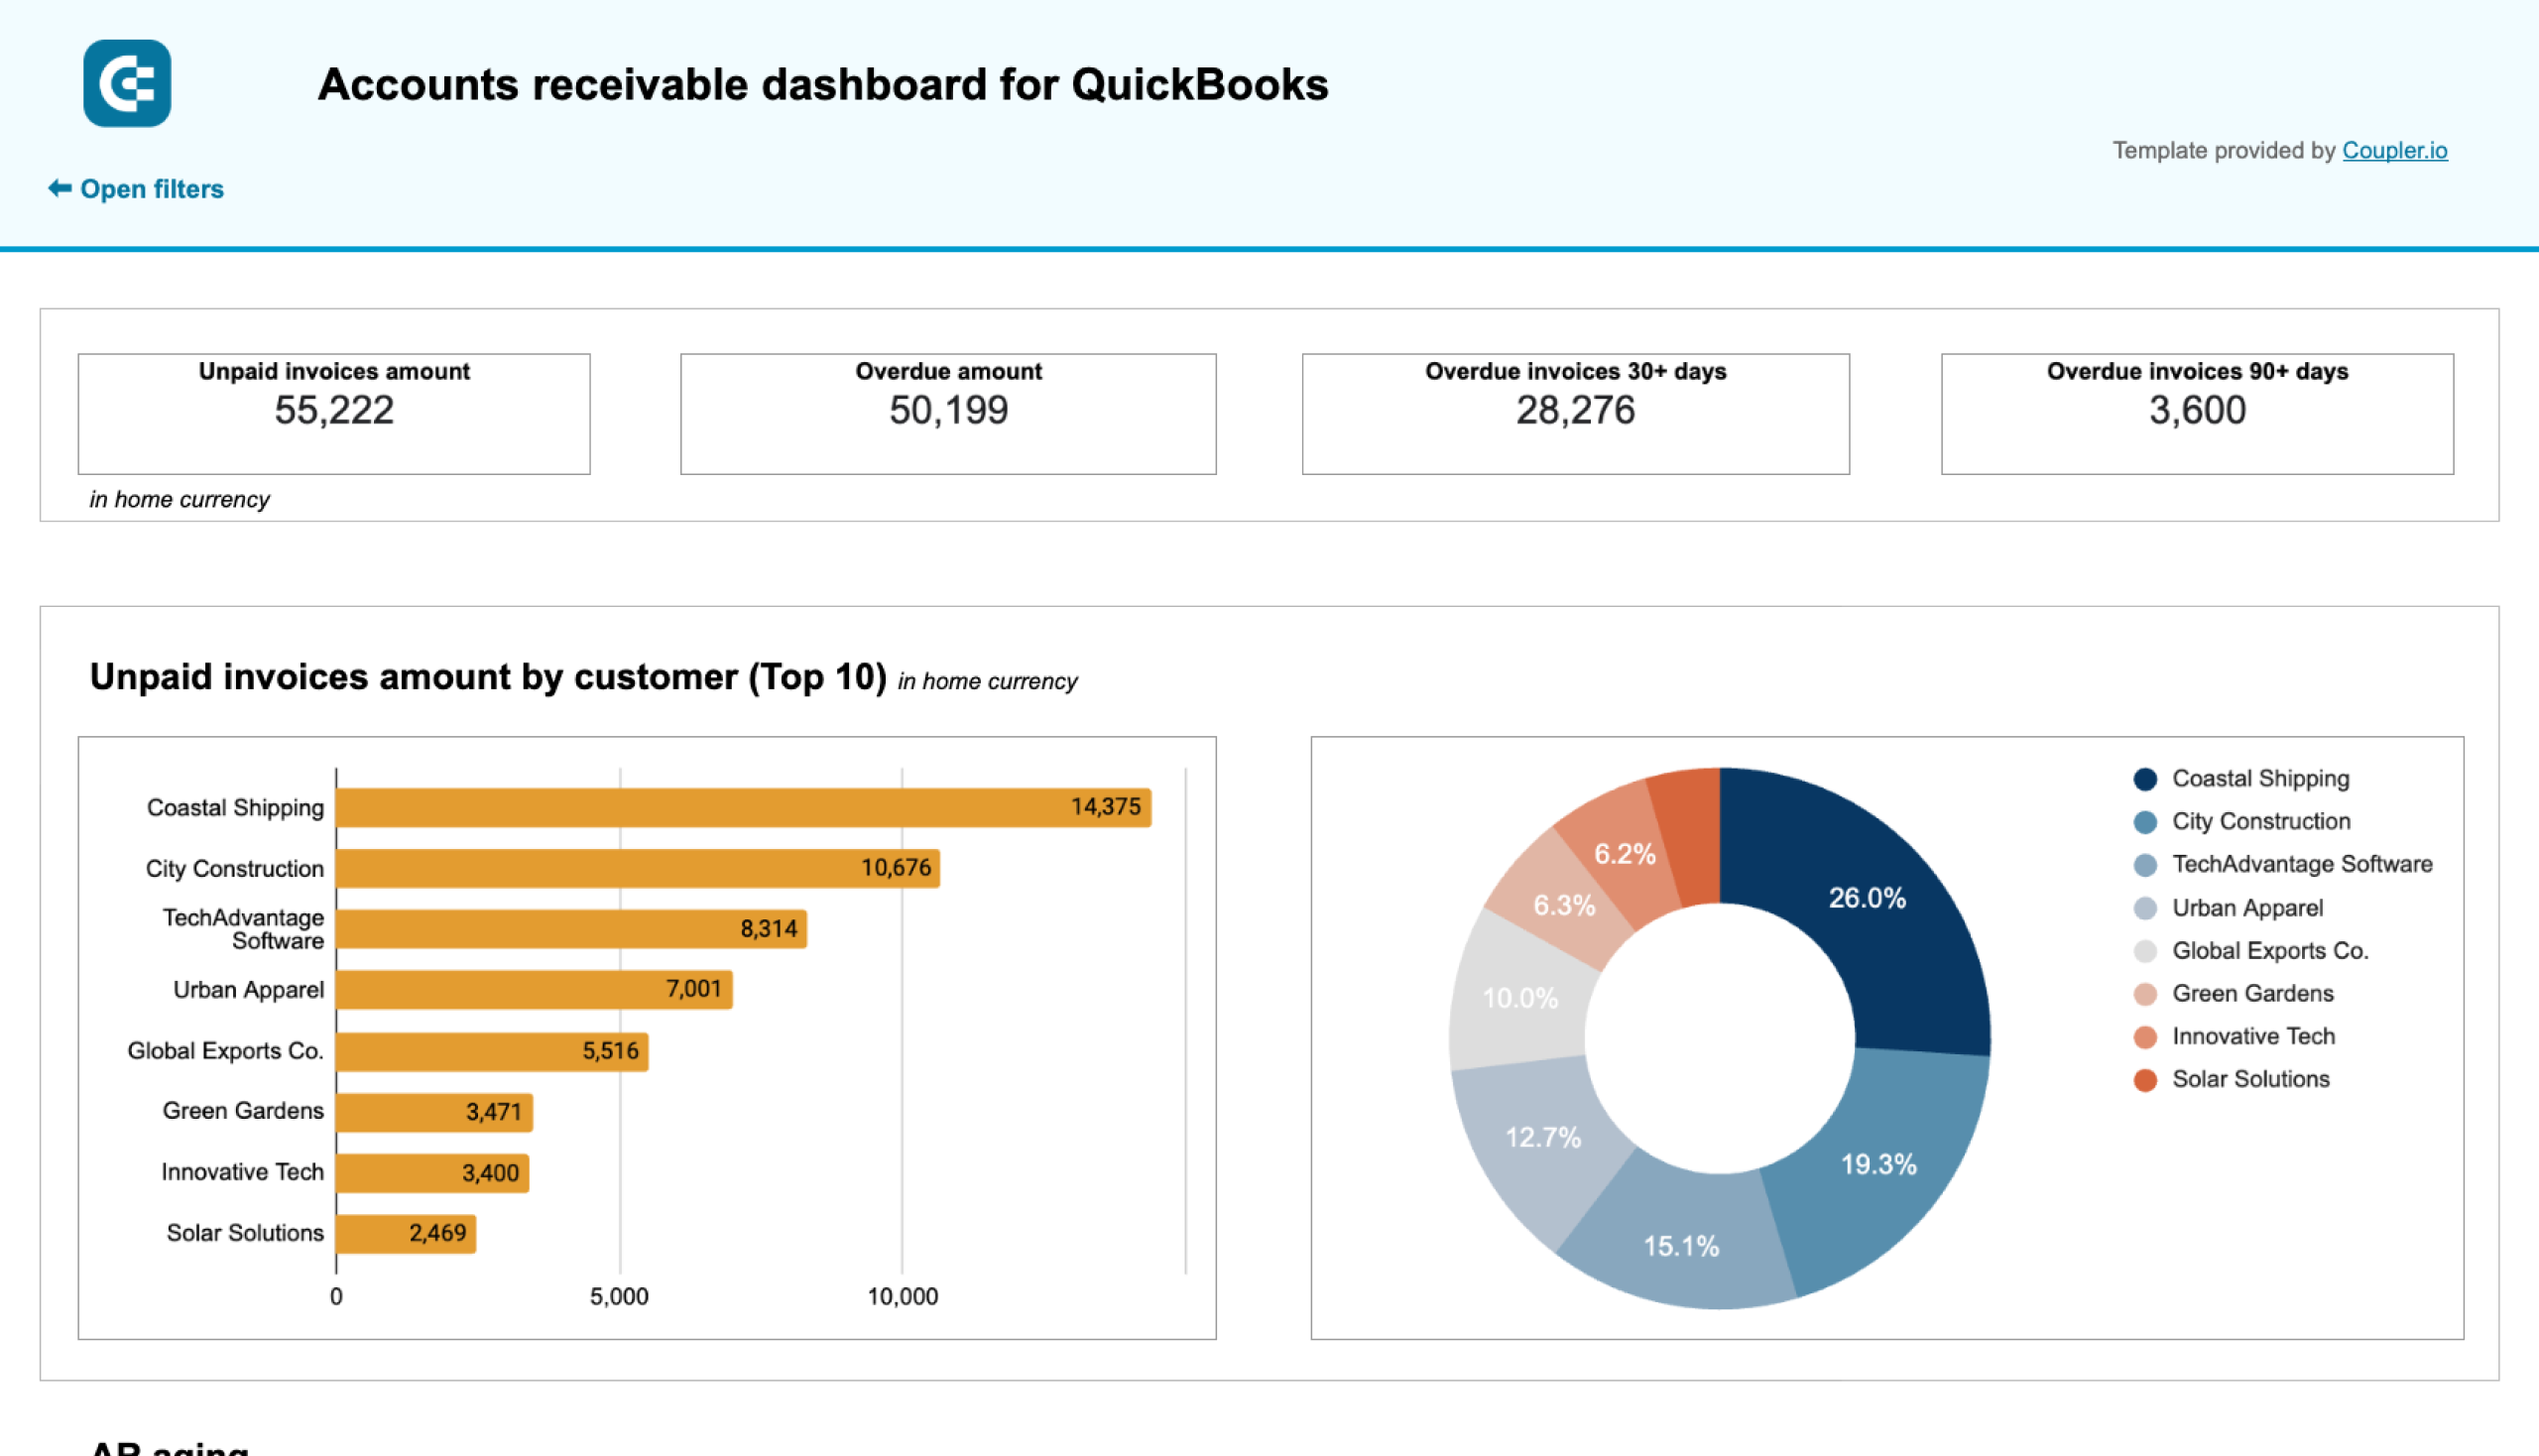
Customer payment tracking shows money customers owe you, organized by how long invoices have been outstanding. This report is critical for expenses management because delayed customer payments directly impact your ability to pay vendor bills—you can't pay what you're owed if customers haven't paid what they owe. The aging breakdown by 30-day periods reveals which customers are slow to pay and helps you prioritize collection efforts on overdue amounts.
What insights you can get with the expenses dashboard
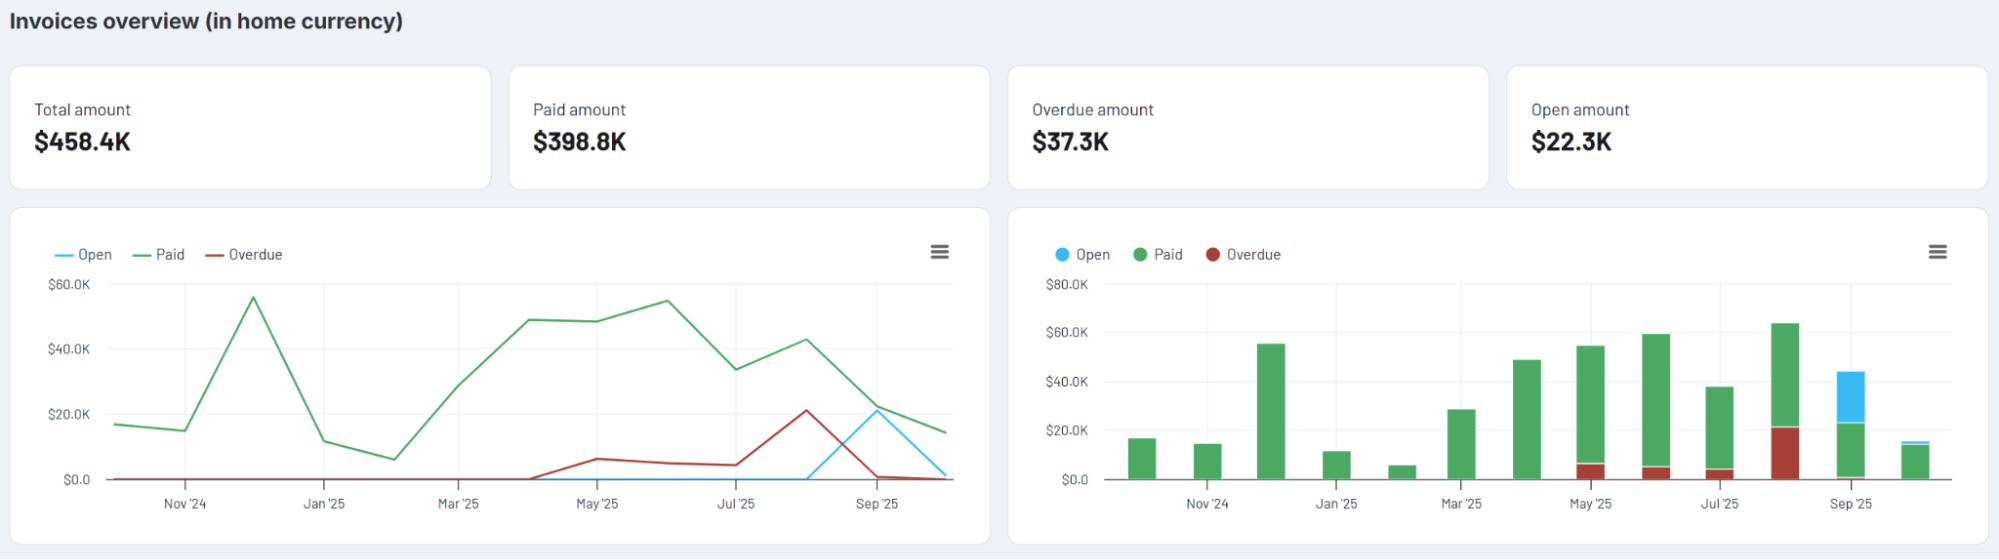
Monitor twelve-month income trends showing paid, open, and overdue invoices to identify when revenue peaks and valleys occur. Current overdue and open amounts reveal the gap between billed revenue and actual collected cash. This visibility helps you plan vendor payments for high-revenue months while controlling expenses during naturally slower periods based on real cash availability.
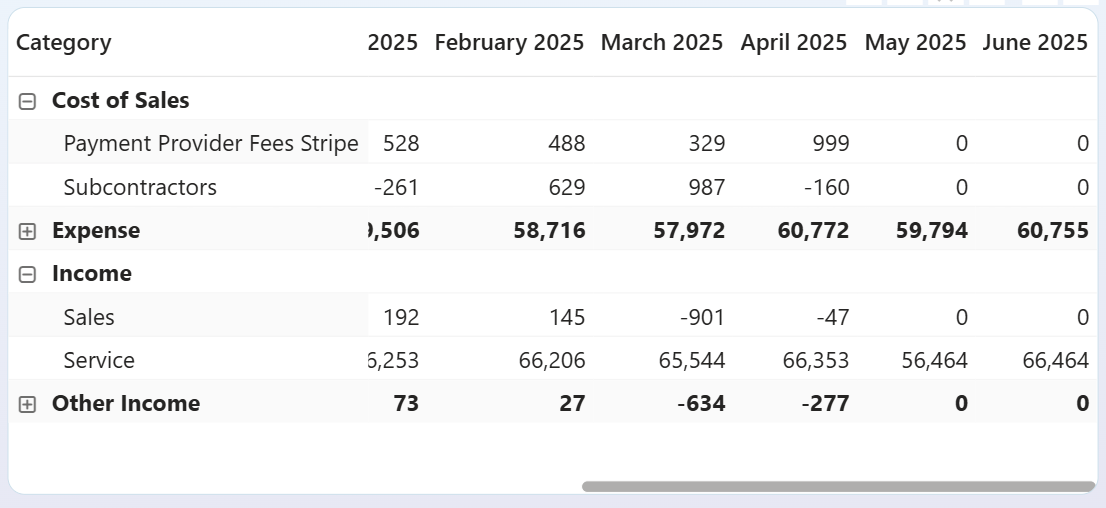
Compare income categories against expense line items across multiple months to determine whether costs are proportionate to revenue generation. The profit and loss breakdown reveals specific expense categories like payment fees and subcontractors alongside income streams from sales and services. This visibility shows whether operational costs consume too much revenue or if spending levels remain sustainable relative to actual income patterns.
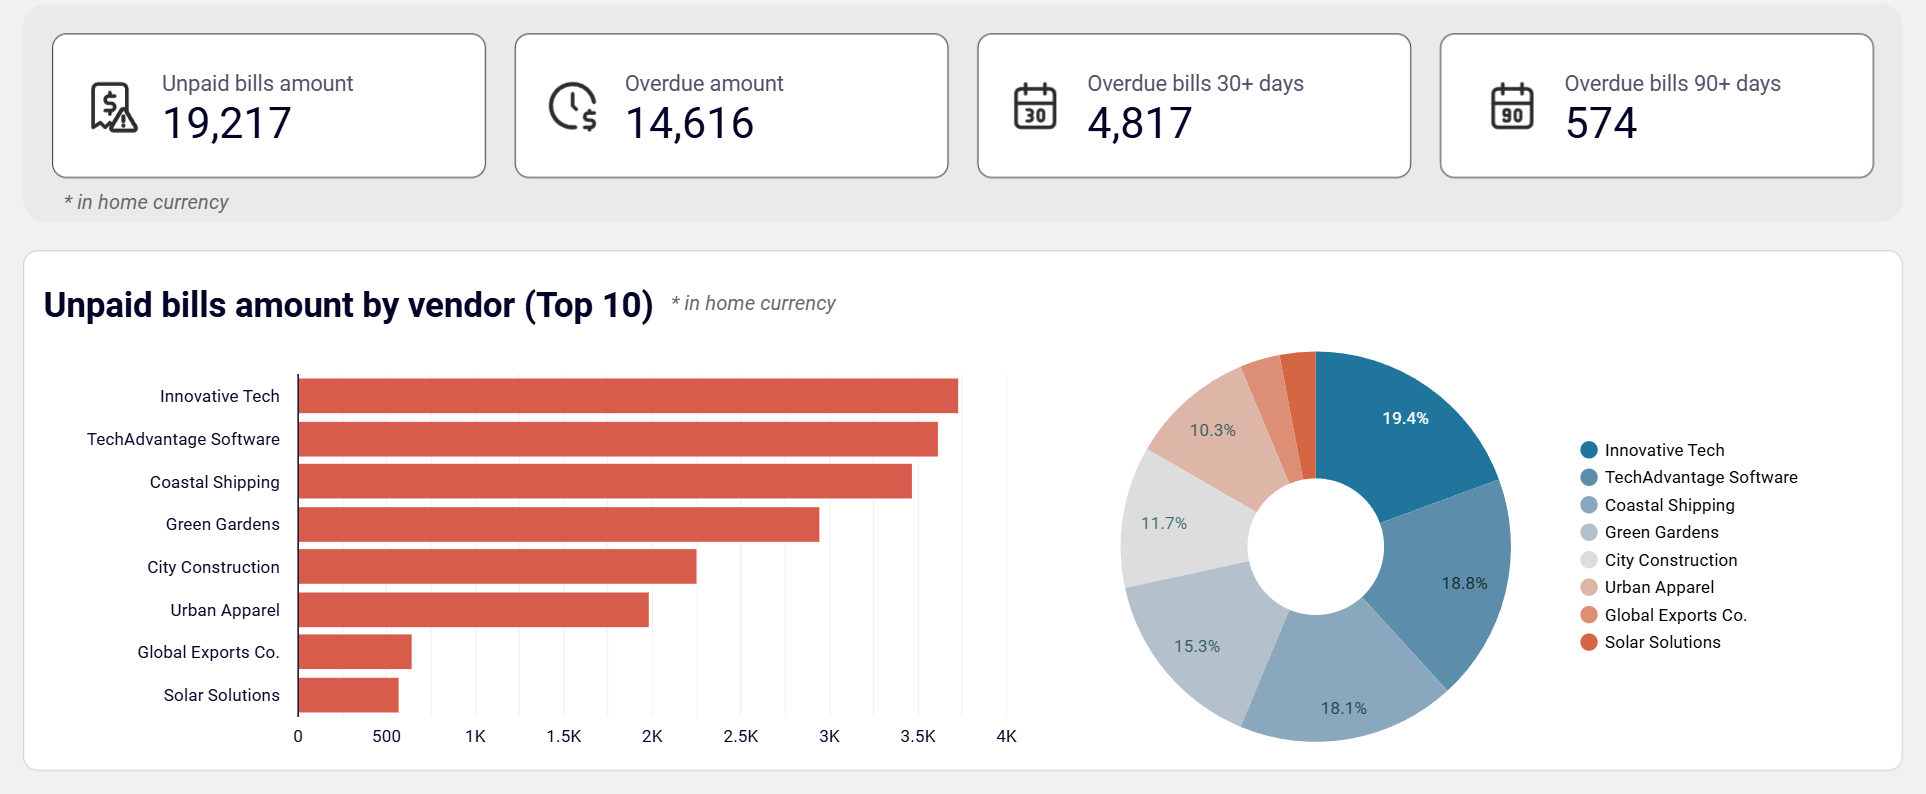
View total unpaid bills alongside overdue amounts broken down by aging periods (30+ days and 90+ days) to identify urgent payment obligations. The top 10 vendors by unpaid amount reveal your largest creditors through both bar chart rankings and percentage distribution. This visibility helps you decide which vendor payments maintain critical relationships versus those with more payment flexibility.
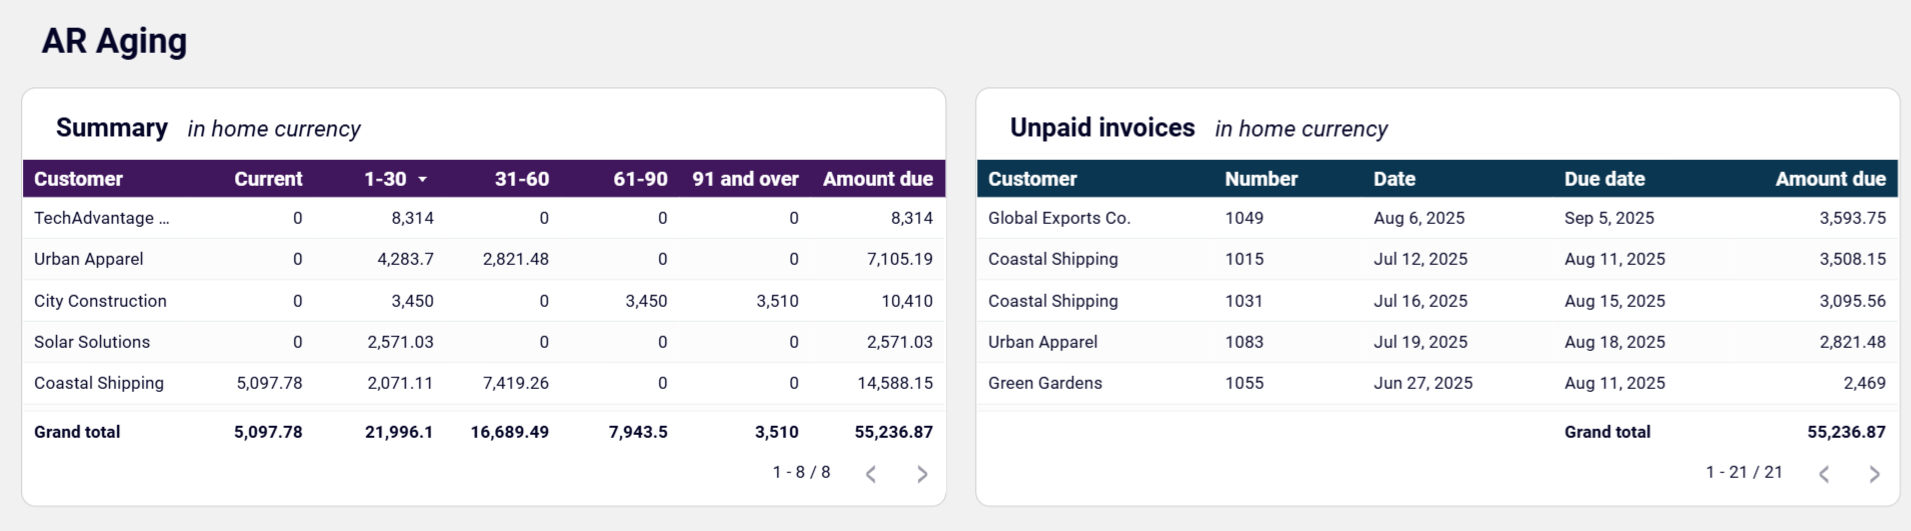
Track customer invoices distributed across aging periods (current, 1-30 days, 31-60 days, 61-90 days, and 91+ days) to identify which accounts require immediate collection attention. The summary table shows total amounts due by customer and aging category, while the unpaid invoices detail reveals specific overdue invoices with due dates. This aging visibility helps prioritize collection efforts that will most improve cash availability for meeting your own vendor payment obligations.
How to create an expenses dashboard?

Metrics you can track with an expenses dashboard template
Monitor your complete income across all revenue streams for the selected time period, showing whether earnings support your current expense levels and vendor payment obligations. This metric reveals if revenue is sufficient to cover what you owe while maintaining healthy cash reserves, or if income shortfalls require spending adjustments.
Track the actual money remaining after subtracting all operational costs from total revenue, showing your true profit rather than just top-line income numbers. This calculation reveals whether your business generates positive cash flow or if expenses consume most or all of your earnings, requiring cost reduction or revenue growth.
View the complete amount you currently owe to all vendors, providing visibility into your total payment obligations regardless of due dates. This figure shows your aggregate debt to suppliers and helps you understand the full scope of vendor commitments that require cash reserves to satisfy.
Monitor bills past their due dates broken down by aging periods (30, 60, 90+ days), identifying payment obligations that risk late fees or damaged vendor relationships. This metric highlights which vendor payments require immediate attention to maintain good standing with critical suppliers.
Track the complete amount customers currently owe you across all outstanding invoices, revealing how much revenue you've earned but not yet collected as usable cash. This figure shows the gap between recorded sales and actual cash available for paying expenses, highlighting potential collection needs.
Monitor customer payments past due organized by aging periods, showing which accounts require collection attention to convert outstanding invoices into cash for meeting your own expense obligations. This metric helps prioritize collection efforts on amounts that will most improve your ability to pay vendor bills.
Identify which products or services generate the most income to understand what drives your business earnings and inform inventory management decisions. This breakdown reveals your most profitable offerings, helping you focus resources on high-performing products while evaluating whether low-revenue items justify their operational costs and vendor relationships.
Review historical payment amounts to each vendor to evaluate supplier relationships and spending patterns over time. This summary shows which vendors receive the most payments, helping you assess whether spending distribution aligns with business priorities and identify opportunities to negotiate better terms with high-volume suppliers based on your payment history.