Campaign performance dashboard examples and reporting templates
Transform your advertising analysis with automated campaign performance dashboards that break down data silos between platforms. Stop jumping between Google Ads, Meta Ads, LinkedIn, and TikTok reports – instead, get unified visibility into spend, creative performance, conversion metrics, and ROI across all channels. These customizable dashboards deliver the actionable insights you need to optimize campaigns, reallocate budgets, and maximize your advertising returns.
Examples of campaign performance dashboards for every need


about your case. It doesn't cost you a penny 😉
Choose your white label campaign performance dashboard to kick off
What is a campaign performance dashboard?
Today's campaign performance dashboard templates eliminate the limits of single-platform reporting by delivering unified analysis across channels, creative assets, budget allocation, and campaign results. Coupler.io's automated data refresh capabilities ensure your dashboards always display current metrics without the tedious work of manual exports and data manipulation. For agencies and marketing teams, white label campaign performance dashboards offer the perfect solution—providing clients with comprehensive advertising intelligence while seamlessly integrating with your brand aesthetics and reporting standards.

What reports should be included on a campaign performance dashboard?
A comprehensive campaign performance dashboard should include several key reports that provide complete visibility into your advertising efforts across platforms. Based on our analysis of multi-channel advertising dashboards, we recommend incorporating these four essential report types.
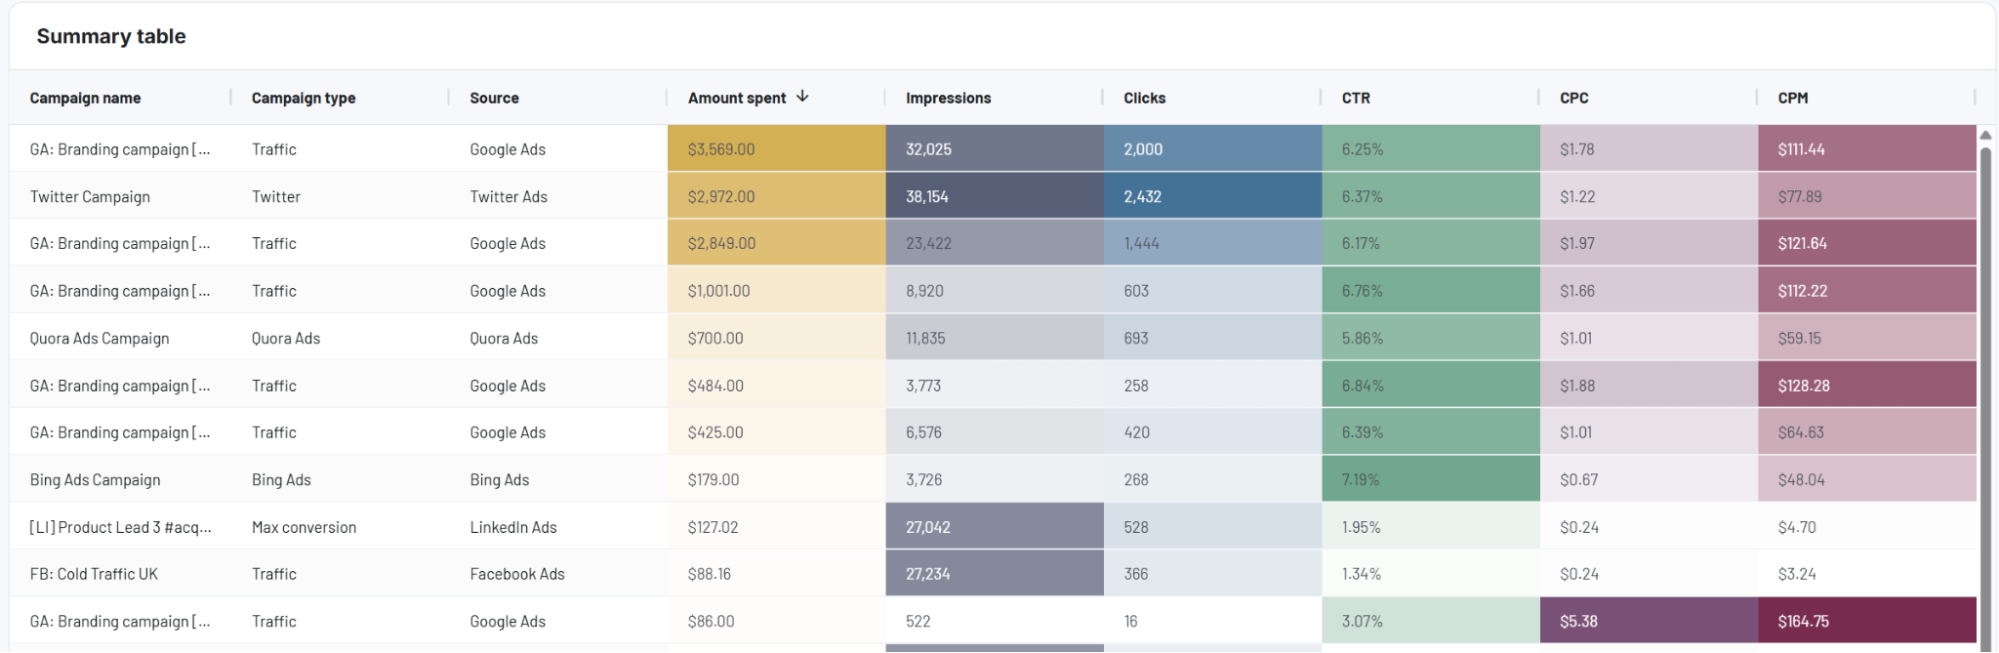
The cross-platform comparison report provides a side-by-side analysis of your advertising performance across different channels like Google Ads, Meta Ads, LinkedIn, and TikTok. It displays unified metrics such as impressions, clicks, CTR, CPC, and spend to identify which platforms deliver the best results for your goals. This report helps you understand relative performance, spot channel-specific strengths and weaknesses, and make informed decisions about budget allocation across your digital marketing mix.
The creative performance report delivers detailed insights into which ad creatives drive the strongest engagement and conversions. It tracks metrics like impressions, clicks, CTR, CPC, and conversions for individual ad creatives across platforms. The report includes visualizations of top-performing creatives by CTR and clicks, helping you identify which messages, formats, and designs resonate most with your audience. These insights are crucial for optimizing creative strategies and improving future campaign effectiveness.
The budget allocation report provides comprehensive tracking of advertising spend across platforms and campaigns. It displays monthly spending patterns, budget utilization rates, and spend forecasts to ensure optimal resource allocation. The report includes detailed monthly spend analysis across platforms and campaign-level budget breakdowns, enabling you to identify underperforming investments and reallocate resources to high-performing channels. This visibility is essential for maximizing ROI and maintaining financial accountability.
The campaign effectiveness report offers a granular view of performance at the campaign level across platforms. It delivers campaign-by-campaign breakdowns of key metrics like impressions, clicks, CTR, conversions, and ROAS. With this report, you can quickly identify your best and worst-performing campaigns, understand the factors contributing to success, and apply those insights to optimize underperforming campaigns. This detailed analysis forms the foundation for data-driven campaign refinements and future strategy development.
What insights you can get with the custom campaign performance dashboard
The PPC multi-channel dashboard eliminates the need to switch between separate platform interfaces by displaying unified metrics across all your advertising channels in one view. This consolidated analysis instantly reveals which platforms deliver the strongest ROI for specific campaign objectives, showing you where Google Ads might outperform Facebook for clicks, or where LinkedIn generates higher-quality leads despite higher costs. With platform-to-platform comparison visualizations, you can quickly identify performance gaps and optimization opportunities across your entire digital advertising portfolio.
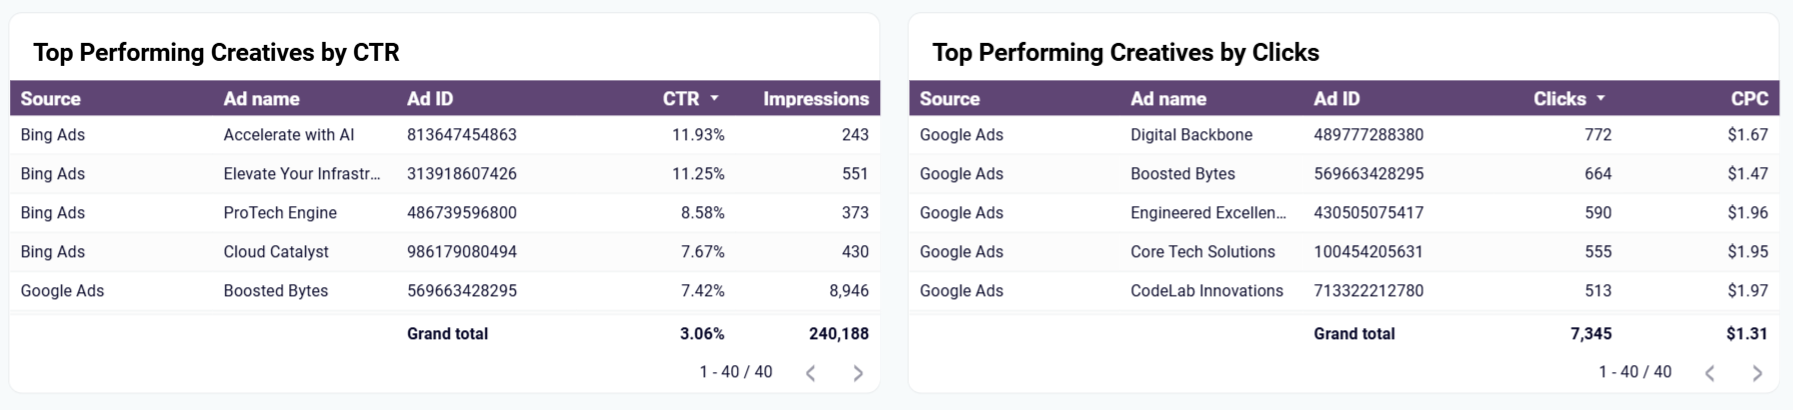
The creative performance section presents a detailed breakdown of your best-performing ad formats and messaging across platforms based on CTR and click metrics. This analysis helps you quickly identify which visual elements, copy approaches, and calls-to-action drive the strongest audience engagement. The insights enable you to replicate successful creative elements across campaigns and eliminate underperforming approaches.
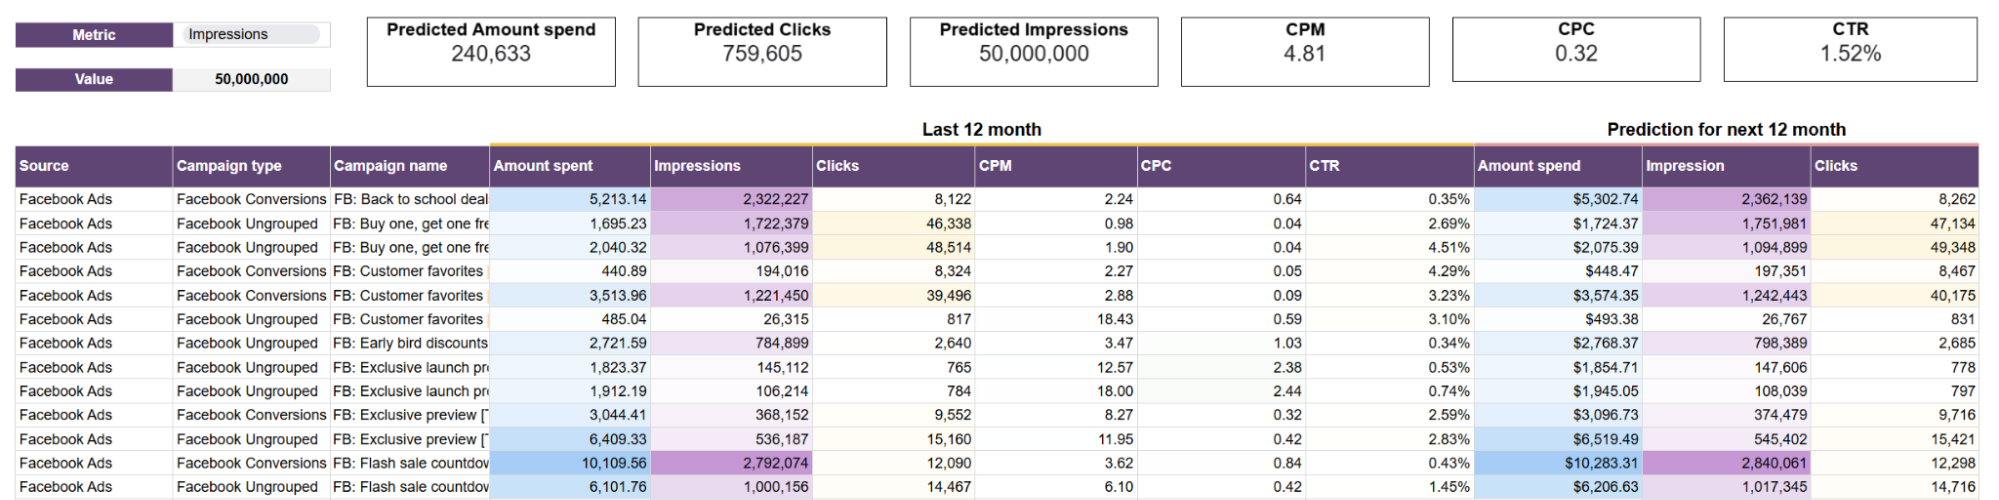
The advertising budget forecast dashboard transforms historical performance data into actionable future projections. It analyzes your spending patterns and results across platforms to predict campaign outcomes, helping you anticipate performance before allocating resources. You'll see projected impressions, clicks, and amount spend based on current trends, alongside recommendations for budget adjustments to meet specific targets. This predictive approach shifts campaign management from reactive to proactive, allowing you to course-correct strategies before poor performance impacts your bottom line.
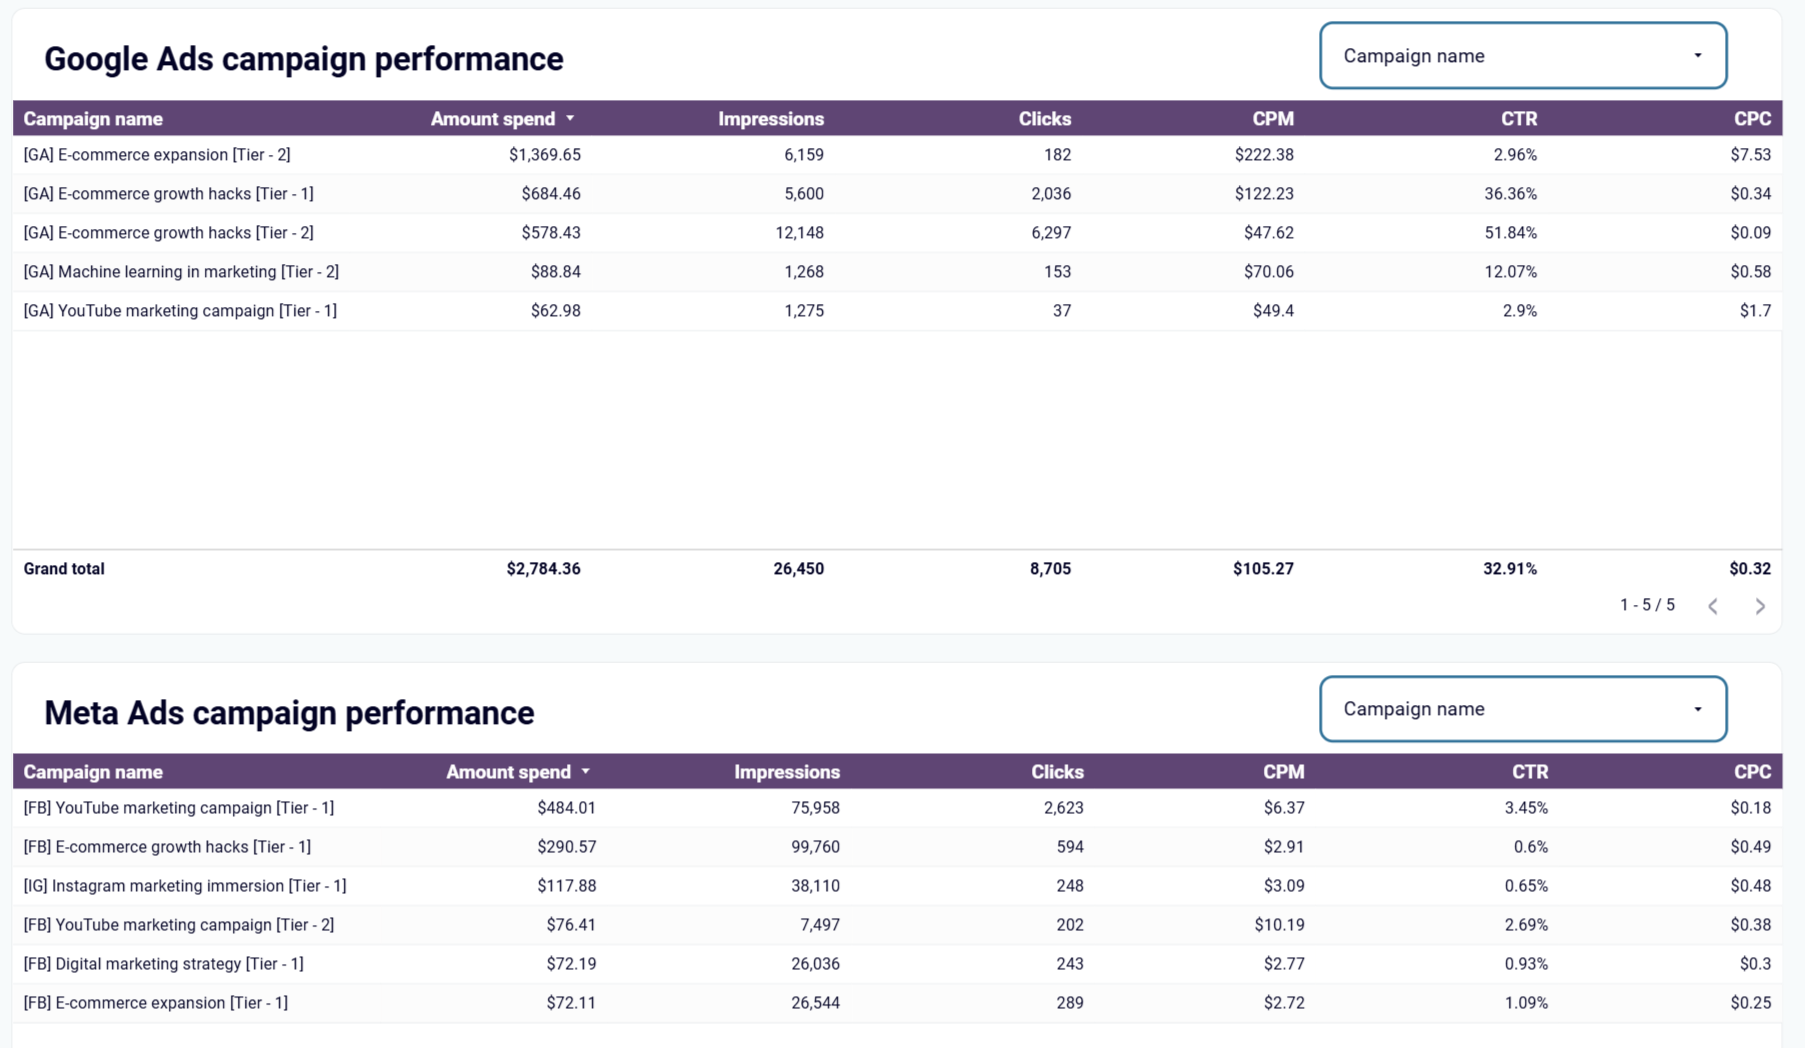
The Google and Facebook Ads campaign performance dashboard provides a side-by-side analysis of all your campaigns across these advertising platforms. You can evaluate key metrics like impressions, clicks, CTR, CPC, conversions, and ROAS for each campaign to identify specific strengths and weaknesses. This detailed breakdown helps you understand which targeting approaches, messaging strategies, and optimization techniques drive the strongest results across different advertising channels.
How to create a campaign performance dashboard?

Metrics you can track with a campaign performance dashboard template
Monitor the average amount you pay for each click across platforms and campaigns. The campaign performance dashboard visualizes CPC trends over time, allowing you to identify cost efficiencies or inflation across channels. This metric is crucial for understanding the relative cost of driving traffic from different advertising platforms and optimizing bidding strategies to maintain profitable acquisition costs.
Track the percentage of impressions that result in clicks for each ad, campaign, and platform. The dashboard visualizes CTR trends alongside other engagement metrics, helping you evaluate the effectiveness of your ad creative, messaging, and targeting. By comparing CTR across platforms and campaigns, you can quickly identify which combinations of creative and audience targeting produce the most engaging results.
Monitor the total number of times your ads were displayed across all platforms and campaigns. The dashboard presents impression data through time-series visualizations and platform comparisons, showing which channels deliver the greatest reach. This visibility helps you ensure sufficient exposure for your brand messages and identify opportunities to expand reach where impression volumes are low relative to performance.
Track the percentage of clicks that result in desired actions like purchases, sign-ups, or lead form completions. The dashboard breaks down conversion rates by platform, campaign, and creative, helping you identify which combinations drive the strongest bottom-line results. This insight is essential for optimizing campaigns toward business outcomes rather than just traffic generation.
Measure the revenue generated for every dollar spent on advertising across platforms and campaigns. The dashboard calculates and visualizes ROAS by channel, campaign, and time period, helping you quickly identify your most profitable advertising investments. This metric is crucial for justifying ad budgets and making resource allocation decisions that maximize financial returns.
Monitor how much you pay to acquire each customer or lead across different platforms and campaigns. The dashboard calculates CPA automatically and visualizes trends over time, allowing you to identify efficiency improvements or deterioration. This metric helps ensure your acquisition costs remain sustainable and aligned with customer lifetime value expectations.
Track the percentage of allocated budget spent across platforms, campaigns, and time periods. The dashboard highlights under and overspending situations with visual alerts, ensuring you maintain optimal budget pacing. This metric helps prevent end-of-month budget crunches or underspending situations that could limit campaign potential.
Monitor how often the same user sees your ads across platforms to prevent ad fatigue or wasteful impression delivery. The dashboard's frequency meter shows when exposure levels reach optimal or concerning thresholds. This insight helps you maintain the right balance between sufficient ad exposure for message recall and excessive frequency that can lead to negative brand perception.