Apple Search Ads dashboard examples and reporting templates
Get complete visibility into your app promotion campaigns with an automated Apple Search Ads reporting dashboard. Track campaign performance, analyze conversions by device type, compare keywords, and optimize ad spend based on real-time insights from the Apple Search Ads platform.
Examples of Apple Search Ads dashboards for every need


about your case. It doesn't cost you a penny 😉
Choose your white label Apple Search Ads dashboard to kick off
What is an Apple Search Ads dashboard?
Unlike Apple's standard reporting tools, advanced Apple Search Ads dashboards deliver enhanced visibility through interactive visualizations, scheduled data updates, and historical trend analysis. Coupler.io's automation eliminates tedious manual exports by refreshing your data automatically at set intervals. This provides a reliable, centralized performance hub that empowers you to fine-tune targeting approaches, make smarter spending decisions, and craft more effective ad creatives – ultimately driving more quality installs and higher conversion rates.

What reports should be included on a meaningful Apple Search Ads dashboard?
A comprehensive Apple Search Ads dashboard should include several crucial reports that provide complete visibility into your campaign performance. Based on our analysis of Apple Search Ads data, we recommend incorporating these four essential report types:
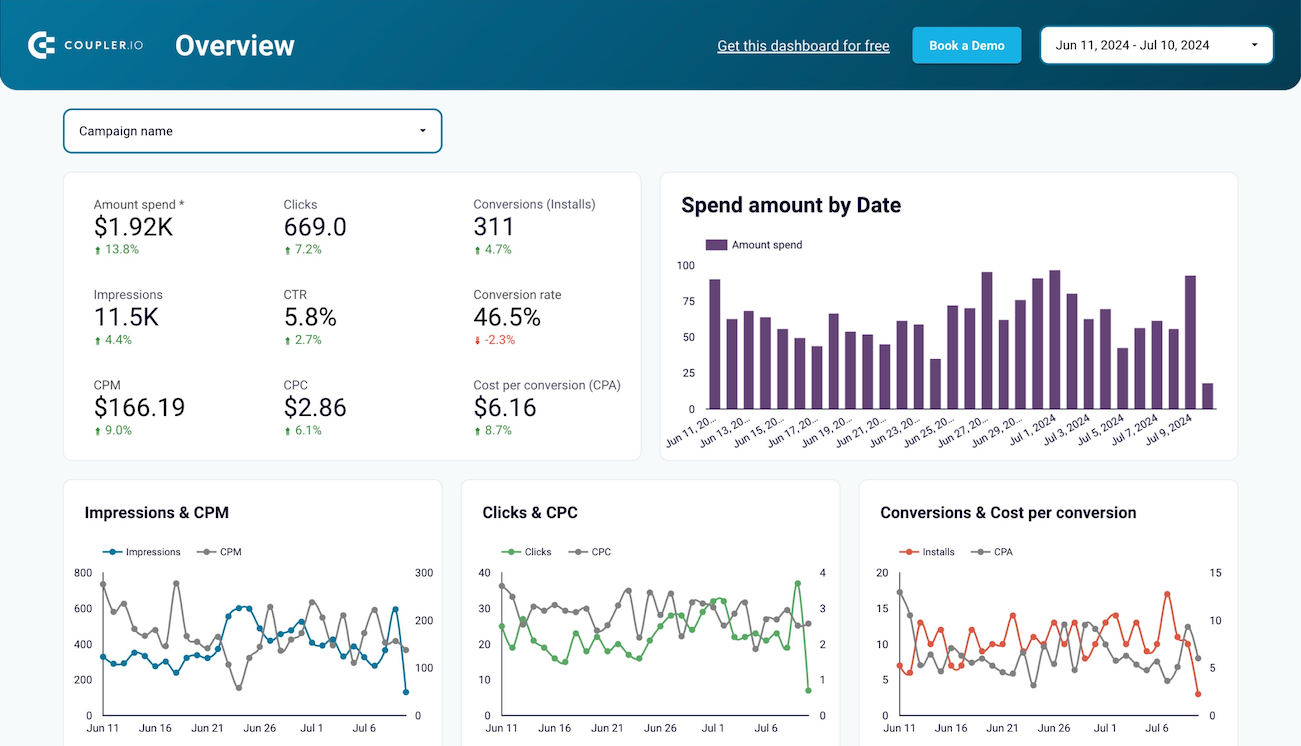
The campaign performance overview provides a snapshot of key metrics across all your Apple Search Ads campaigns. It includes scorecards showing total impressions, clicks, conversions, and spend for your selected time period, with comparison indicators highlighting changes from previous periods. This report offers immediate insights into overall campaign health and ROI, allowing you to quickly identify positive or negative trends that require attention or replication across your app promotion strategy.
The conversion analysis report breaks down your campaign results by meaningful segments to help you understand what drives successful app installs. It includes visualizations of top campaigns by conversions, making it easy to identify your highest-performing ads. The report also features a pie chart showing conversion distribution by device type, revealing whether iPhone or iPad users are more likely to install your app after seeing your ads. These insights are crucial for optimizing targeting and budget allocation decisions.
The monthly performance trends report provides a long-term view of your campaign metrics, helping you identify seasonal patterns and evaluate the impact of strategy changes over time. This report visualizes key performance indicators like impressions, clicks, conversions, and spend on a month-by-month basis, making it easy to spot trends that might be obscured in daily or weekly data. Understanding these patterns enables better planning for future campaigns and budget forecasting based on historical performance.
The search terms and keywords analysis report reveals which specific terms are driving traffic and conversions for your app. It shows the performance of both your targeted keywords and the actual search terms users entered before clicking your ads. This report helps you understand the language your potential users are using to find apps like yours, enabling you to refine your keyword strategy for better targeting. By identifying high-converting terms, you can optimize your campaigns to focus on the most effective keywords.
What insights you can get with the Apple Search Ads reporting dashboard
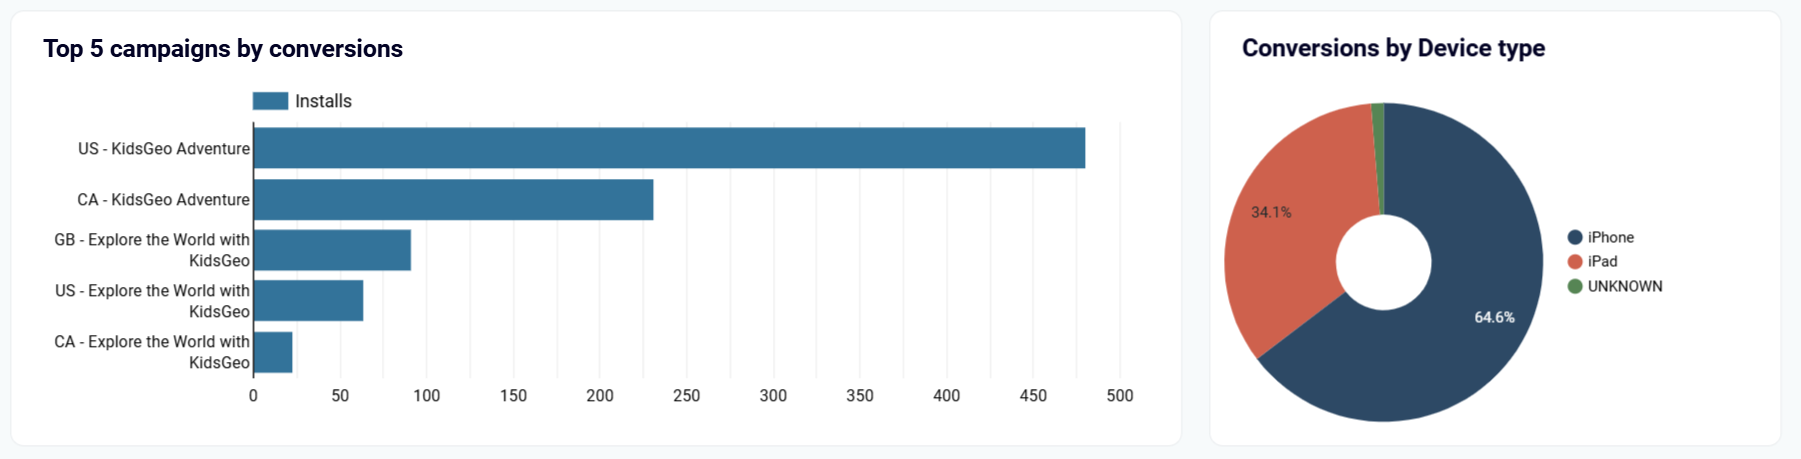
The conversion analysis report reveals which campaigns are generating the most app installs and how these conversions vary by device type. You can quickly spot which ad groups are driving the highest number of quality users and on which devices (iPhone or iPad) they're performing best. This allows you to allocate your budget more effectively, focusing on the combinations that deliver the strongest results for your app.
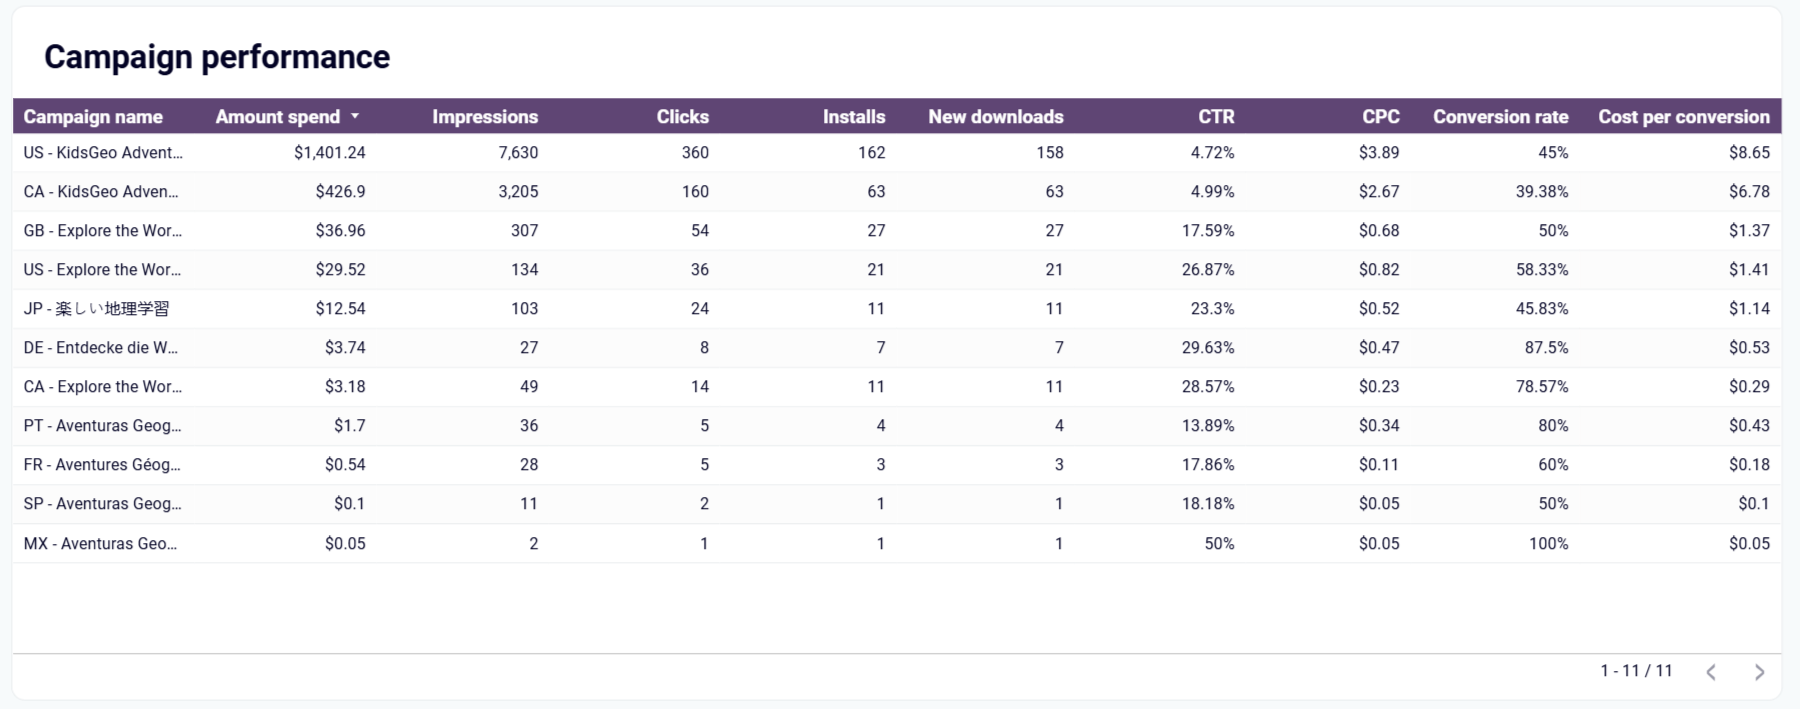
With the campaign comparison table, you can evaluate all your campaigns side by side across critical metrics, including impressions, clicks, conversions, CPC, installs, and new downloads. This comprehensive view helps you identify both strengths and weaknesses in your campaign structure, making it simple to spot underperforming campaigns that need optimization or successful strategies that should be scaled further.
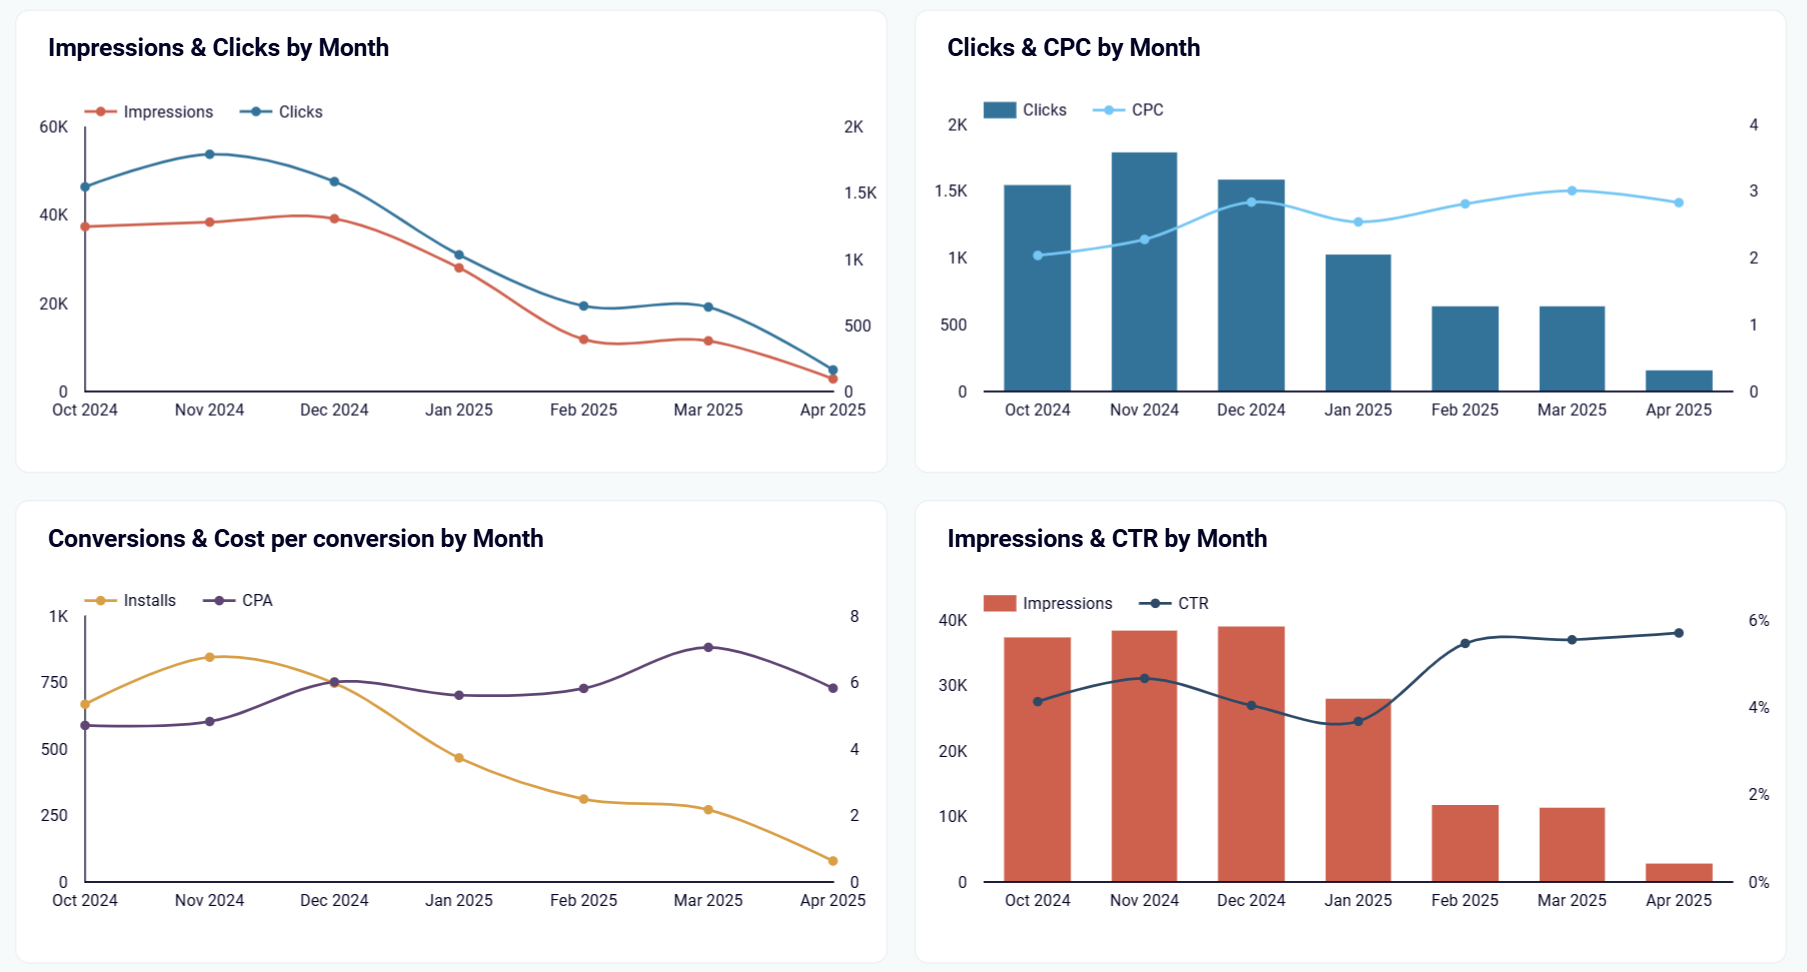
The monthly dynamics page visualizes your campaign performance over extended periods, revealing seasonal patterns and long-term trends in your Apple Search Ads results. This view helps you understand how your metrics fluctuate throughout the year, identify your strongest and weakest months, and correlate performance changes with external factors or campaign adjustments. These insights are invaluable for strategic planning and forecasting.
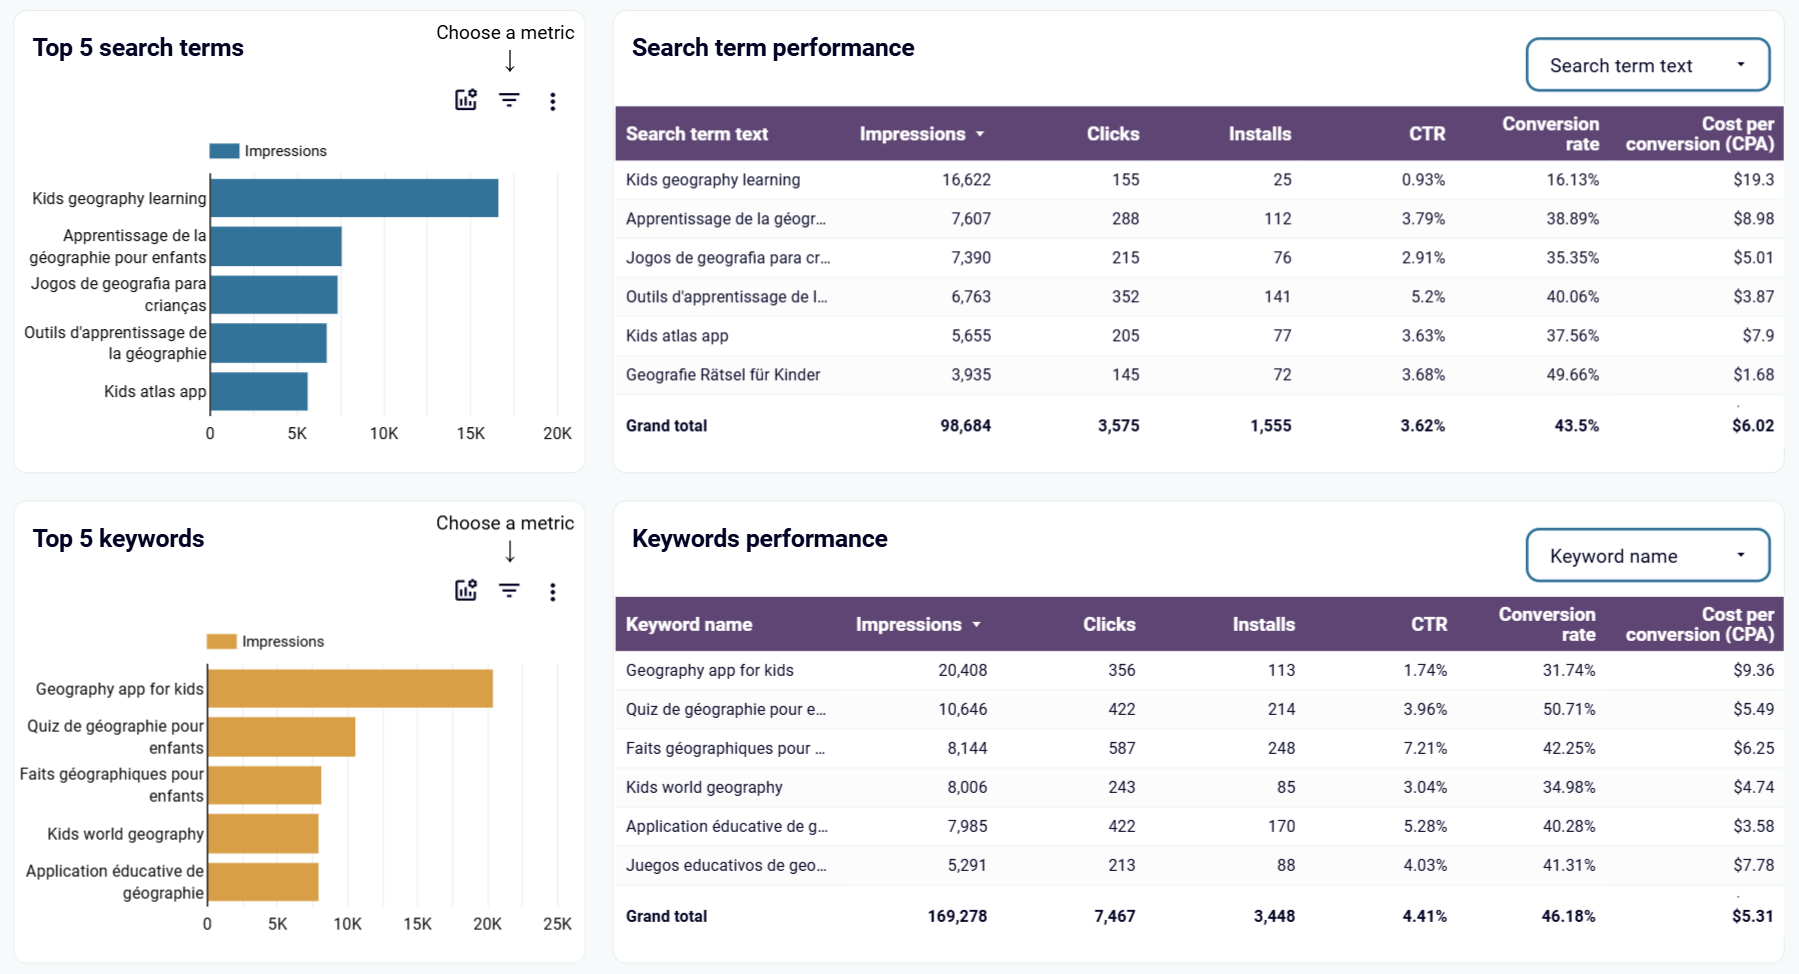
The search terms and keywords page provides deep insights into which specific terms are driving your campaign success. By analyzing the performance of different keywords and actual user search terms, you can refine your targeting to focus on the most effective phrases. This data reveals precisely what language potential users are using when they discover and install your app, helping you optimize both your ads and your App Store listing.
How to create an Apple Search Ads dashboard?

Metrics you can track with an Apple Search Ads dashboard template
Monitor how often your ads appear in App Store search results over time. The dashboard visualizes impression trends on daily, weekly, and monthly bases, helping you understand your share of voice in the App Store. Tracking these patterns reveals how changes to your keywords, bids, or campaign structure impact your visibility, allowing you to optimize for maximum exposure.
Track the number of times users tap on your ads after seeing them in search results. The dashboard displays click volume over time and by campaign, revealing which ads are most compelling to potential users. This metric helps you evaluate the effectiveness of your app's creative elements, including icon, screenshots, and promotional text in generating initial interest.
Monitor the percentage of impressions that result in clicks to assess how effectively your ads capture user attention. The dashboard highlights CTR patterns across campaigns and time periods, helping you identify which combinations of creative elements and keywords generate the strongest user interest. This insight is crucial for optimizing ad relevance and appeal.
Track the number of users who install your app after clicking your ads, broken down by campaign and device type. The dashboard visualizes conversion volumes and rates, making it easy to identify your most effective campaigns for generating actual app installs. This metric directly connects your ad spend to tangible results, helping prioritize campaigns for scaling or optimization.
Monitor how much you're paying for each user who taps on your ads. The dashboard tracks CPC trends over time and across campaigns, helping you identify opportunities to optimize bidding strategies. By comparing CPC against conversion metrics, you can ensure you're not overpaying for traffic that doesn't convert to valuable app users.
Track the average cost of acquiring one app install through your Apple Search Ads campaigns. The dashboard calculates this crucial efficiency metric across all campaigns, helping you evaluate the economic viability of your user acquisition strategy. Monitoring CPA trends allows you to identify the most cost-effective campaigns and keywords for scaling.
Analyze the percentage of users who install your app after clicking your ad. The dashboard visualizes conversion rates by campaign, keyword, and device type, revealing which elements of your strategy most effectively turn interested users into actual customers. This insight helps you focus optimization efforts on the parts of the funnel that need the most improvement.
Track first-time installs generated by your campaigns, separated from reinstalls by existing users. The dashboard shows new download trends over time and by campaign, helping you understand how effectively you're reaching new audience segments. This metric is essential for apps focused on expanding their user base rather than re-engaging existing users.
Analyze which specific search phrases users entered before seeing and clicking your ads. The dashboard reveals the actual language your potential users employ when looking for apps like yours, often surfacing valuable keyword opportunities you haven't yet targeted. This insight helps refine both your keyword strategy and potentially your app's metadata.
Monitor your advertising costs on a monthly basis to track budget utilization and efficiency trends. The dashboard visualizes monthly spend alongside performance metrics, helping you evaluate return on investment over time. This view is particularly valuable for spotting seasonal patterns, identifying your most and least efficient months, and planning future budget allocations.