Ads dashboard examples and reporting templates
Get a complete view of your advertising performance with automated ads dashboard templates that consolidate data from multiple platforms. Track campaign metrics, analyze creative performance, monitor budgets, and measure brand awareness with real-time insights from Facebook, Google, LinkedIn, and other advertising channels.
Examples of ads dashboards for every need


 +2
+2

 +3
+3

 +3
+3


 +2
+2


 +4
+4


 +6
+6


 +2
+2


 +1
+1


about your case. It doesn't cost you a penny 😉
Choose your white label ad dashboard to kick off
What is an ads dashboard?
Modern ad dashboards go beyond basic metrics like impressions and clicks, offering deeper insights into creative performance, budget allocation, and brand awareness impact. With automated data refreshing through Coupler.io, these dashboards eliminate manual data collection and consolidation, ensuring you always have current information for optimization decisions. This creates a single source of truth for assessing advertising effectiveness and directing future campaign strategy.

What reports should be included on a meaningful ads dashboard?
A comprehensive ads dashboard should integrate several key report types to provide complete visibility into your advertising performance. Based on our analysis of multi-platform advertising dashboards, we recommend incorporating these four essential report types:
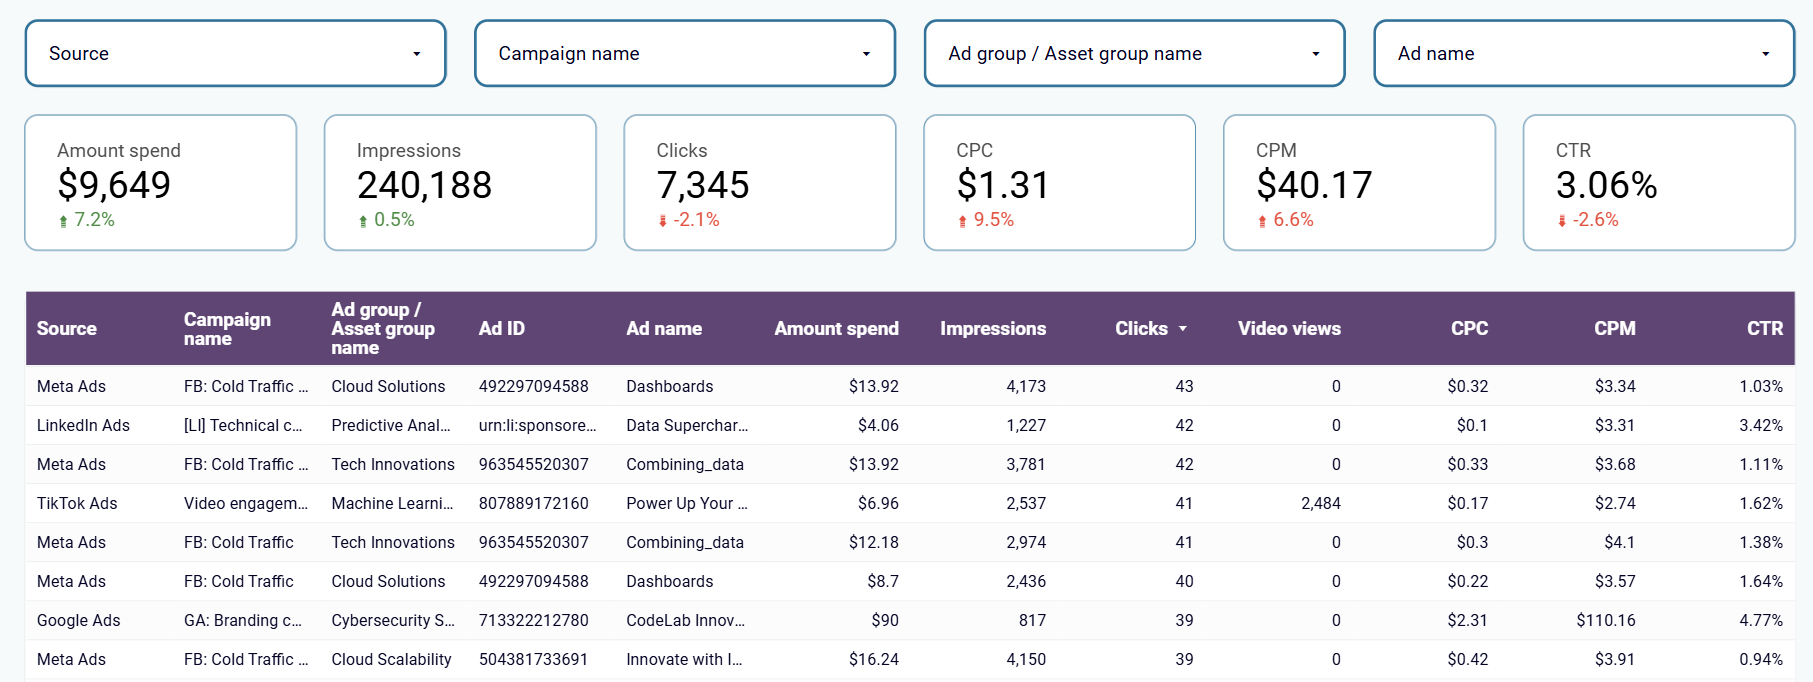
The multichannel report provides a unified view of performance metrics across all your advertising platforms, including Google Ads, Facebook Ads, LinkedIn Ads, and others. It combines critical metrics like impressions, clicks, CTR, CPC, and spend in standardized formats for easy comparison. This report helps you identify which platforms deliver the best results for specific goals, compare campaign effectiveness across channels, and allocate budget efficiently based on actual performance data rather than platform-specific metrics that might not align.
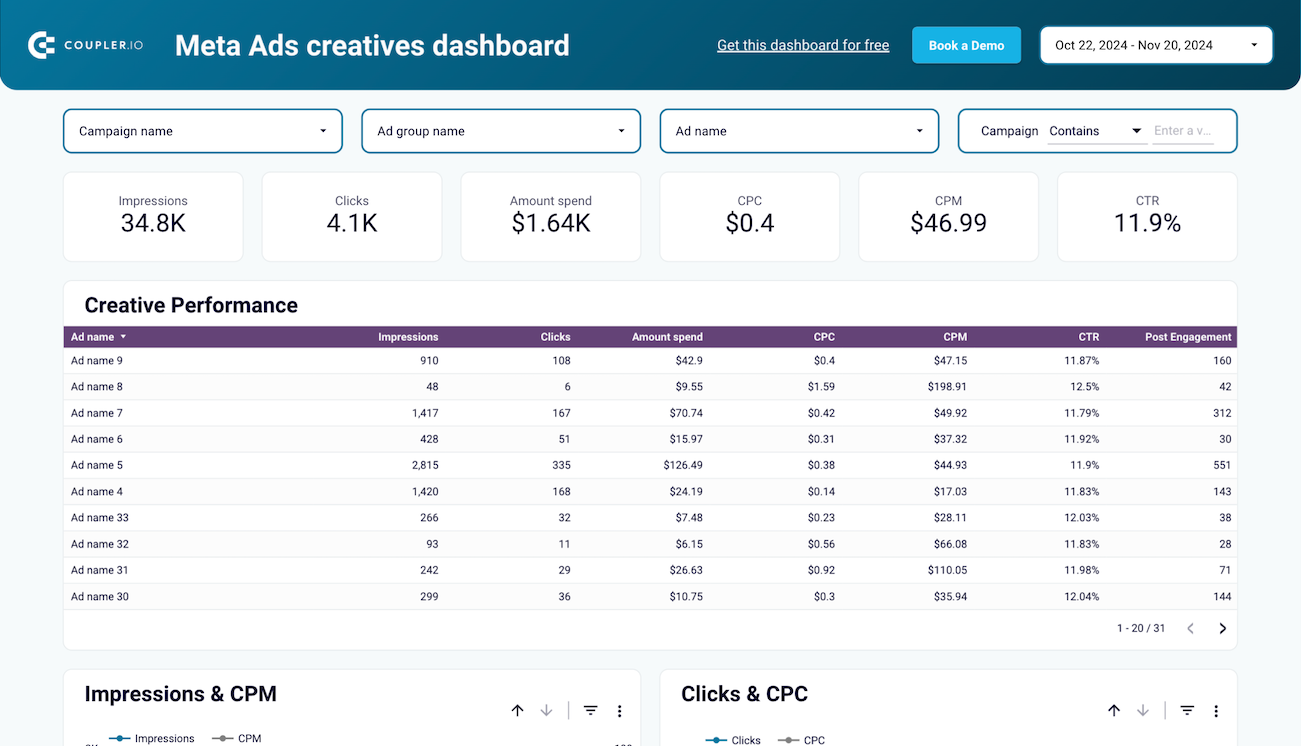
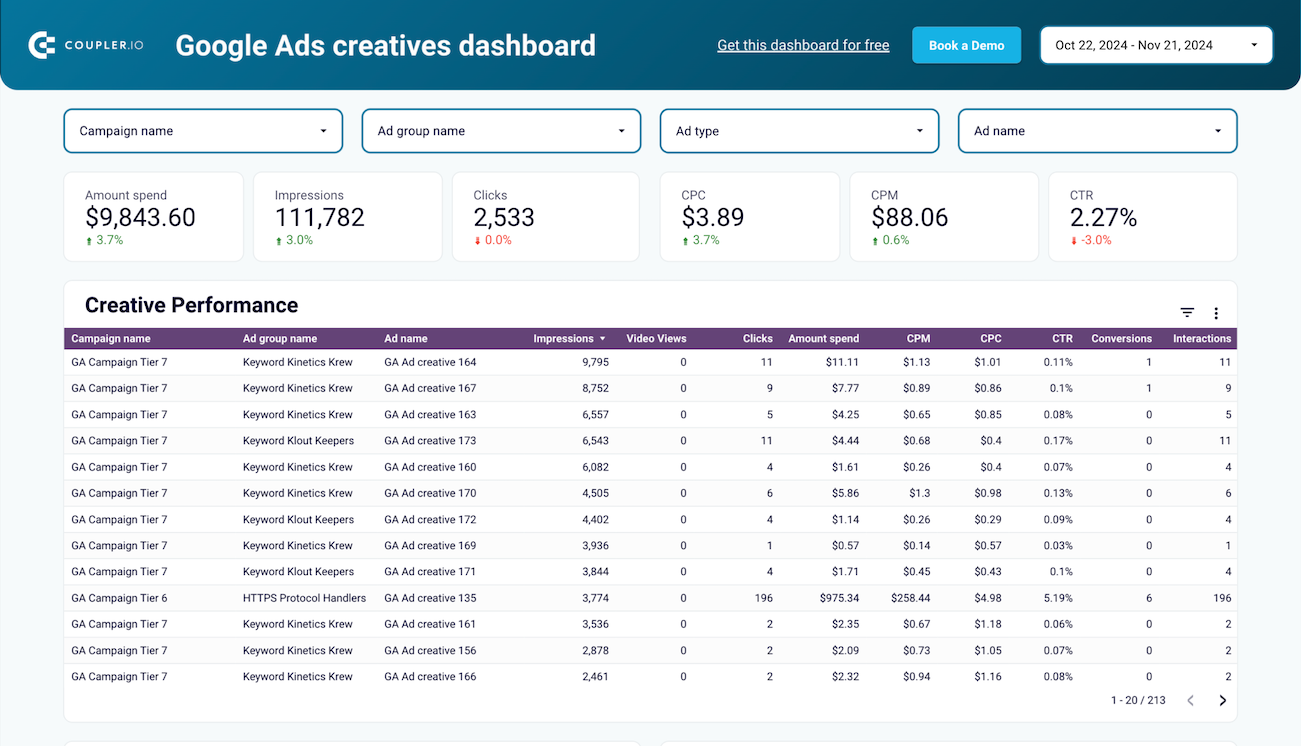
The creative performance report focuses on analyzing how different ad creatives perform across platforms and campaigns. It tracks engagement metrics like impressions, clicks, and CTR alongside efficiency metrics like CPM and CPC. By consolidating creative performance data in one place, you can identify winning ad formats, messages, and visuals regardless of the platform they appear on. This insight helps optimize creative strategy, identify elements that drive engagement, and eliminate underperforming assets quickly to improve overall campaign effectiveness.
The budget tracking and forecast report monitors current spending against planned budgets across all advertising platforms while projecting future performance. It provides alerts for potential overspending, tracks monthly budget utilization, and compares actual versus planned expenditures. This report helps prevent unexpected budget depletion, identify spending inefficiencies, and forecast future performance based on current trends. By connecting spending directly to performance metrics like impressions and clicks, it provides context for budget decisions and enables more strategic resource allocation.
The brand awareness report connects advertising efforts with actual brand recognition by tracking the relationship between ad impressions across platforms and branded search activity. It visualizes correlations between advertising campaigns and branded search queries over time, helping identify which campaigns and platforms most effectively build brand recognition. This insight is crucial for evaluating upper-funnel marketing efforts that might not directly drive conversions but contribute significantly to brand building. It provides evidence of how advertising investments translate into increased brand awareness and interest.
What insights you can get with ads dashboards

The brand awareness dashboard reveals direct correlations between advertising impressions across multiple platforms (Facebook, Google, Microsoft) and subsequent branded keyword searches. By comparing these trend lines over time, you can identify which campaigns and platforms most effectively build brand recognition. This insight helps optimize budget allocation toward activities that genuinely increase brand visibility rather than just driving immediate clicks, creating a more balanced approach to both short-term and long-term marketing objectives.
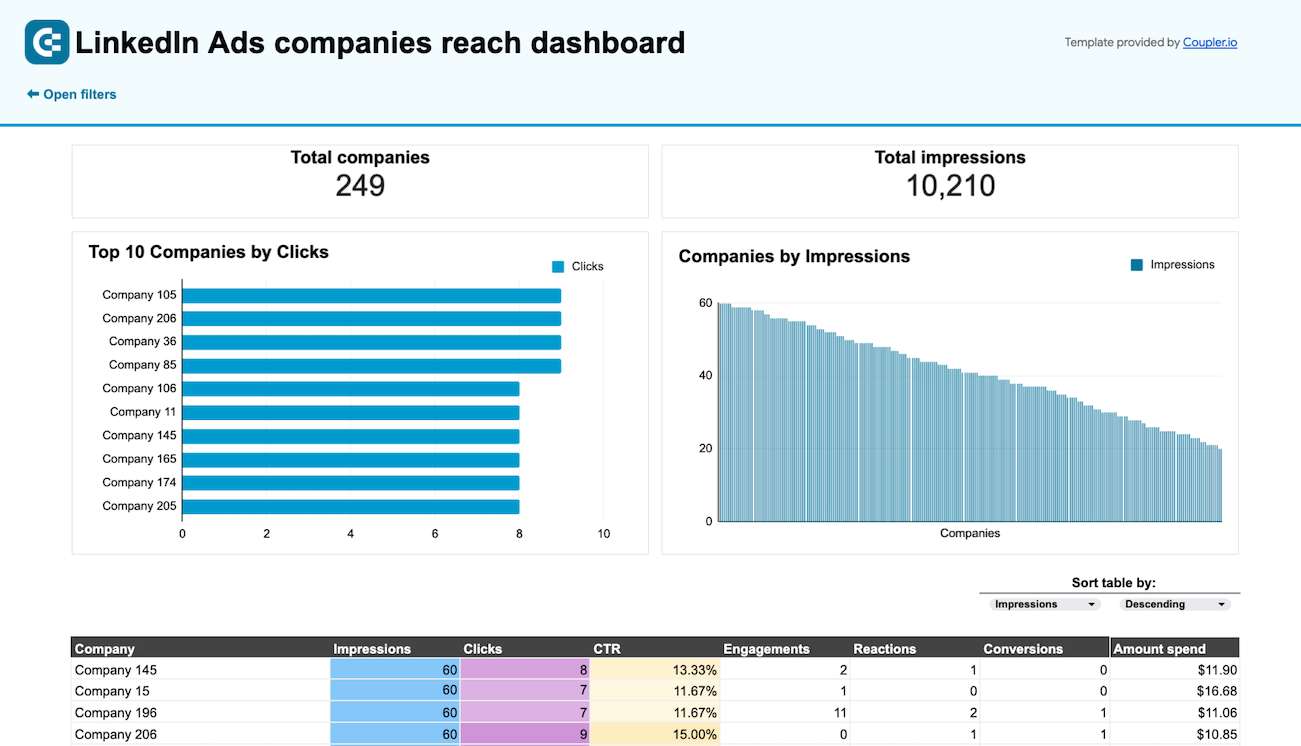
The multi-channel creatives dashboard highlights your most engaging ad creatives based on critical metrics like CTR and total clicks across all platforms. You can quickly spot which images, messages, and formats resonate most with your audience regardless of where they appear. This cross-platform creative analysis helps you replicate successful elements across campaigns and platforms, eliminate underperforming assets, and continually refine your creative strategy based on actual audience engagement rather than platform-specific metrics.
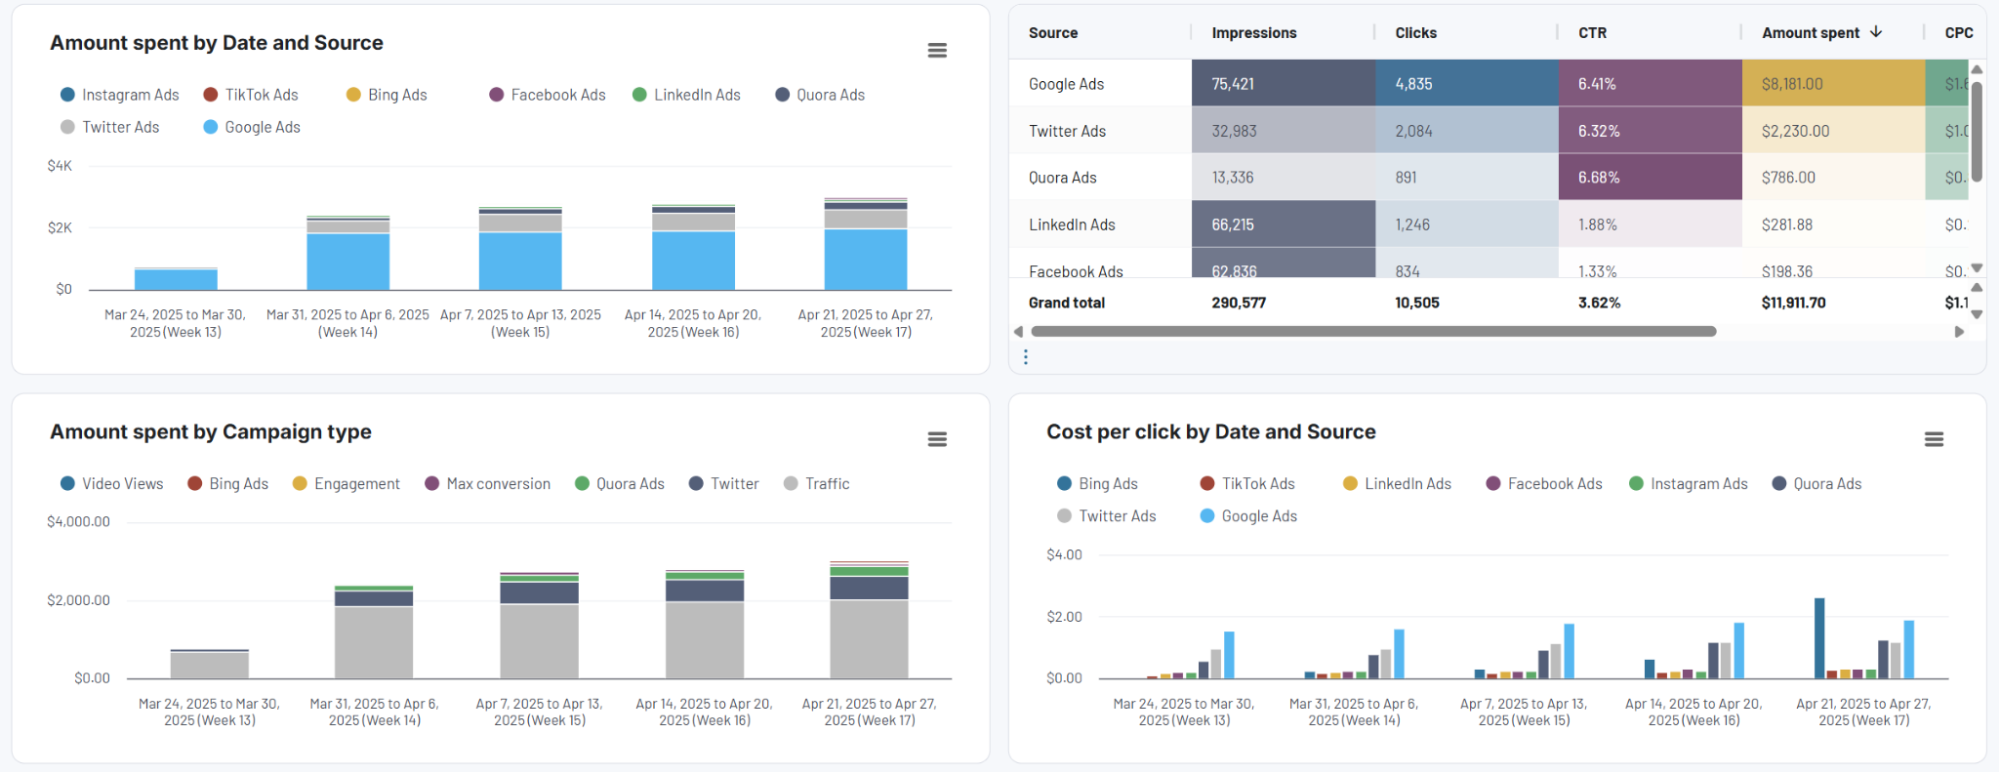
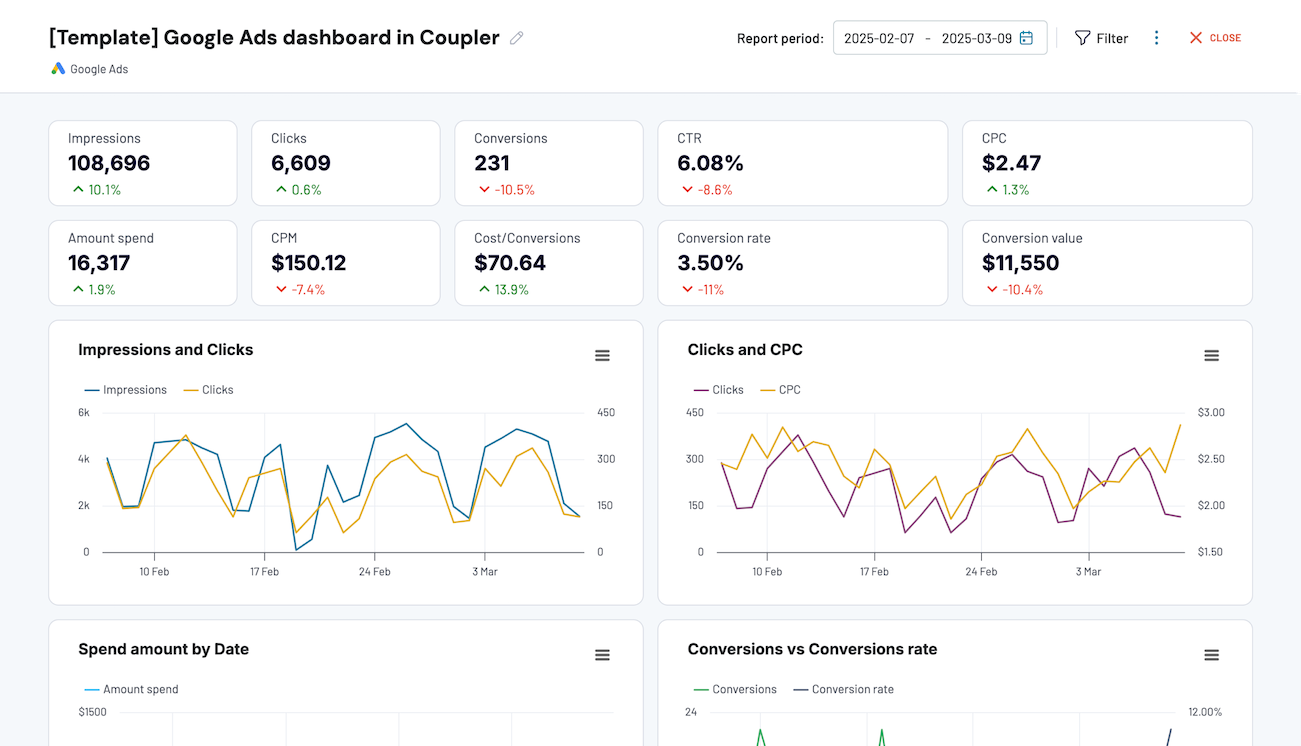
The PPC multichannel dashboard provides side-by-side analysis of performance across different advertising platforms with standardized metrics for fair comparison. You can easily identify which channels deliver the best results for specific campaign objectives and audience segments. This comprehensive view highlights performance disparities between platforms that might otherwise go unnoticed when reviewing platform-specific reports separately, enabling you to shift resources to the most effective channels for your specific goals.
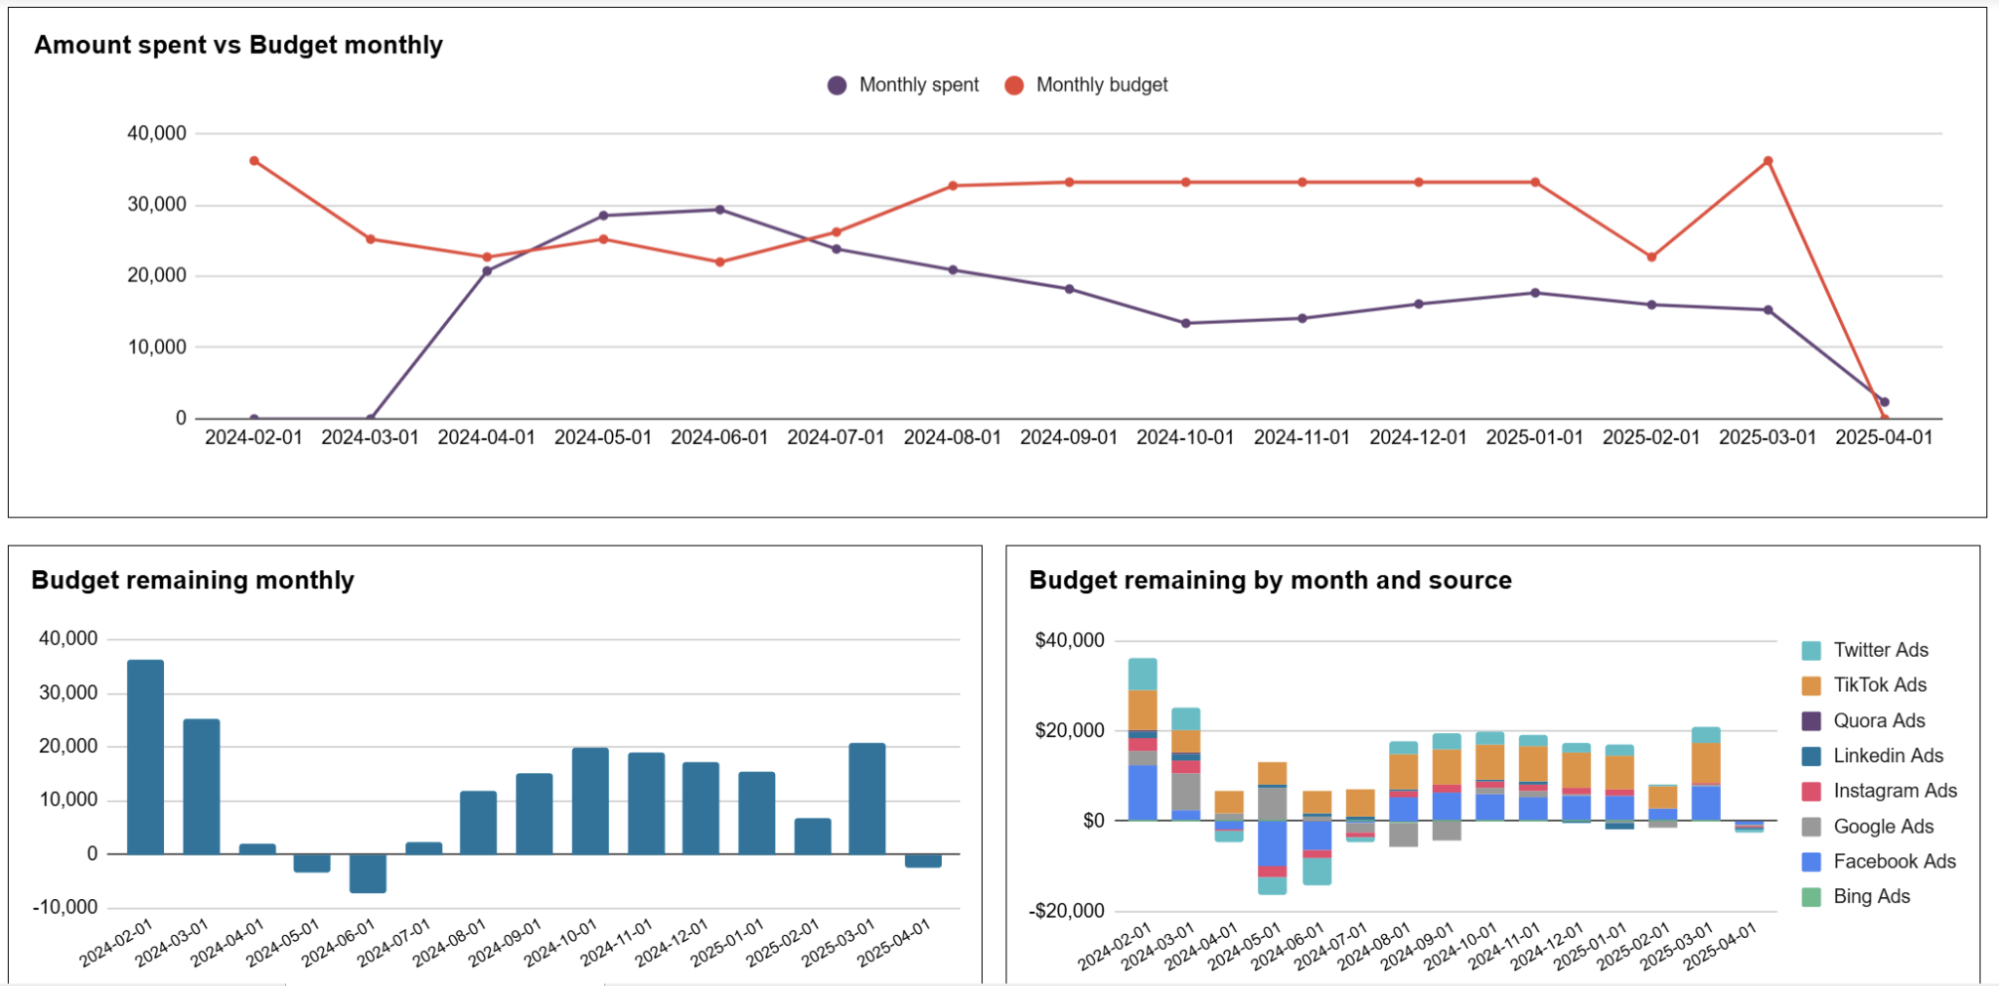
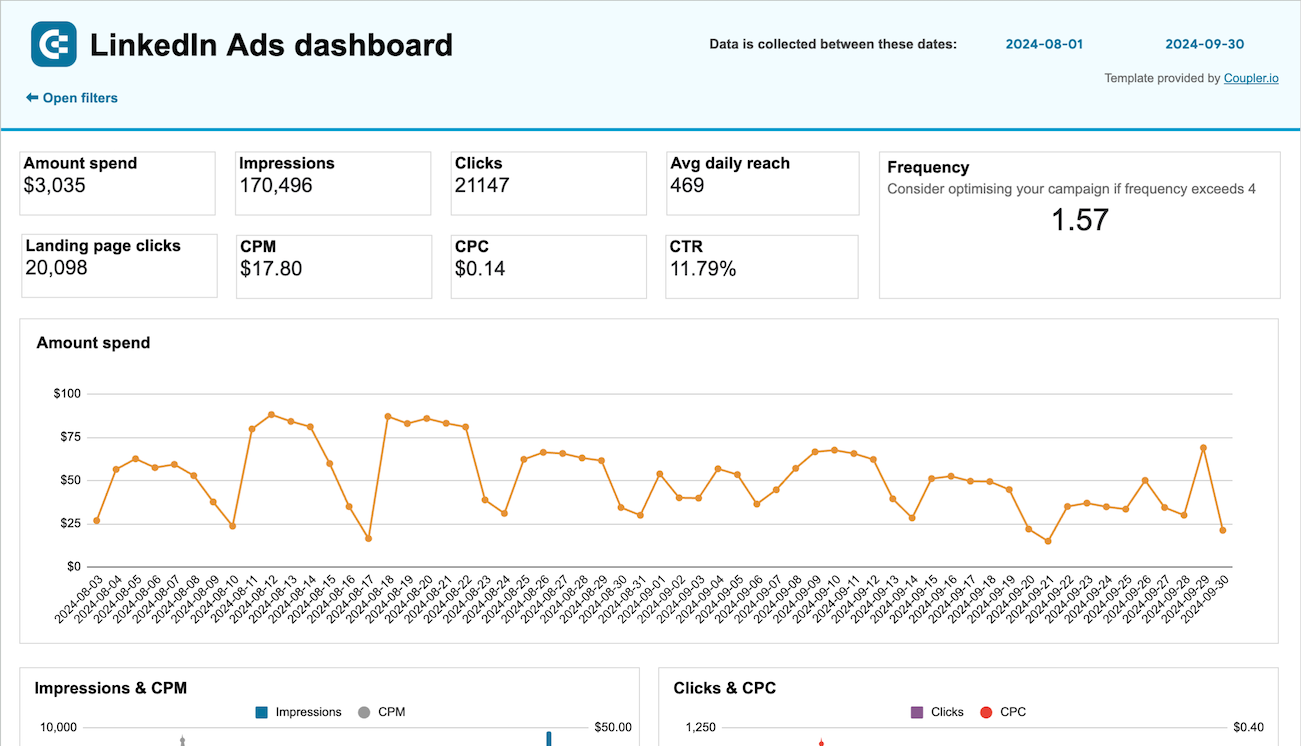
The advertising budget forecast dashboard visualizes how your actual advertising spend compares to planned budgets across different months and platforms. By tracking these patterns over time, you can identify seasonal trends, detect consistent over-budget platforms, and adjust future allocations accordingly. The dashboard alerts you to potential overspending before it becomes problematic and provides predictive insights about future spending requirements based on historical patterns, helping maintain financial discipline while maximizing advertising impact.
How to create an ad dashboard?

Metrics you can track with an ad dashboard template
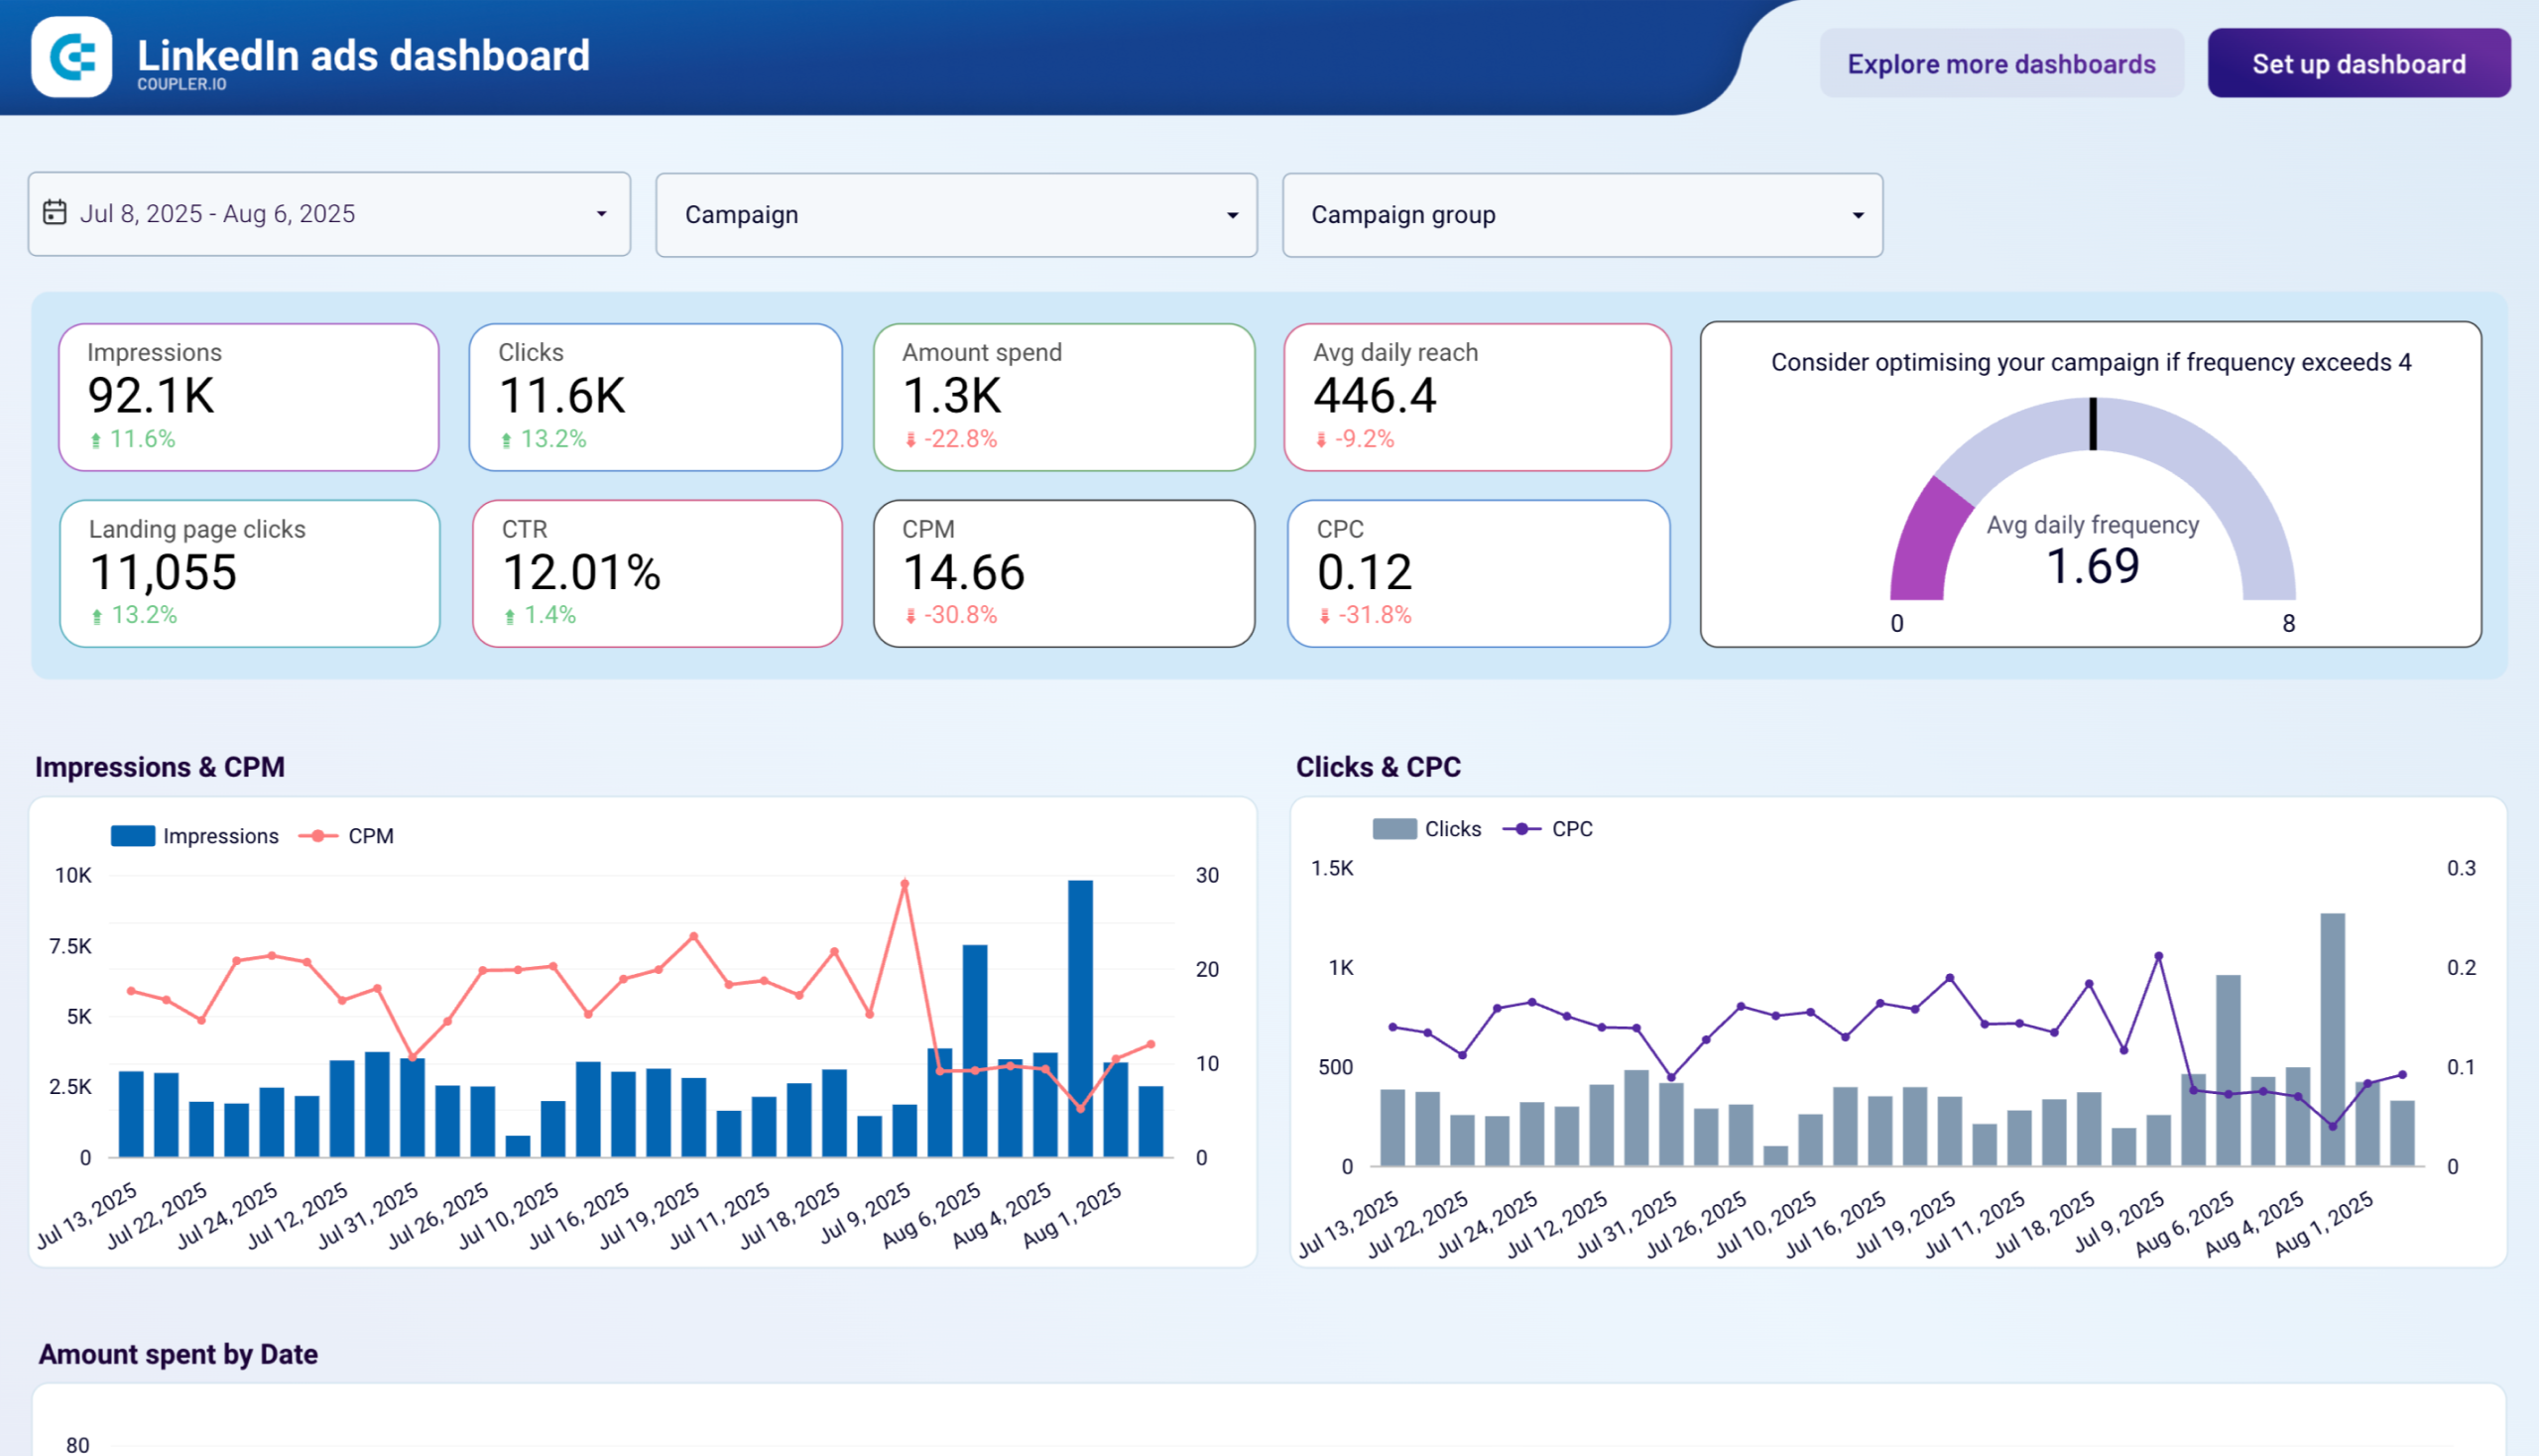
Monitor the total advertising expenditure across all platforms, campaigns, and ad groups in a unified dashboard view. This metric provides clear visibility into your actual advertising costs compared to allocated budgets and helps identify which channels and campaigns consume the largest portions of your budget. By analyzing spend patterns over time, you can optimize budget allocation across platforms and ensure resources are directed to the most effective advertising initiatives.
Track the total number of times your ads were displayed across different advertising platforms with breakdowns by campaign, ad group, and creative. This visibility metric helps evaluate your advertising reach, identify which platforms and campaigns generate the most exposure, and understand how creative and targeting adjustments affect your presence in the marketplace. Comparing impressions across channels provides crucial context for performance analysis and audience reach assessment.
Measure the number of times users clicked on your ads across all advertising platforms in a consolidated view. This direct response metric helps quantify audience interest and interaction across different campaigns, ad formats, and platforms. By analyzing click patterns over time and across channels, you can identify which messages and placements drive the strongest audience engagement and optimize targeting and creative elements to encourage more user interaction.
Monitor the percentage of impressions that result in clicks across all advertising platforms, campaigns, and creatives. This engagement metric reveals how compelling your ads are to your target audience and helps identify which messages, visuals, and placements most effectively capture user attention. Comparing CTR across platforms and campaigns highlights both strengths and opportunities for improvement in your advertising content and targeting strategy.
Track how much you're paying for each user interaction across different advertising platforms and campaigns. This efficiency metric helps identify which platforms and campaigns deliver clicks at the best value, which audiences are most expensive to reach, and how optimization efforts affect your advertising economics. CPC analysis enables smarter budget allocation and helps maximize the number of valuable interactions your budget can secure across all channels.
Measure the cost of delivering 1,000 ad impressions across your advertising platforms and campaigns. This visibility efficiency metric helps evaluate which channels provide the most cost-effective reach and how targeting adjustments impact your advertising economics. CPM analysis is particularly valuable for awareness campaigns where maximizing visibility within budget constraints is a primary objective, helping optimize spend for the greatest possible audience exposure.
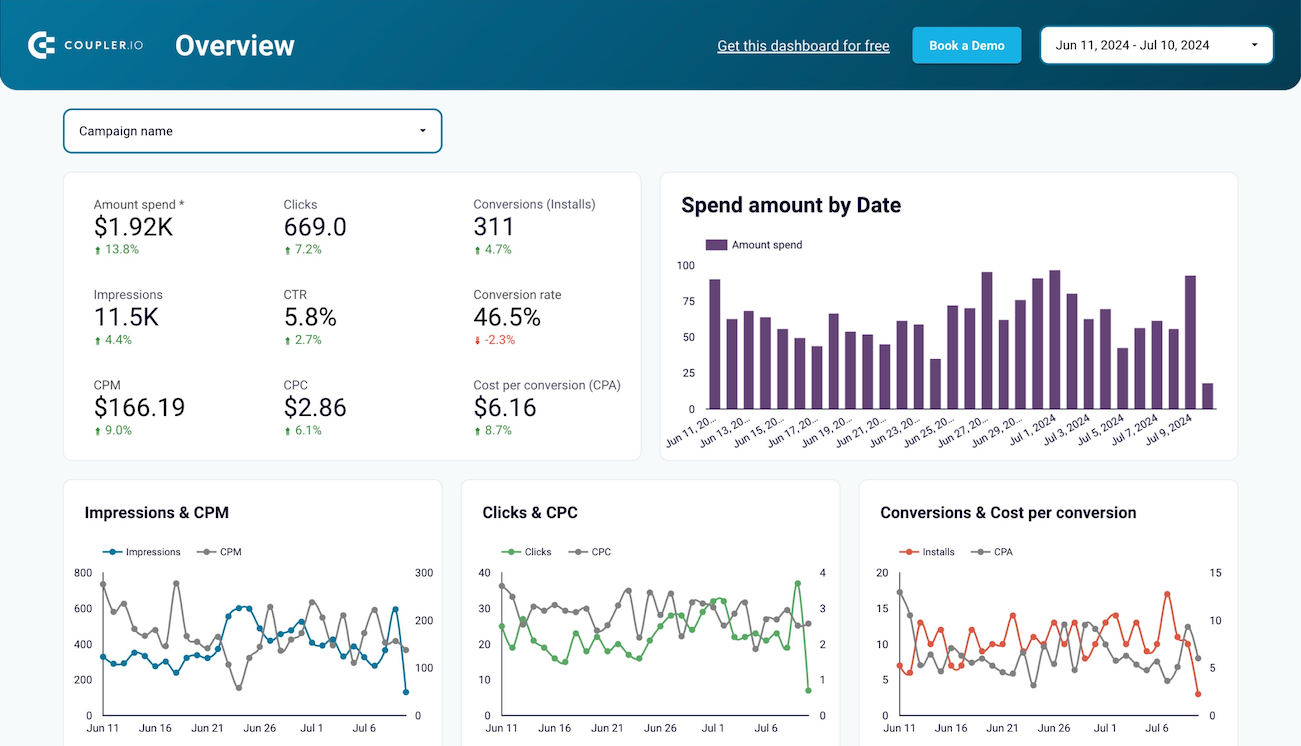
Track how many users complete valuable actions after clicking your ads, from purchases and form submissions to email signups and app downloads. This outcome metric directly connects advertising spend to business results across platforms, helping quantify campaign ROI and identify which channels and campaigns most effectively drive actual business outcomes. Conversion tracking across all platforms provides the ultimate measure of advertising effectiveness beyond mere engagement metrics.
Forecast future advertising expenditures based on current spending patterns and historical data across all platforms. This predictive metric helps anticipate budget requirements, identify potential overspending before it occurs, and plan resource allocation more effectively. By comparing predicted spend against actual results over time, you can continuously improve forecasting accuracy and develop more precise advertising budgets across your entire digital marketing ecosystem.