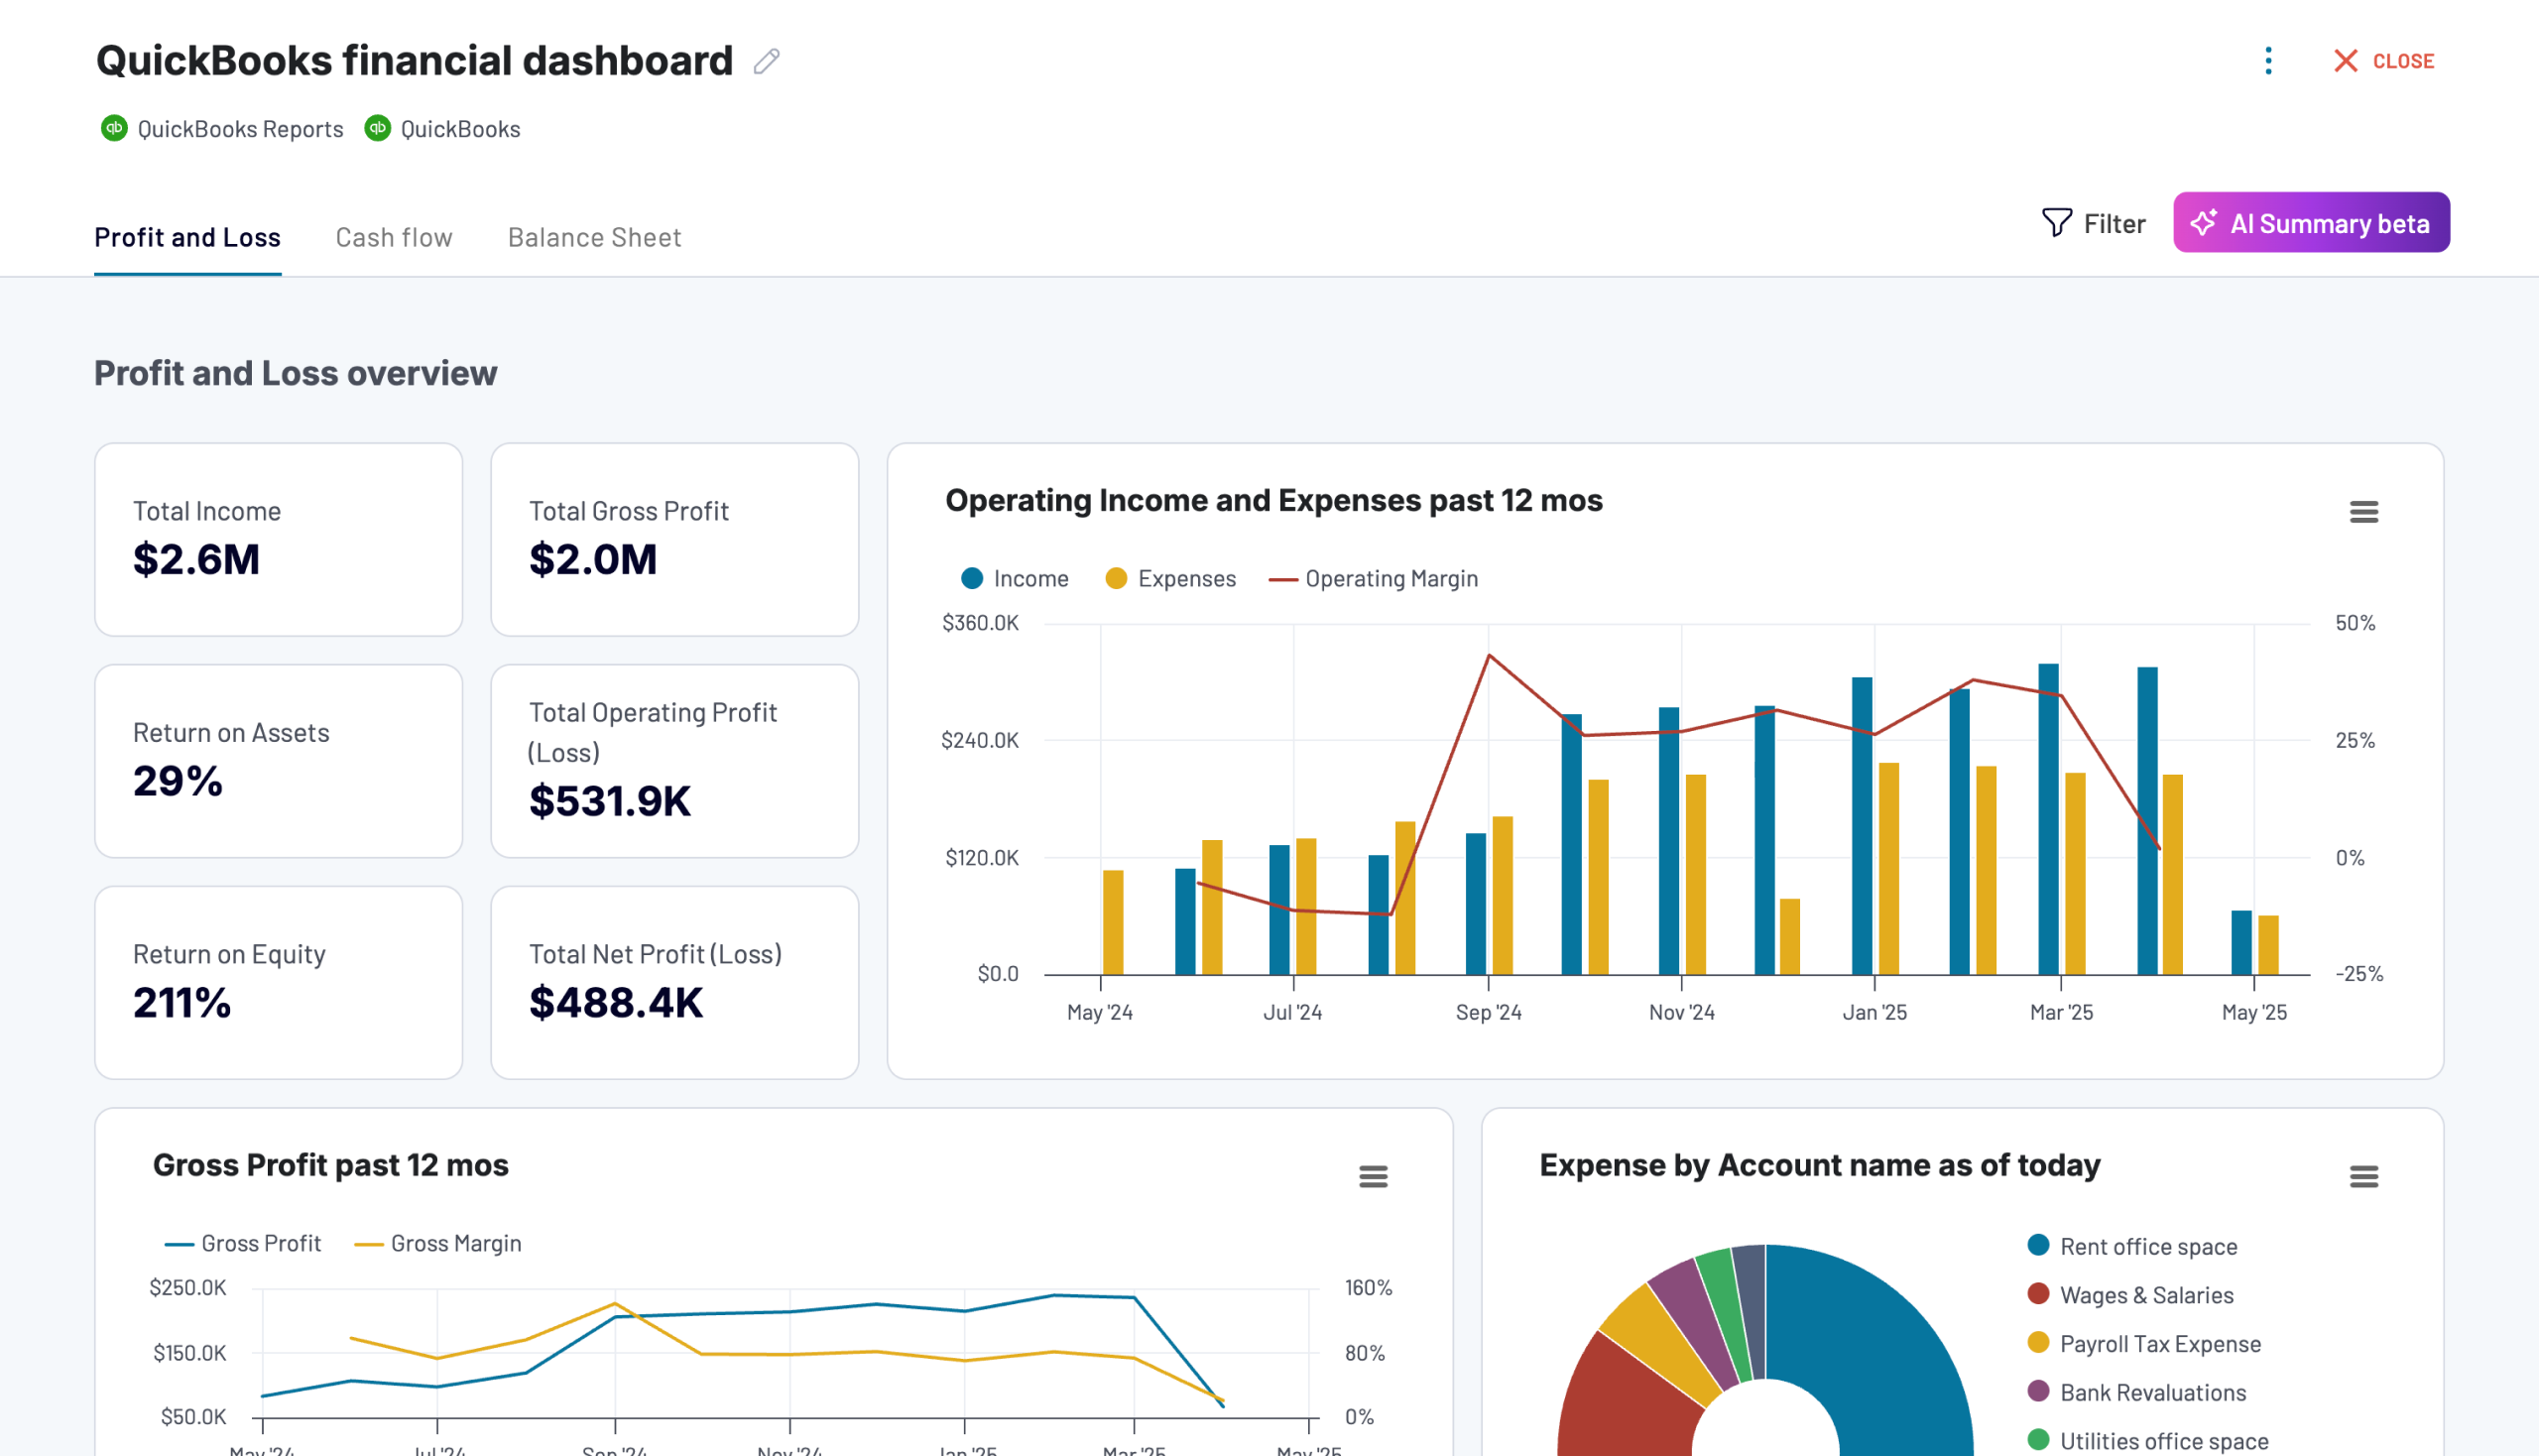
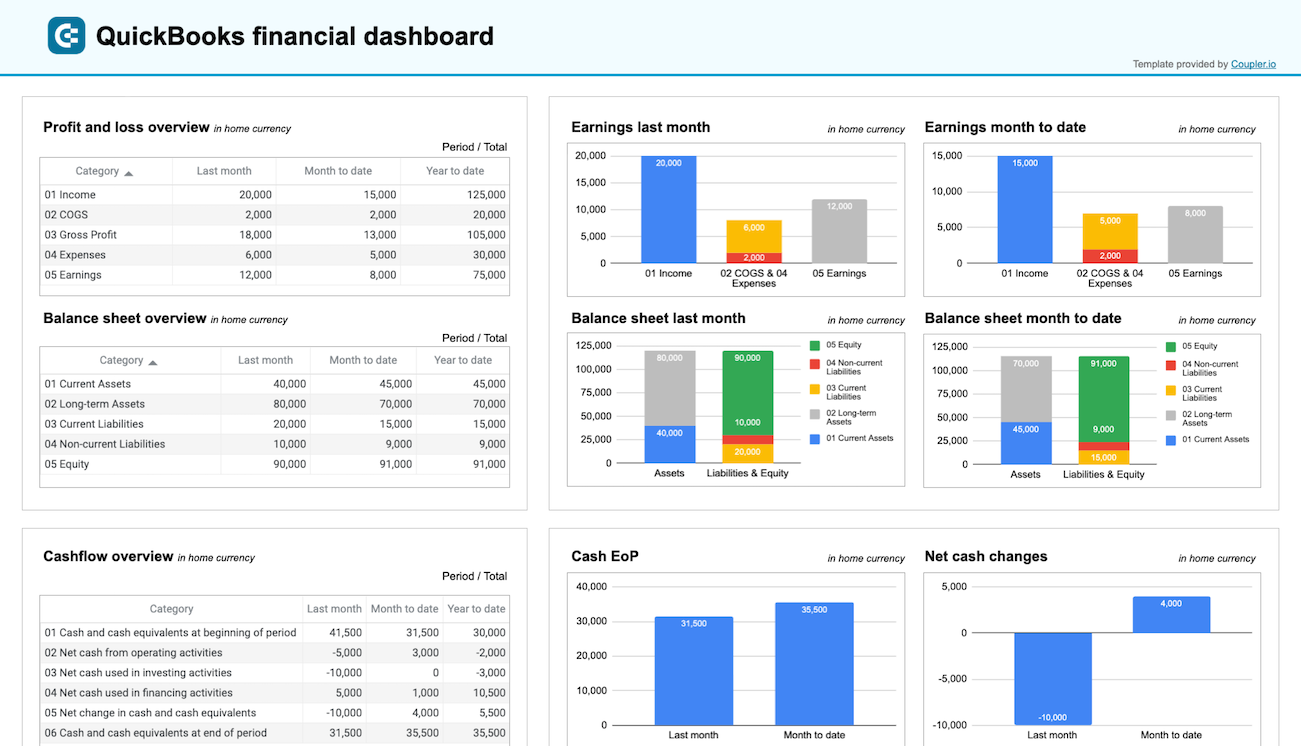
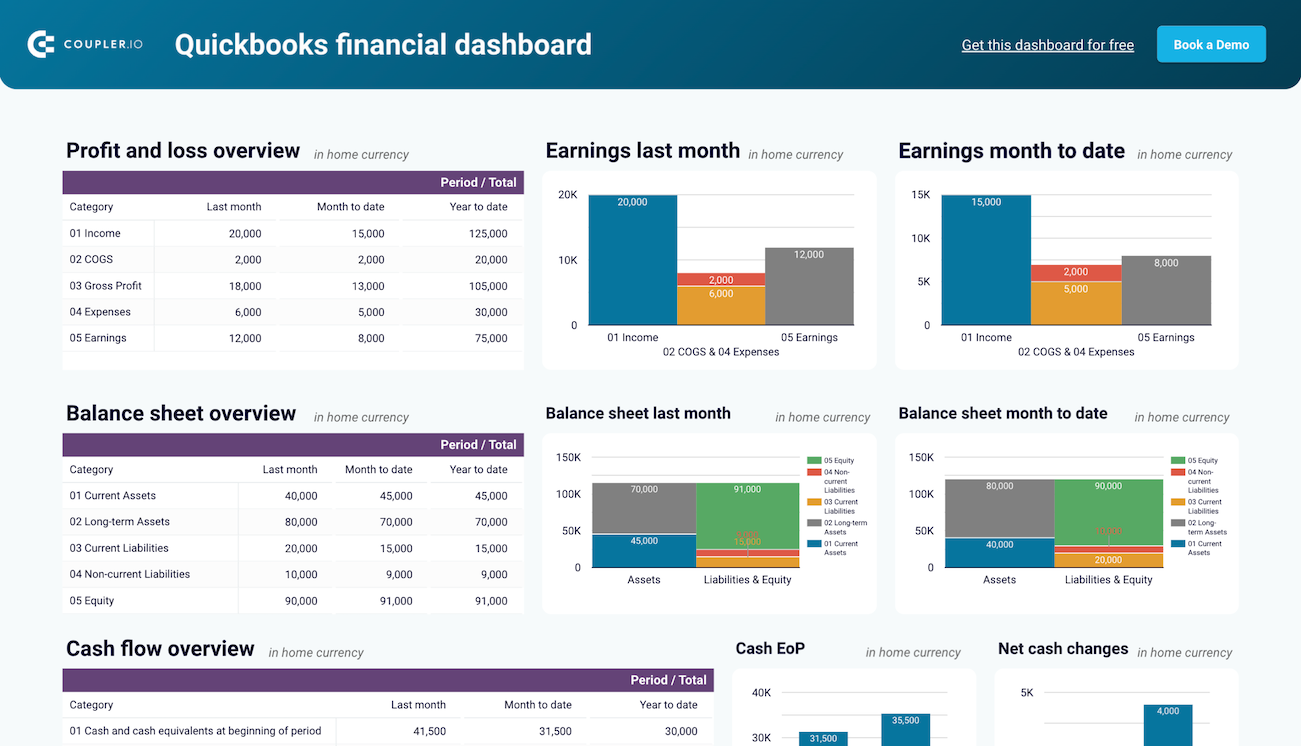
Integrate QuickBooks to Google Sheets with Coupler.io to simplify reporting
Get and prepare data effortlessly
Integrate QuickBooks to Google Sheets to import data without coding. Make various transformations to your data, schedule automated refreshes, and connect multiple sources, all within a single web application interface.
Automate reporting tasks
Thanks to Coupler.io, you can quickly automate data reporting from QuickBooks to Google Sheets. Cut down on manual efforts, create multi-channel reports, and visualize data with our free, ready-to-use dashboard templates.
Stand out as a data-driven expert
Easily provide your clients and stakeholders with transparent, almost live, data-based reports. Coupler.io's advanced financial analytics make it possible to clear your schedule for strategic decision-making instead of data imports.
Export data from QuickBooks to alternative destinations
Quick start with Finance dashboard templates
Automate data exports from QuickBooks to Google Sheets with just a few clicks.
Connect similar Finance & Accounting apps and get data in minutes
What to export from QuickBooks to Google Sheets
These findings may contribute to further financial optimizations.
How to connect QuickBooks to Google Sheets
Pricing plans
- Monthly
- Annual (save 25%)
Keep your data safe
Coupler.io safeguards your shared information and data transfers from breaches, leaks, and unauthorized disclosures.
How to connect QuickBooks to Google Sheets (detailed guide)
Step 1: Collect data
To get started, authorize your QuickBooks account. After that, choose the Data entity from the dropdown list – this is the data type you are going to export.
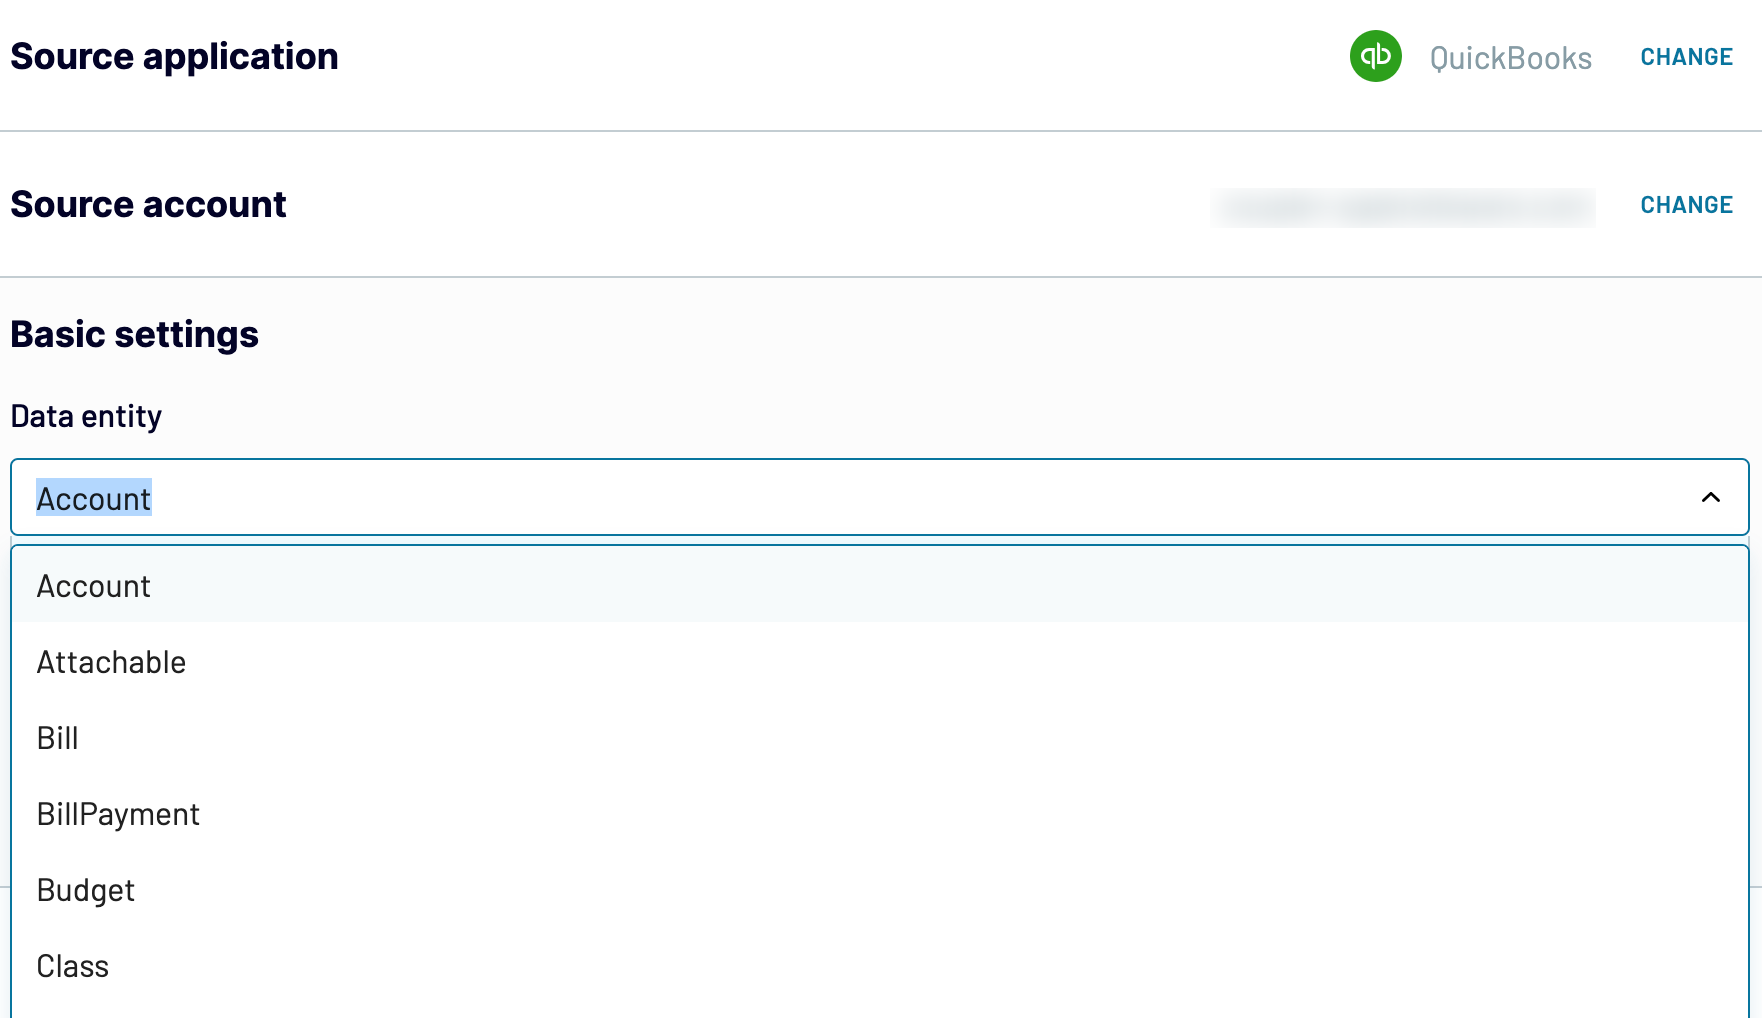
Once you have selected the Data entity, click Finish and proceed. Then, press Transform data to move forward.
Step 2: Organize and transform
Before loading QuickBooks data to Google Sheets, preview it to ensure the accuracy of the future report. Here, you can transform your data in various ways:
- Rename, rearrange, hide, or add columns
- Apply filters and sort your data
- Create new columns with custom formulas
- Combine data from multiple accounts or apps
Use these features to fine-tune data according to your reporting and analytics needs.
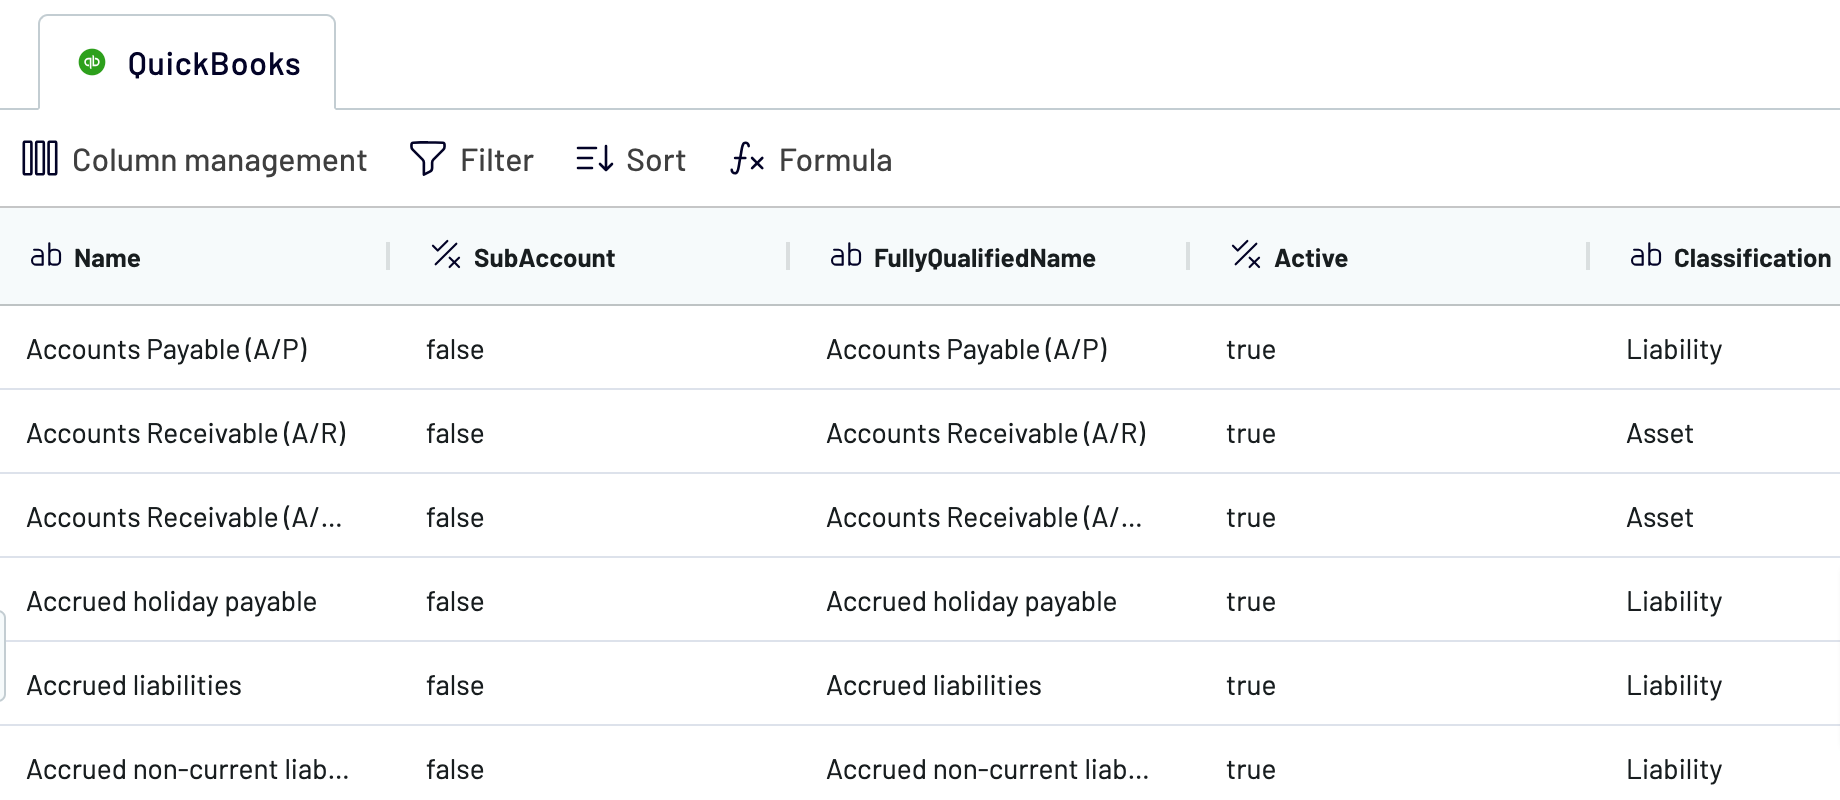
When you're ready with your data, click Proceed.
Step 3: Load and automate
At this stage, the first thing for you to do is authorize the Google Sheets account. To import data from QuickBooks to Google Sheets, you must specify the destination spreadsheet and sheet. As an option, you may create a new sheet by providing its name in the corresponding field.
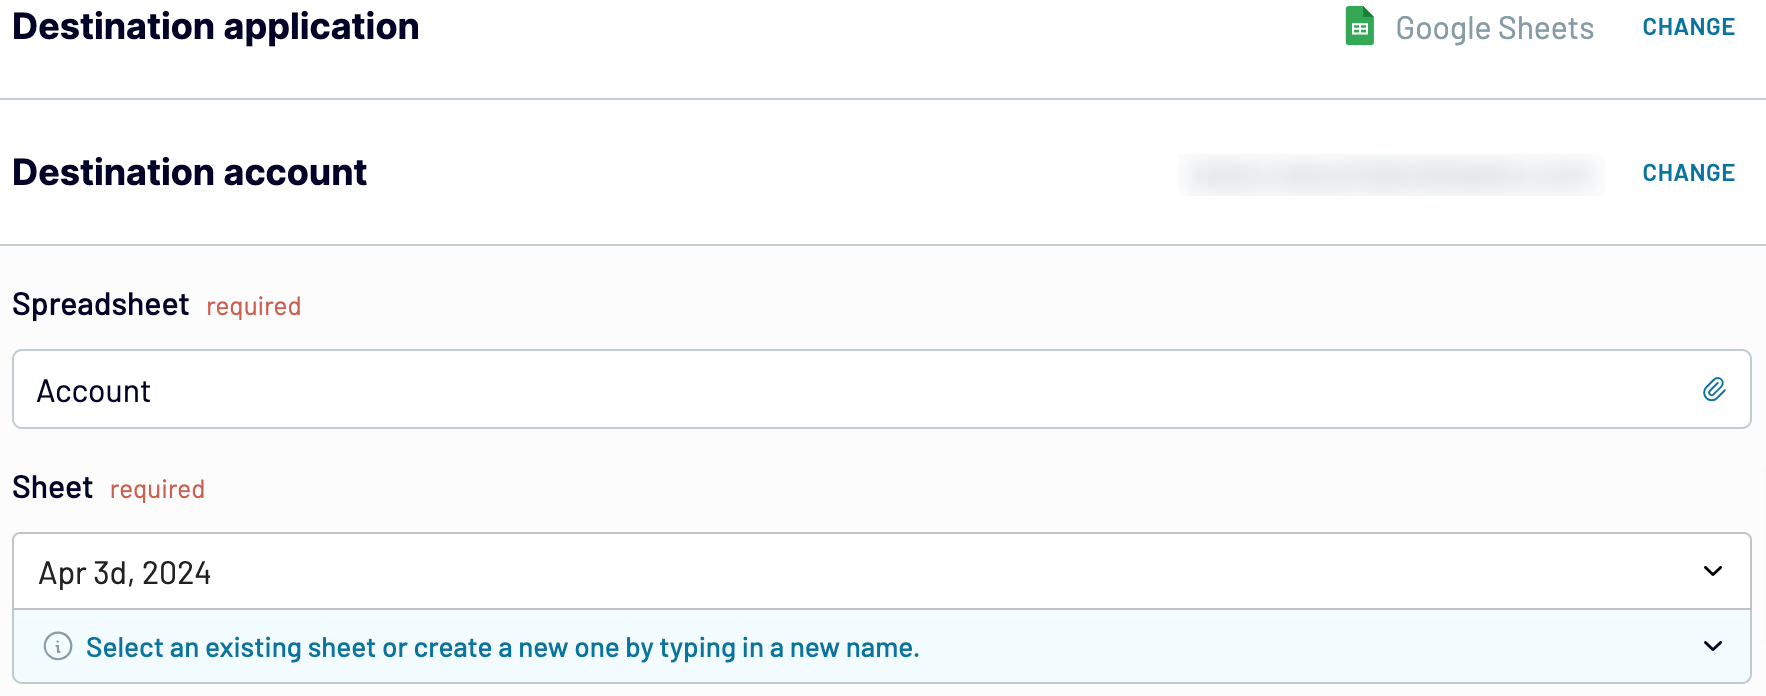
Next, press Setup a schedule to turn on automated data refreshes and select the necessary interval. Lastly, click Run importer to export QuickBooks to Google Sheets.
Export QuickBooks to Google Sheets and automate it on schedule
Decide how often you'd like to have your report updated: monthly, daily, hourly, or even more frequently, e.g., every 30 or 15 minutes. Then, choose specific days of the week. Additionally, select your time preference and pick a suitable timezone.

Once you customize auto-updates, you'll always have the latest data available for analysis. With reports that reflect the most recent changes to the source, there's no more need for manual data refreshes. So you can dedicate your valuable time to more critical tasks.
What key metrics can you export from QuickBooks to Google Sheets?
Description: Total income stands for the total revenue generated from sales, services, or other sources within a specific period. It provides an overview of the business's revenue streams, which is beneficial for financial analysis and performance evaluation.
How to calculate: add up all revenue streams, including sales, services, and other income sources.
Total cost of goods sold (COGS)
Description: This metric represents the total cost incurred in producing or acquiring the goods sold during a given period. It lets you know the direct costs associated with the production of goods. So, it's important for pricing decisions and profitability analysis.
How to calculate: sum up the costs of raw materials, labor, and manufacturing expenses related to goods sold.
Gross profit
Description: This measurement demonstrates the difference between total revenue and the total cost of goods sold. It showcases business efficiency and the profitability of the company's core business activities before accounting for other expenses.
How to calculate: subtract the total cost of goods sold from total income.
Total expenses
Description: Total expenses comprise all costs incurred in running the business, such as operating or financial expenses. Looking at results on this metric, you can delve deep into the company's expenditure for better budgeting and financial planning.
How to calculate: sum up all expenses during the specified period.
Net earnings
Description: This is about the company's total earnings after subtracting all expenses from total income. It reflects the business's profitability subsequent to accounting for the costs. This metric serves as a crucial indicator of financial health and performance.
How to calculate: subtract total expenses from total income.
Average revenue by customer
Description: As simple as it sounds, this is the average revenue generated per customer over a specific period. It illustrates customer spending patterns and points to high-value customers for better-targeted marketing and customer relations management.
How to calculate: divide total income by the number of unique customers.
Average price by product
Description: Average price by product is one more metric with a self-explanatory name. It's the average selling price of each product or service the company offers. You may find it useful for product profitability analysis, cost optimization, or product differentiation.
How to calculate: divide the total revenue generated by a specific product by the quantity sold.
Connect QuickBooks data to Google Sheets or another destination
We can group additional destinations as follows:
- Microsoft Excel, another spreadsheet application
- Data warehouses (BigQuery, PostgreSQL, Redshift)
- Business intelligence (BI) tools (Looker Studio, Power BI, Tableau, Qlik)

With Coupler.io, you can integrate data into alternative destinations as easily as we did in the Google Sheets example above.


