
Put your Shopify reporting and analytics on autopilot
Integrate Shopify with spreadsheets, data warehouses, or BI tools to build up a reliable reporting system for efficient decision-making. Get an all-in-one solution to gather, transform, understand and automate your Shopify data without any hassle.


Analyze your Shopify data easier
Collect data on a scheduled basis and blend it with information exported from other applications.

Manage and create new columns, apply filters, and perform other data transformations before loading it into the destination.

Get analysis-ready data with Coupler.io and build dashboards using Looker Studio or other BI tools in minutes.

Schedule the refresh of your Shopify data and build triggered automation sequences using incoming and outgoing webhooks.


Coupler.io made it easy to create dashboards and reports from different data sources. The sync is reliable and the user experience is amazing.

Take your reporting to the next level
 Sign Up with Google
 Sign Up with MICROSOFT
 SIGN UP WITH EMAIL
By signing up to Coupler.io, you agree to our Privacy Policy and Terms of Use.
Use Coupler.io dashboards templates
Coupler.io offers a range of ready-to-use interactive dashboard templates designed to streamline your reporting and analytics. Explore our template gallery and connect your Shopify to start using the plug-and-play dashboard right away.

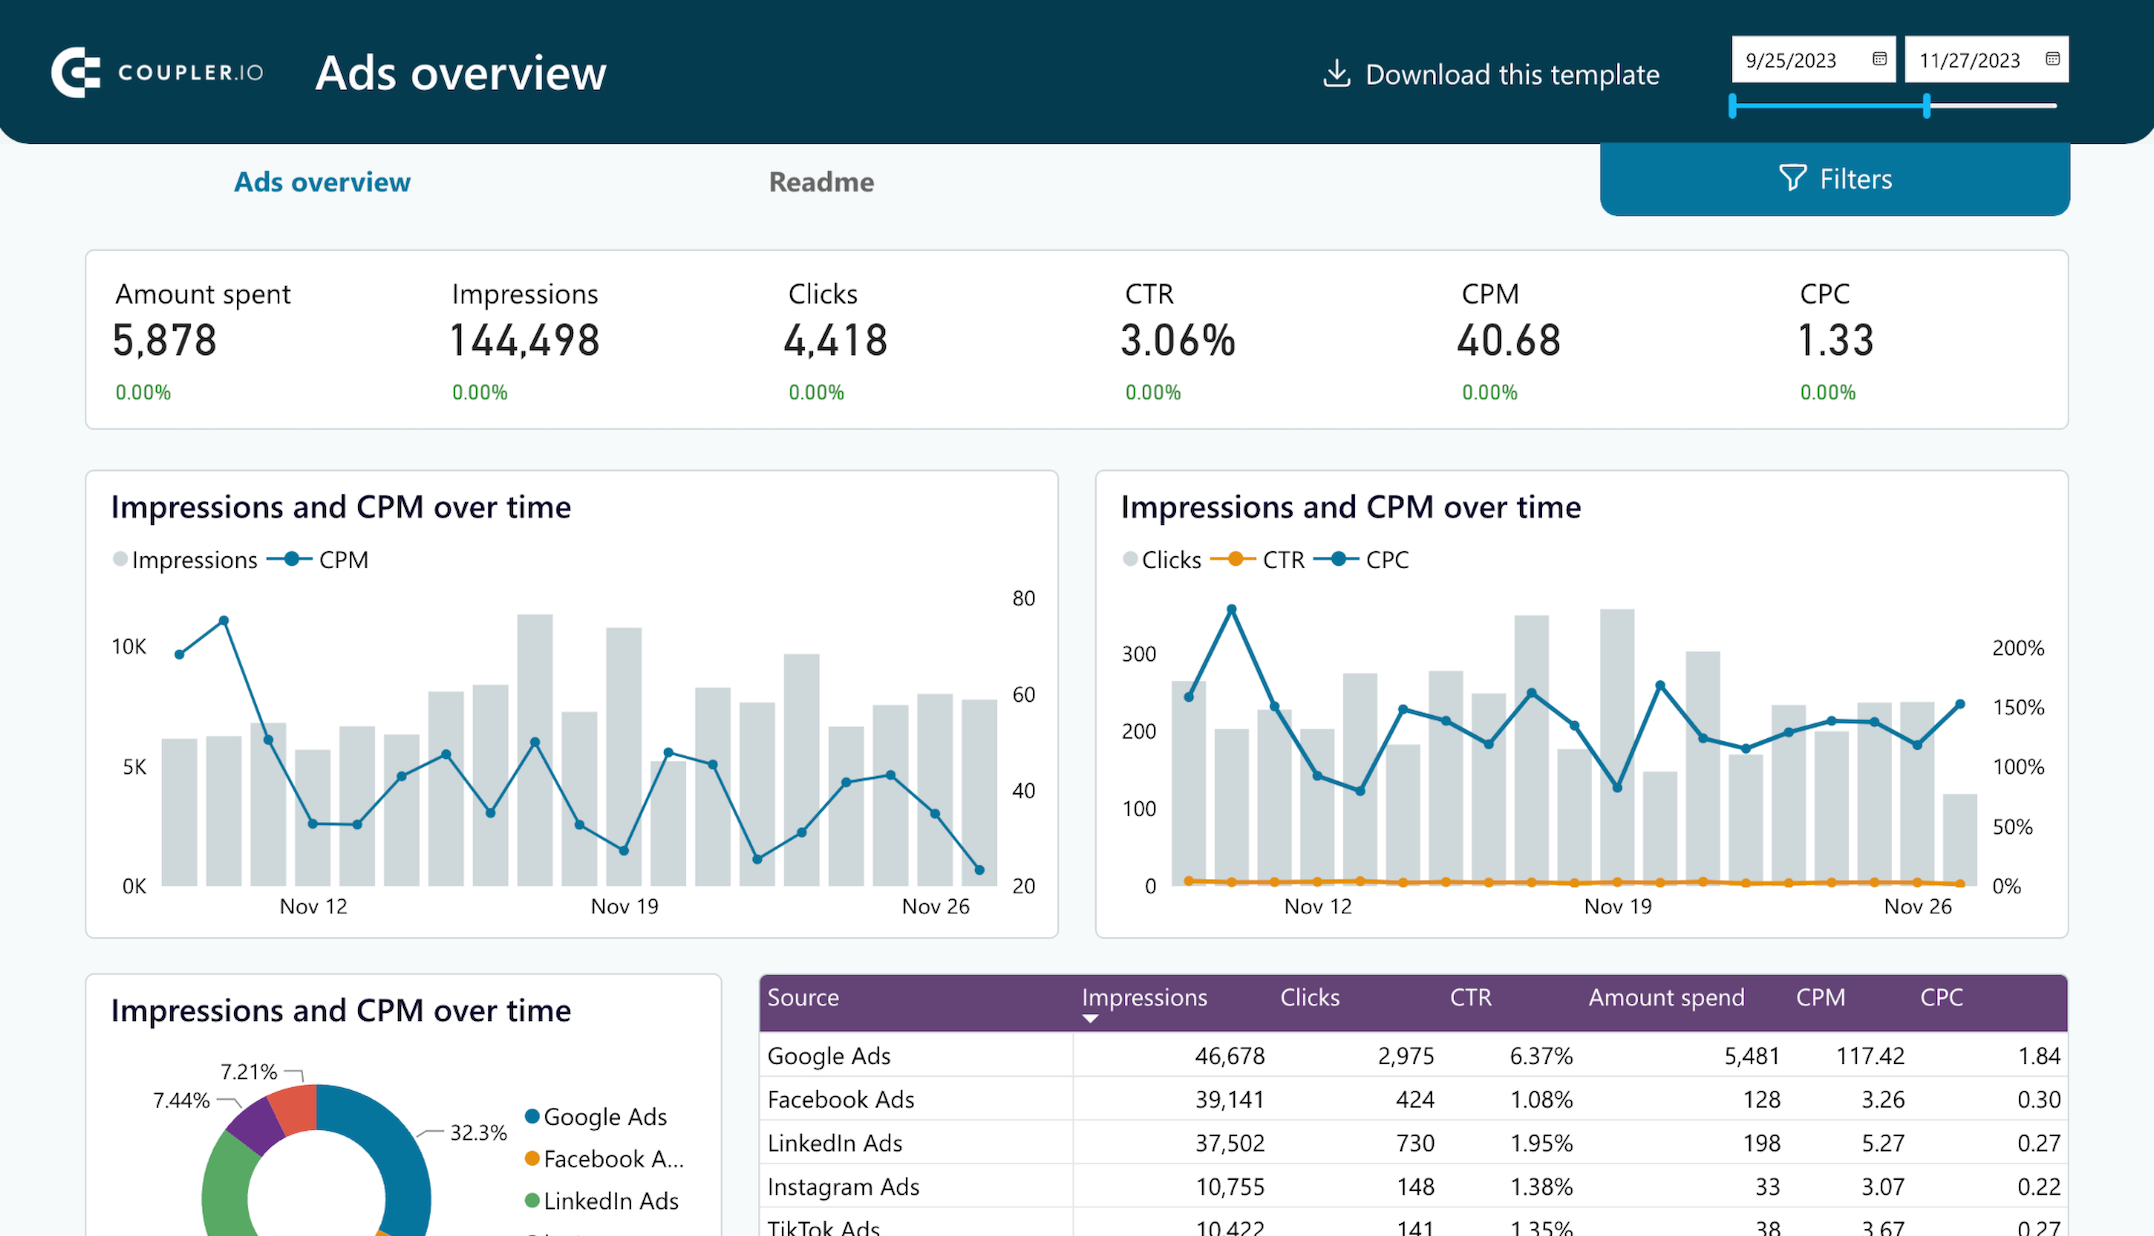
Get a comprehensive PPC reporting tool to track the performance of your campaigns launched at multiple advertising platforms.


Monitor how much you spend on your ads across multiple platforms using a one-stop PPC monthly budget dashboard template.

Use the insights based on the data from GA4 to monitor your website traffic and discover which pages resonate most with your audience.

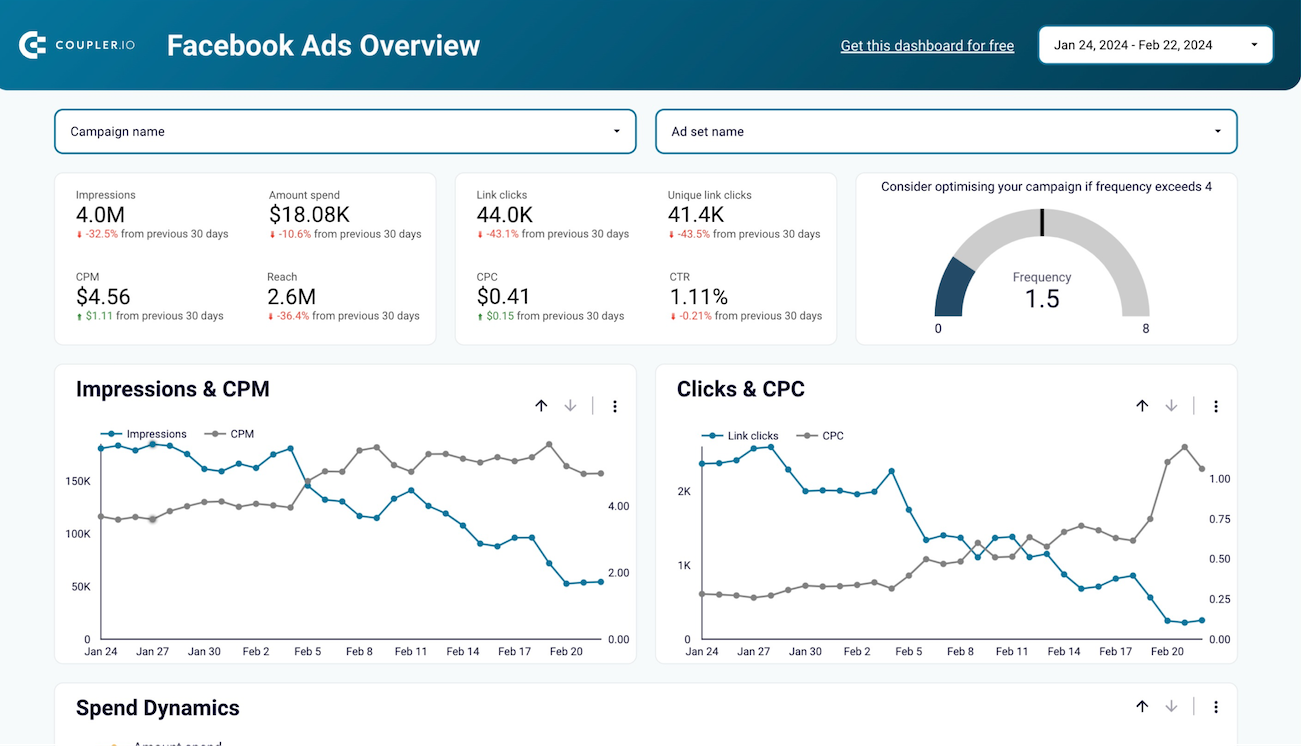
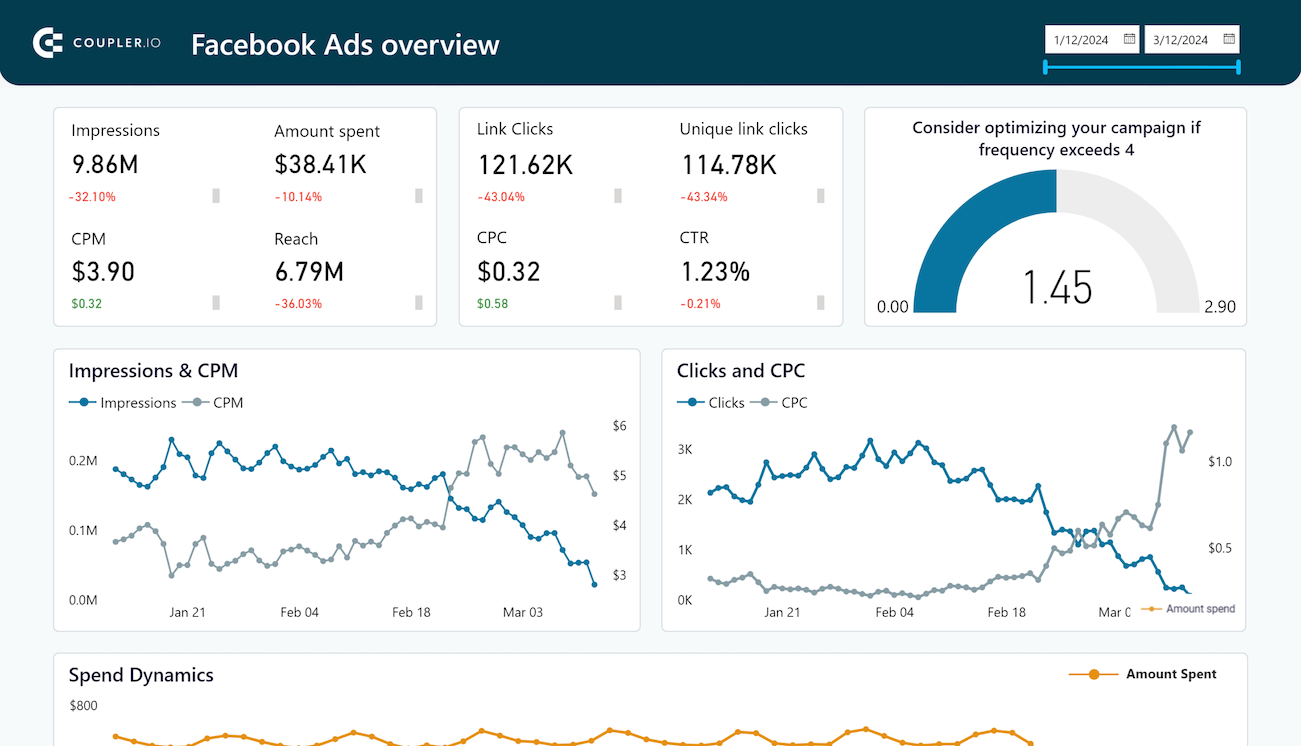
Effectively manage and optimize your Facebook advertising campaigns, reaching your target audience in a data-driven way.

Get an overview of your Instagram post performance, profile interactions, and demographic insights about your followers, all within a single dashboard


Understand how your Facebook or Instagram Ads campaigns impact brand awareness. Find a correlation between paid impressions and branded searches in Google. Check country by country with 2 simple charts to find where your Ad spend impacts the most.


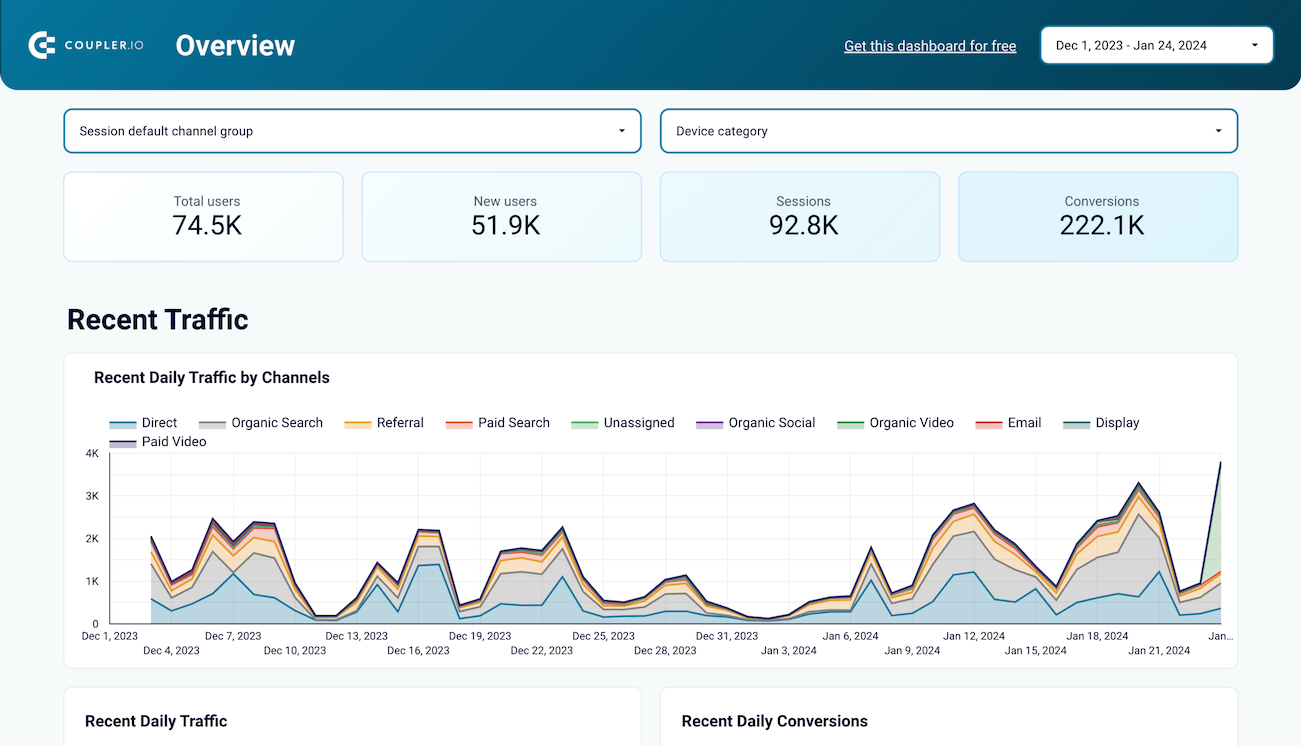
Analyze the performance of the traffic to your Shopify store using data from advertising platforms and Google Analytics 4, all consolidated on a single dashboard.


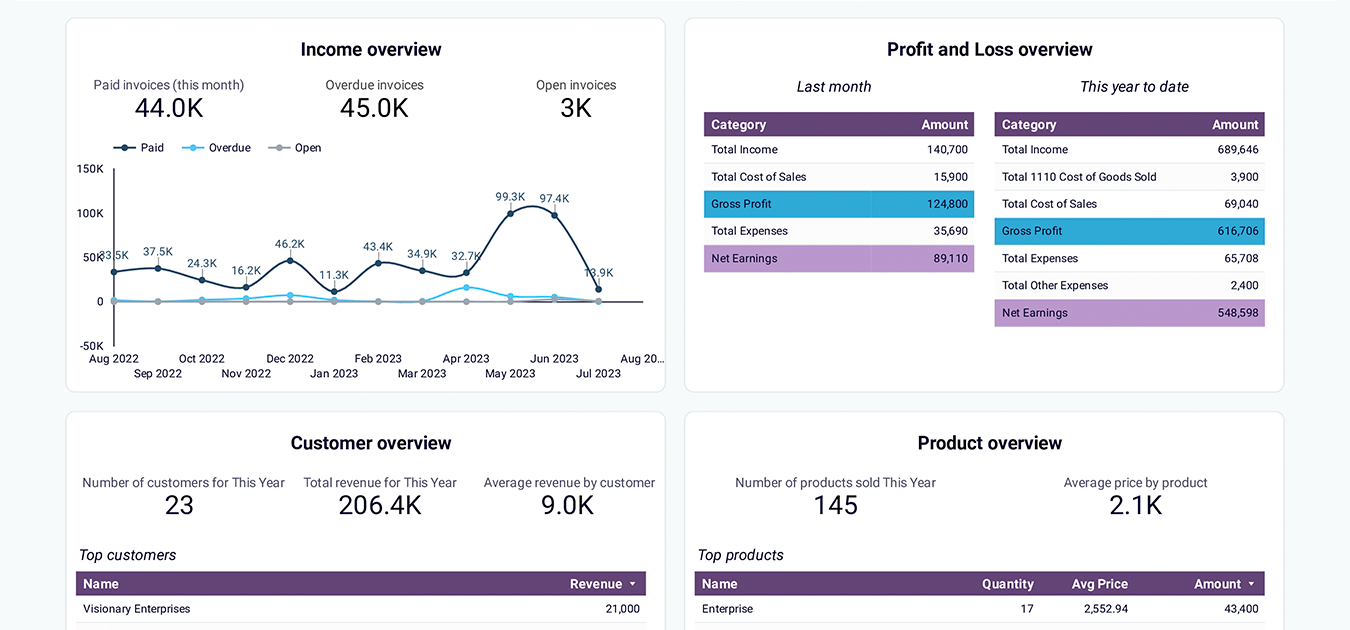
Get an overview of your revenue based on the data from QuickBooks and unlock in-depth insights to drive informed business decisions.

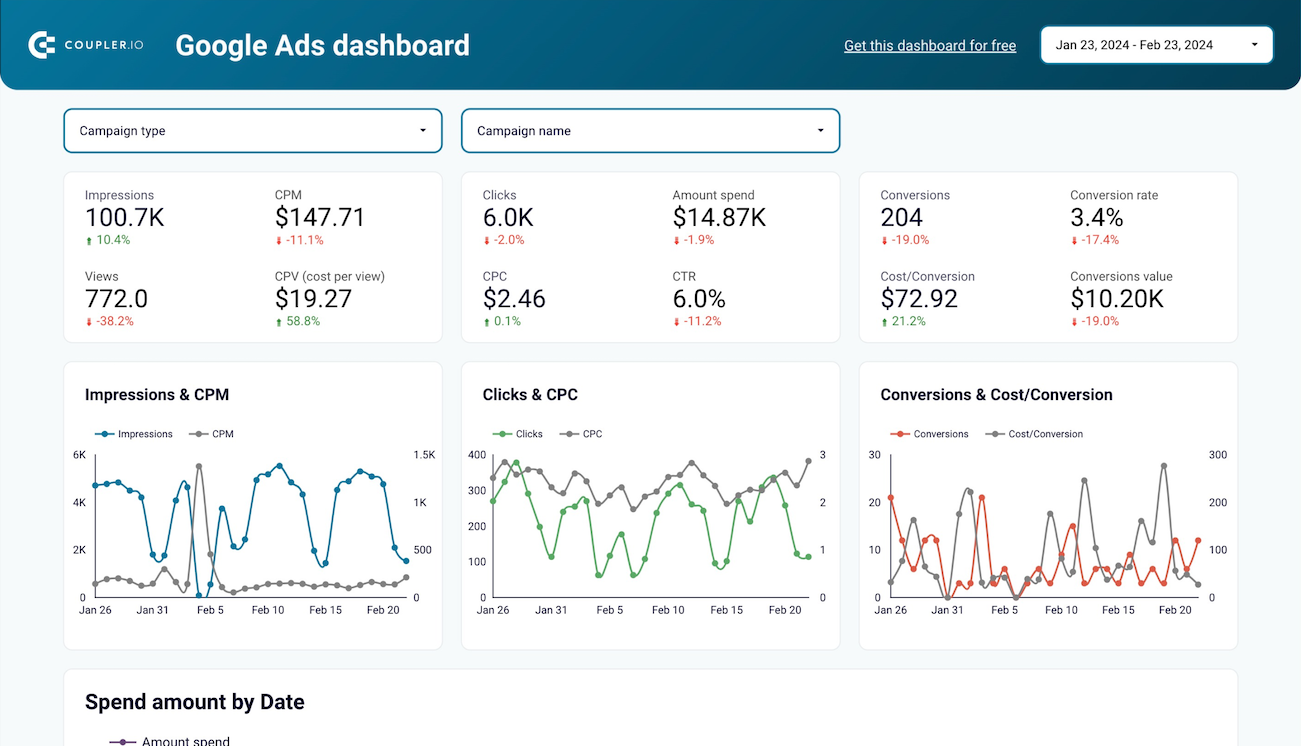
Get a detailed overview of the performance of your Google ads advertising campaigns to achieve your marketing goals better.

Use a PPC dashboard designed for Google Sheets to track the performance of your campaigns across multiple advertising platforms.

Monitor, analyze, and optimize the performance of your ads across various channels and your budget with our all-encompassing PPC dashboard for Google Sheets
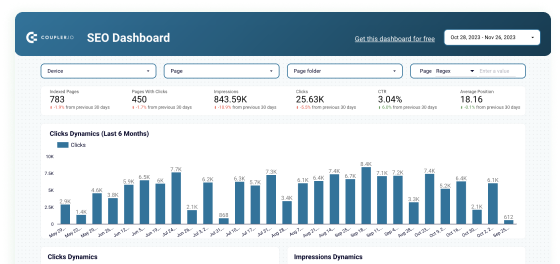
Optimize SEO with Looker Studio's dashboard for Google Search Console. Track page rankings, CTRs, and organic traffic efficiently.

Use one dashboard to analyze the effectiveness of your Pipedrive acquisition funnel. Gain insights from data sourced from ad platforms and Google Analytics 4.

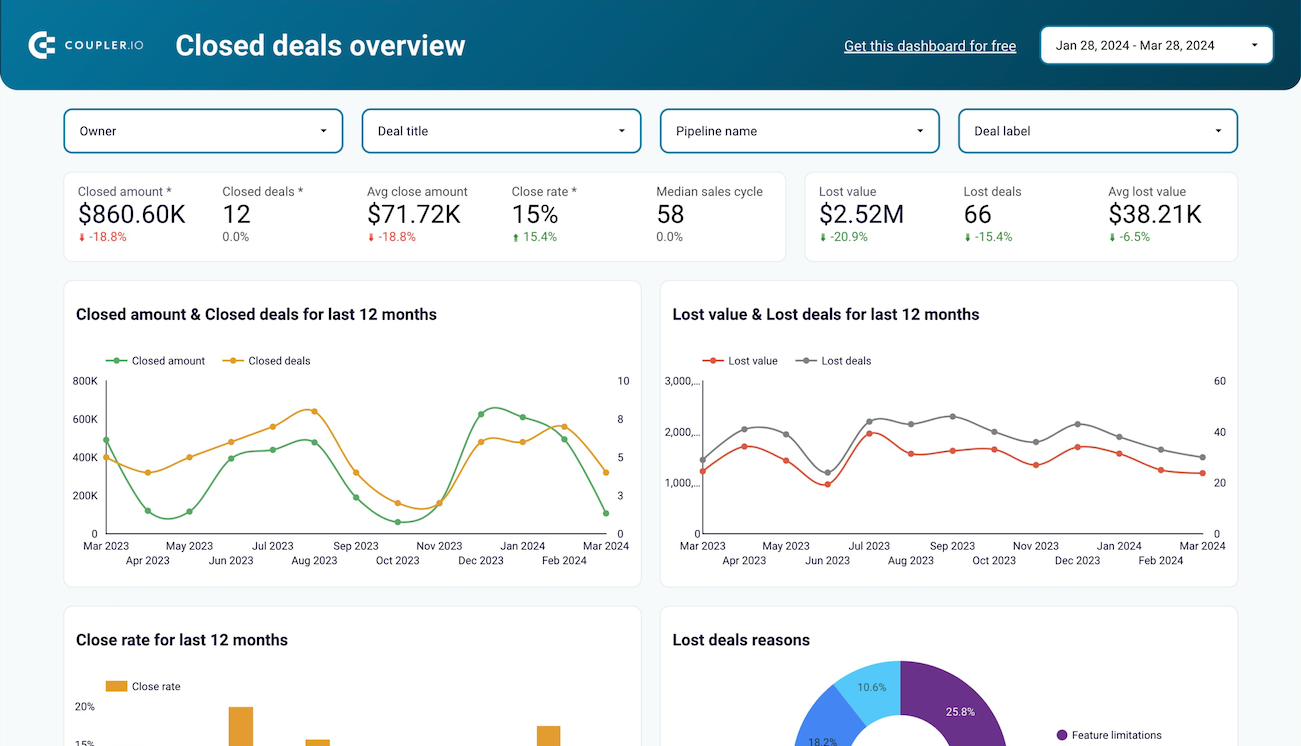
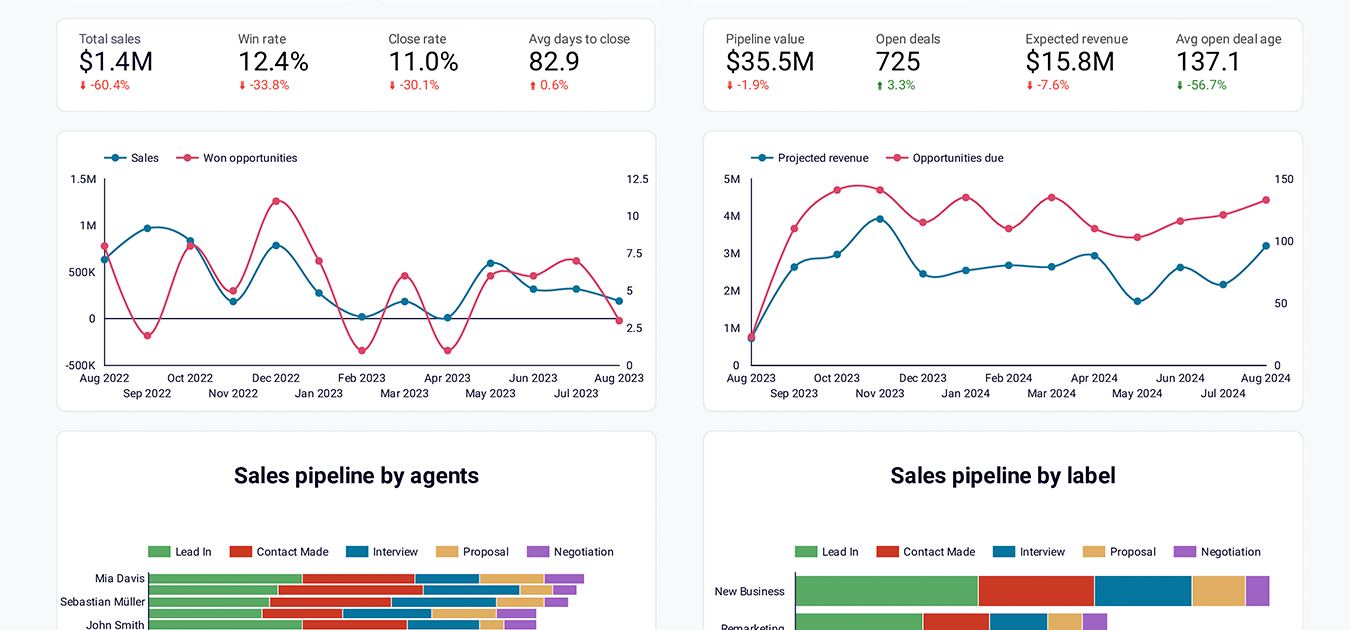
Analyze the critical sales metrics and key performance indicators from Pipedrive, including deal details, revenue, and pipeline health, to make strategic decisions.

Analyze the key metrics of your sales department, drill down into particular deals, find the top performers, and stay on top of your Pipedrive sales.
Utilize a Power BI PPC dashboard for tracking and analyzing your advertising campaigns across multiple platforms.


Overview the performance of your advertising campaigns in Google Ads and track monthly dynamics of key metrics.
Get a detailed overview of your advertising campaigns’ performance using a dynamic Power BI dashboard template equipped with a no-code Facebook Ads connector
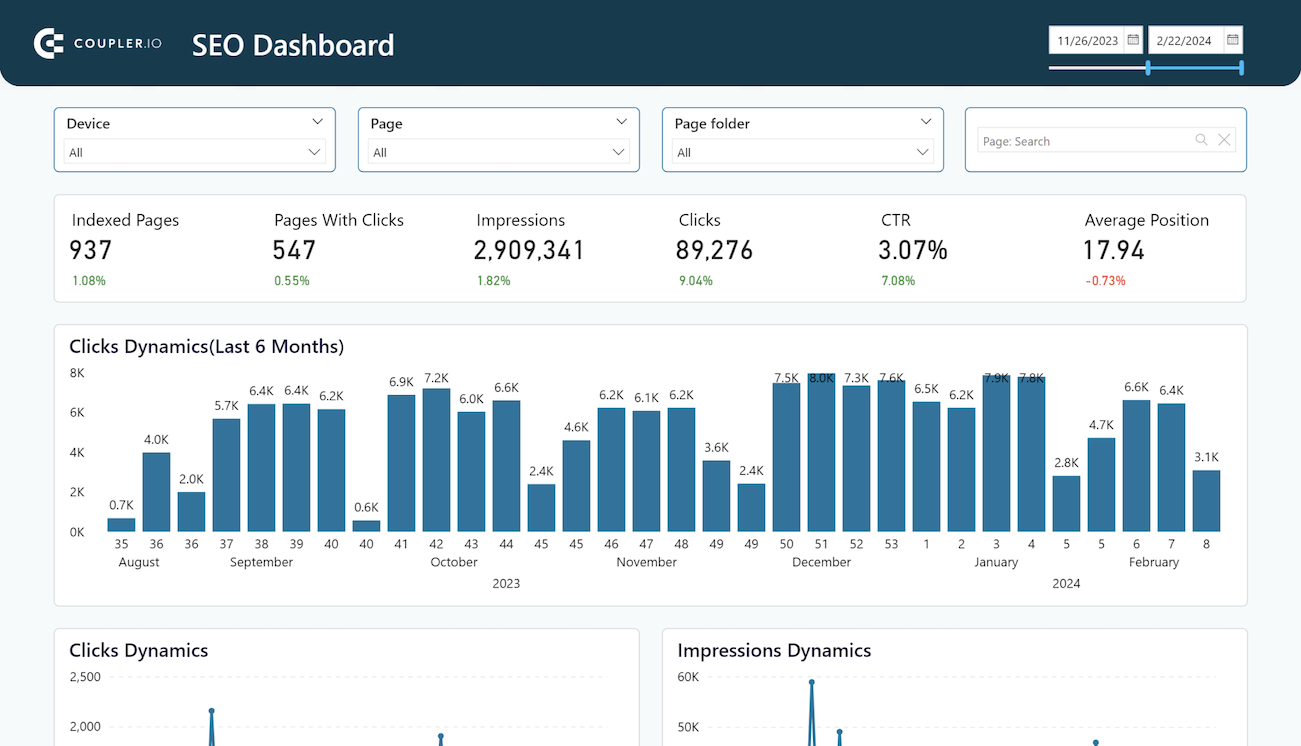
Get insights into your page's SEO performance with our Power BI dashboard template integrated with Google Search Console.

Analyze your Shopify store traffic by channels, countries, and items based on the data collected from Google Analytics 4
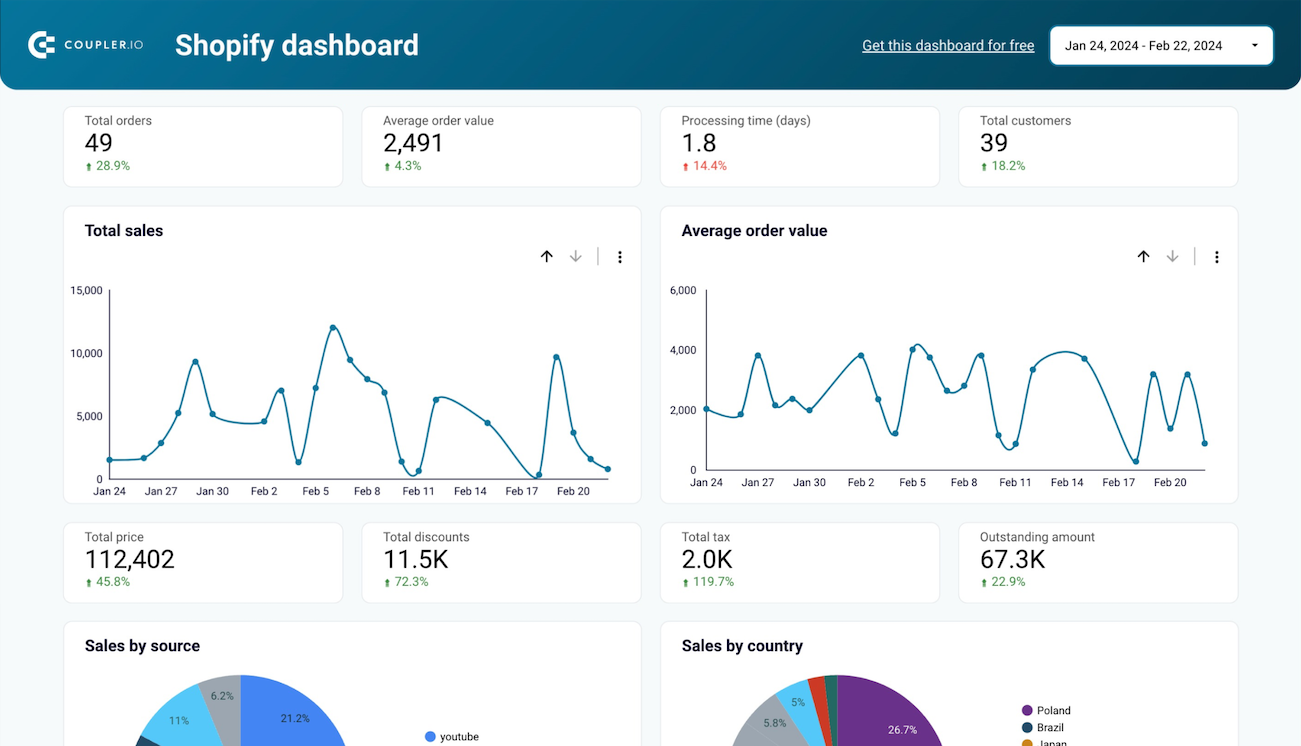
Access the performance of your Shopify ecommerce store and uncover critical insights into how to manage your orders effectively and increase revenue.

Get an overview of the HubSpot sales metrics and KPIs to see how many deals are won or lost, how much revenue you generate, and derive other insights into pipeline health.


Get a complete understanding of your HubSpot sales and dive deeper into open and closed deals. Track the team performance, see how sales shape up over time, and analyze what drives your results.
Monitor your Salesforce sales efforts with an overview of your opportunities, accounts, and campaigns. Track the key metrics, check how the team performs, and understand what drives your revenues.


Analyze your sales funnel performance with the insights collected from Salesforce, Google Analytics, and the ad platforms you use for lead generation.
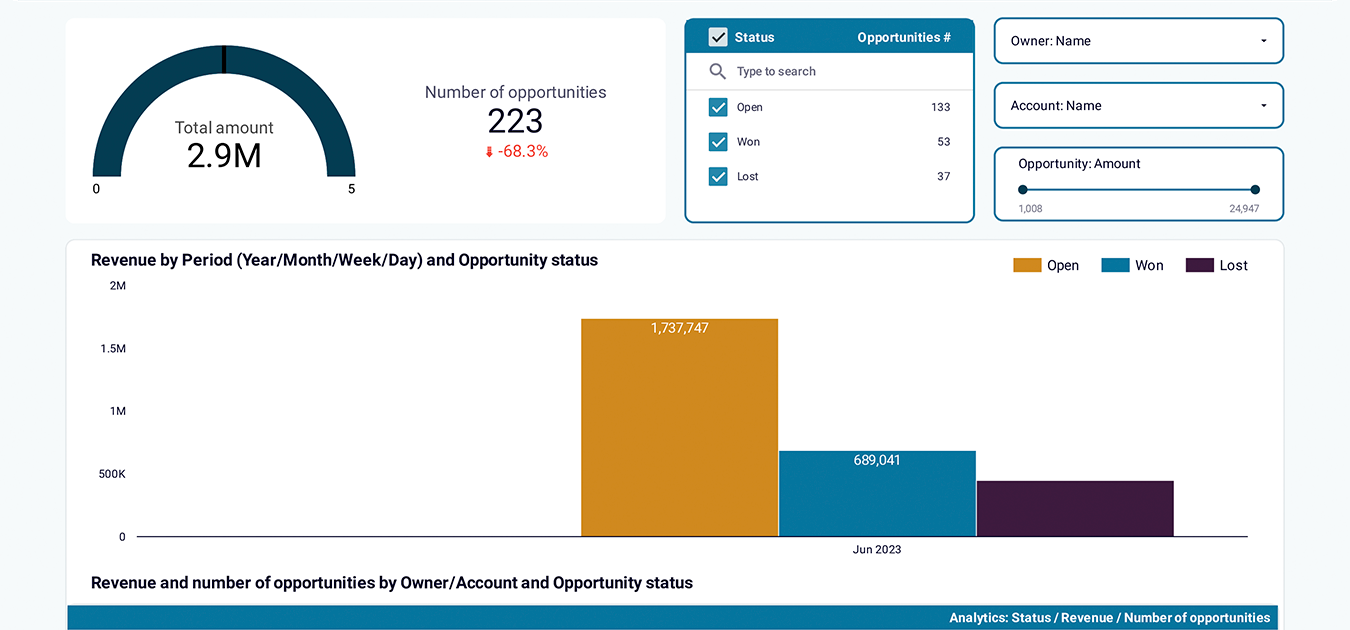
Get a comprehensive overview of your revenue, monitor the status of your deals, and derive other insights with the help of a Salesforce sales dashboard.
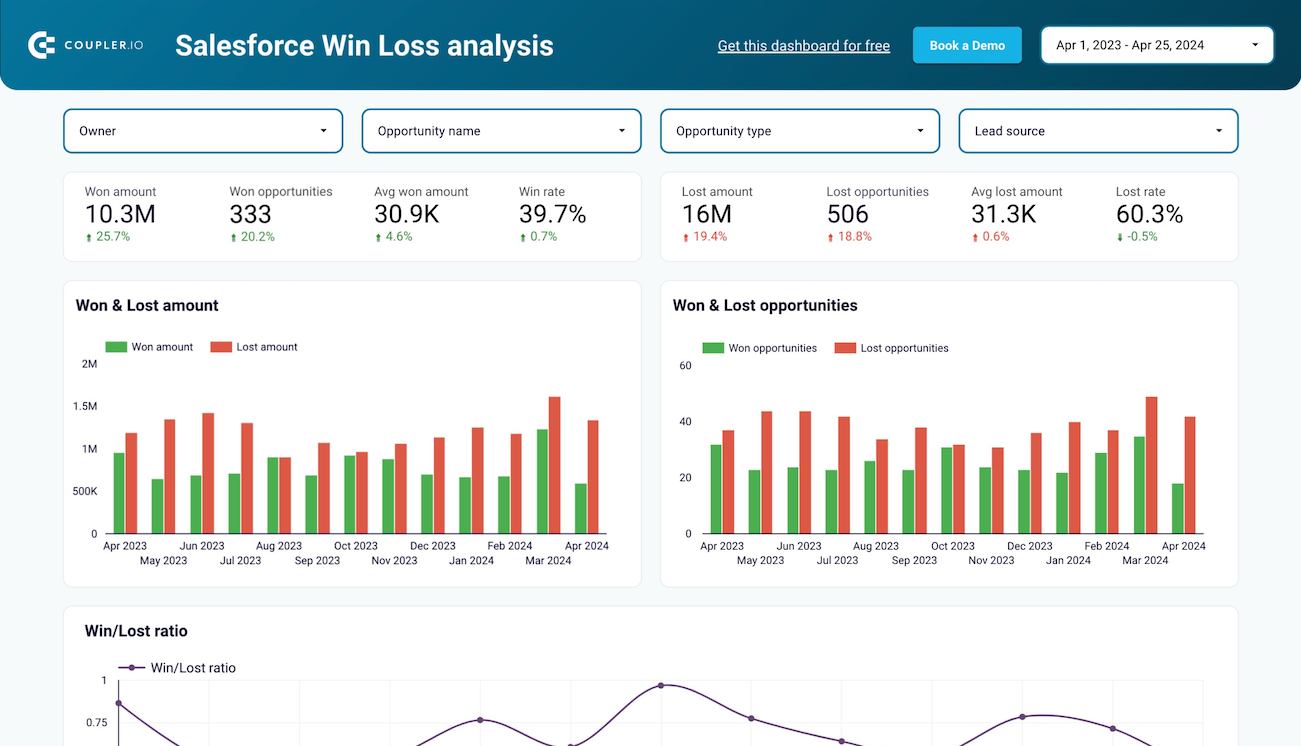
Get detailed analytics of your lost and won opportunities by amount, lead source, country, and more on one interactive dashboard.
Get an overview of your team's time and billing performance based on the Harvest data connected to the interactive dashboard.

Derive insights into how you can optimize your teams’ time efficiency with a ready-to-go analytics dashboard connected to Harvest.
Increase your team’s productivity by analyzing how time is spent across projects and clients using the Clockify analytics dashboard for Google Sheets.

Use a powerful Clockify analytics dashboard that provides insights into how you can increase the time efficiency of your teams.
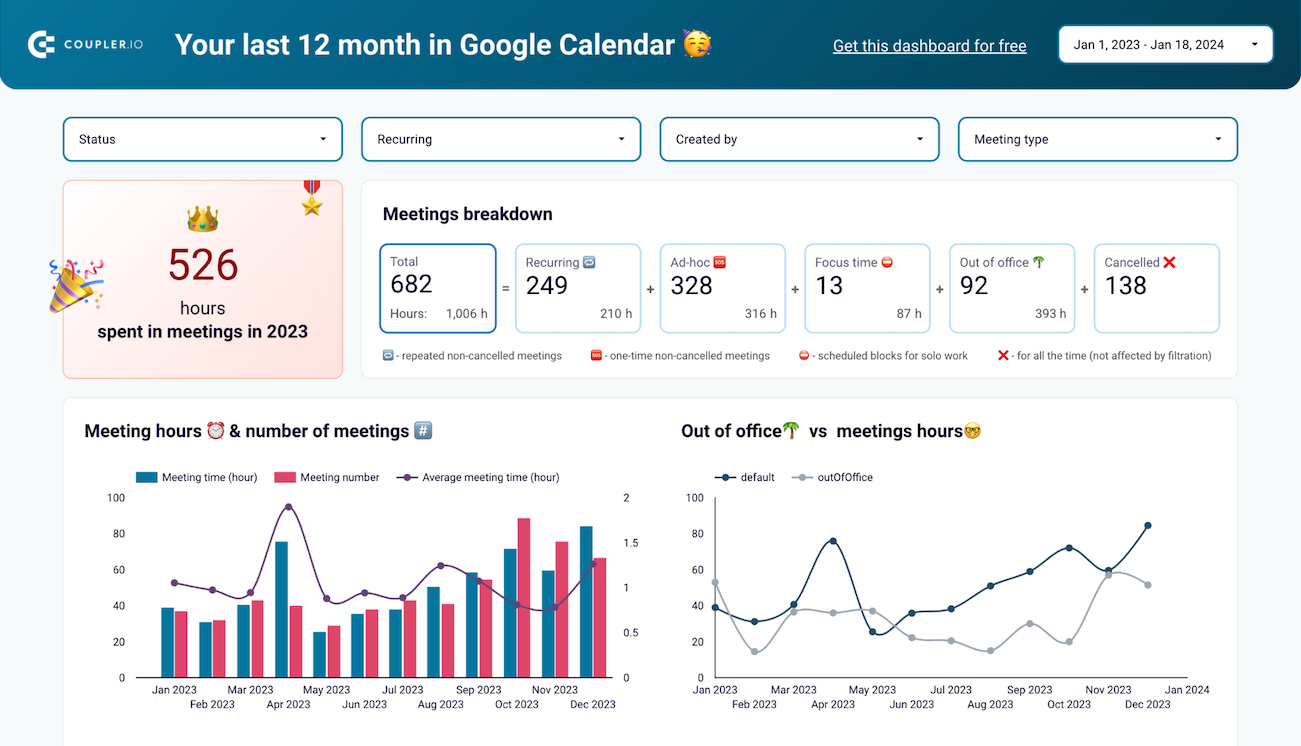
Use the Google Calendar dashboard to analyze your meeting-related information and derive time insights

Analyze events booked in Calendly to identify the most popular time slots and optimize your scheduling process. Align your calendar with demand to increase the performance of your team and processes.

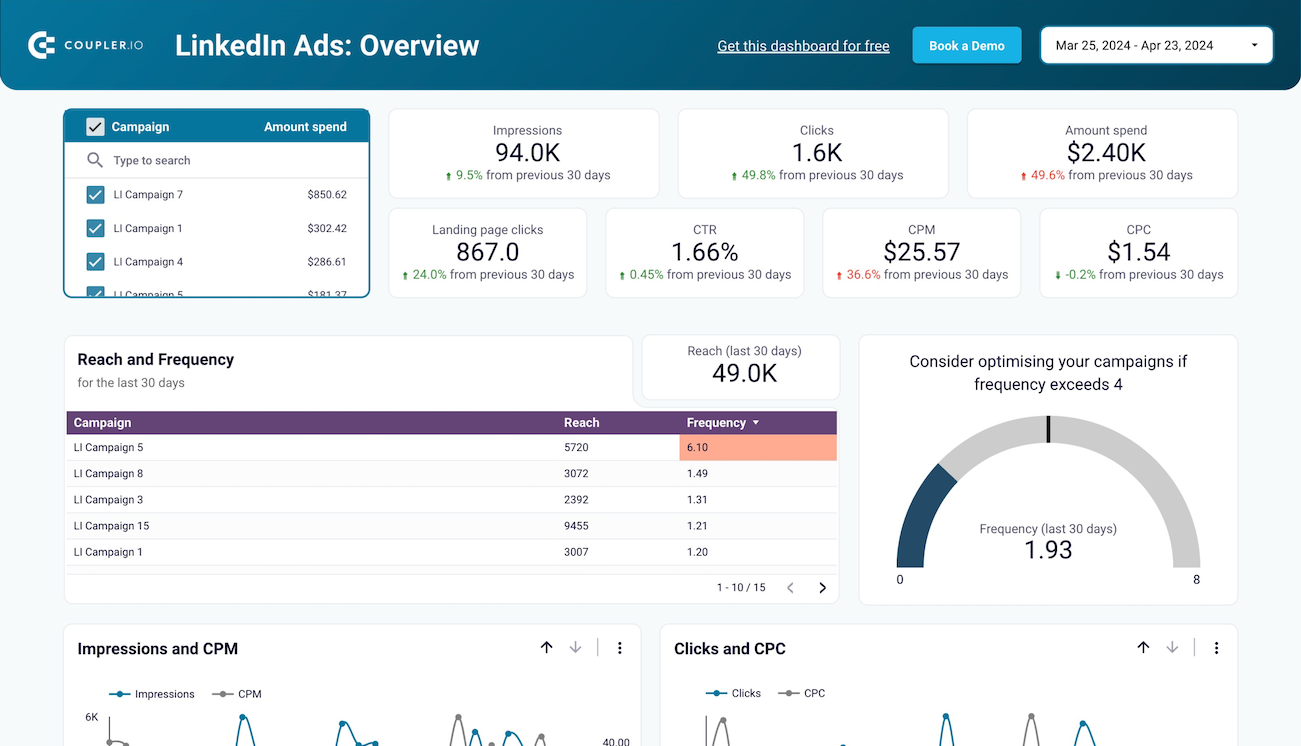
Get a data-based perspective to make decisions for optimizing your LinkedIn Ads advertising campaigns and improving their performance.
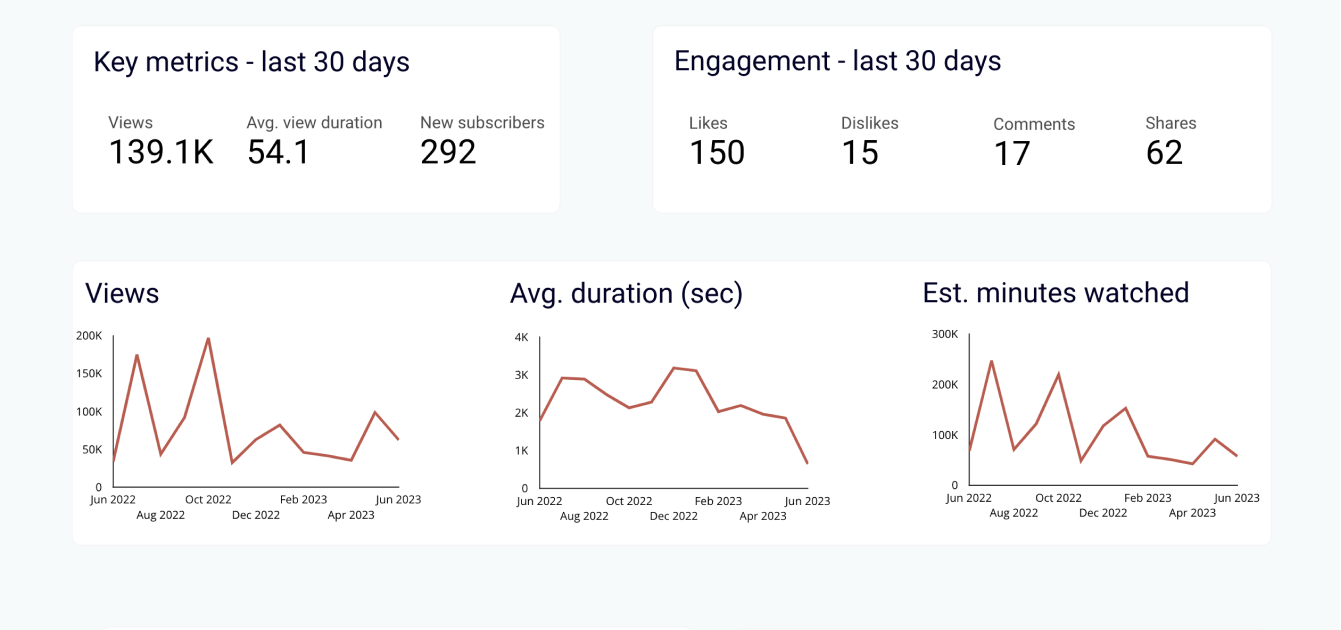
Get insights into how viewers discover and interact with your videos, track content performance, key metrics, and define your YouTube strategy.


Monitor the performance of your traffic, analyze the conversion funnel, and derive other insights from Google Analytics 4.


Track and analyze the performance of your advertising campaigns across various platforms using a one-stop PPC dashboard in Tableau
The requested dashboard is not in our gallery. Contact us for a customized solution.
Connect your favorite apps and get data in minutes


